Friday, October 31, 2014

Government Spending Boosts Q3 GDP

Popular Economics Weekly

WASHINGTON (MarketWatch) — The U.S. economy grew by a 3.5 percent annual rate in the third quarter, fueled by a surge in exports and the biggest jump in federal spending in five years, screamed one headline this morning.

That is all we need to know to understand why US economic growth is finally returning to the long term average that has prevailed since the Great Depression. This is in spite of the Great Recession and a busted housing bubble that is taking years to recover, record wealth inequality that has kept consumers from spending, and ultra-conservative House Republicans that have refused to allow even the most basic public works spending; such as to repair and replace the roads and bridges that have so fallen into disrepair, not to speak of keeping up with the educational needs of a growing population.

image

Graph: Calculated Risk

This first graph from Calculated Risk shows the increasing contribution to GDP for residential investment (RI) and state and local governments since 2005. It’s the beginning of recovery from the huge slump in RI during the housing bust (blue), followed by the unprecedented period of state and local austerity (red) not seen since the Depression.

It doesn’t tell the whole story, of course, as continuing austerity policies that cut government spending and some taxes in Japan and Europe have kept them in recession, whereas the pro-growth actions of the Fed (and boosting of some taxes) have reduced the budget deficit and kept the US government solvent.

It is a phenomenal recovery, even a miracle that this could even happen with a Congress locked in a battle over ideologies, and race. So it is thanks mainly to Ben Bernanke and Janet Yellen’s Federal Reserve QE actions, in particular, part of their pro-growth policies that pushed interest rates (especially long term rates) to record lows, just because the Fed could act outside of politics as usual.

“What’s more, the U.S. is adding jobs at the fastest rate since the recession ended in 2009 and consumers are feeling the most confidence in seven years, buoyed by a rising stock market and falling gasoline prices. As a result, most analysts believe the U.S. is likely to expand at a 3 percent pace or so in the fourth quarter to string together the best stretch of economic growth since before the Great Recession,” said the MarketWatch announcement.

So government spending was the largest contributor, up 10 percent mostly for defense, and exports up 7.8 percent annually. State and local governments’ spending rose 1.3 percent, and consumer spending slowed to a 1.8 percent annual pace from 2.5 percent in the prior quarter.

Business investment on equipment decelerated from the second quarter’s 11.2 percent gain to 7.2 percent, but is still strong. Residential housing investment grew at a low 1.8 percent rate after an 8.8 percent increase in the spring.

What does all this data mean? That there are ways around Congressional gridlock, if the executive branch and Federal Reserve concentrate on pro-growth policies that keep interest rates low, raise taxes sufficiently to lower the budget deficit, lower health care costs, support collective bargaining of employees, as well as lobby for higher household incomes to boost consumer spending (and the housing market).

And best of all, this happened with very low inflation, in spite of warnings that more government spending and the Fed’s QE policies would cause soaring inflation. Instead inflation as measured by the PCE index rose just 1.2 percent annually, down from 2.3 percent in Q2, as cheaper energy prices has kept inflation ultra-low. Even the core PCE that excludes food and energy rose just 1.4 percent.

We can now say officially that we have that goldilocks economy that prevailed through the 1990s; not too hot or too cold that will boost economic growth for years to come, if Congress can be ignored.

Harlan Green © 2014

Follow Harlan Green on Twitter: https://twitter.com/HarlanGreen

Wednesday, October 29, 2014

Consumer Confidence Soaring, Case-Shiller Home Prices Unchanged

Popular Economics Weekly

Why are stock prices rallying?  Maybe it’s because though housing price increases have slowed, consumer confidence is soaring for the holidays.  The prospect for future job and income growth looks good, in other words

Home prices contracted for a 4th straight month in August in Case-Shiller 20-city data, down 0.1 percent vs expectations for a gain of 0.1 percent. This is while consumer confidence rose to a post-recession high, a good sign for increased holiday spending.

Month-to-month prices declined in just 3 of the 20 cities, monthly—Charlotte, NC, San Diego, and San Francisco—with San Francisco, Las Vegas and Miami prices up the most year-over-year.

So though the 20-city monthly average fell sharply, annual year-on-year overall prices are still a plus 5.6 percent from plus 6.7 and 8.0 percent in the two prior months for the 20-city index. The 5.6 percent rate is the lowest since November, says Econoday.

image

Graph: Econoday

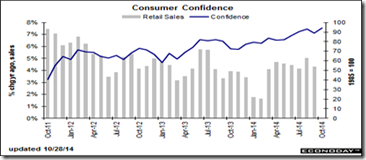
This is while the Conference Board’s Consumer Confidence Index for October is at a new recovery high of 94.5, up from an upwardly revised 89.0 in September and surpassing the previous recovery high of 93.4 in August. The last time the index reached this level was in October 2007, right at the beginning of the Great Recession.

image

Graph: Econoday

October's gain is concentrated almost entirely in the expectations component, which jumped 8.6 points to 95.0 in a reading that is close to February 2011's 97.5. The strength in expectations reflects optimism in the outlook for both jobs and income, both of which show convincing gains in this month's report.

Despite improved housing conditions and low interest rates (as low as 3.625 percent for the conforming 30-yr fixed rate today), tight credit conditions continue to be a barrier for some buyers, as we have said in past columns. Of the reasons for not closing a sale, about 15 percent of Realtors in September reported having clients who could not obtain financing, reports the NAR.

image

Graph: Calculated Risk

Lastly, the so-called price-to-rent ratio tells us that prices are again rising faster than rents, and are above the long term ratio of 1:1. This means that housing prices are growing faster than rents again. Ergo, prices cannot continue this trend for long, since rent increases mirror actual income increases, whereas prices rise or fall for a number of reasons. This includes the perception that housing prices will continue to rise (due to irrational exuberance, which is an early sign of housing inflation) and perhaps ultra-low interest rates, which must eventually rise to more normal levels.

On a price-to-rent basis, the Case-Shiller National index is back to February 2003 levels, the Composite 20 index is back to September 2002 levels, and the CoreLogic index is back to July 2003, reports Calculated Risk.

So are we at the beginning of another housing bubble? Probably not, because the main cause of the current price increases is inadequate new home construction to meet the demand for housing (which is rental housing, at the moment), rather than oversupply of new homes that caused the housing bubble.

Harlan Green © 2014

Follow Harlan Green on Twitter: https://twitter.com/HarlanGreen

Tuesday, October 28, 2014

NRA Uses Gun Violence to Maximize Profits

Financial FAQs

How can we believe the National Rifle Association opposes gun violence when every mass murder committed with guns is answered by the NRA’s call to buy more weapons? There have been 3 mass killings by crazed gunmen just over the past week, and the gun industry’s reponse via the NRA is that guns don’t kill people, people kill people.

The latest attempt by the gun industry to boost sales is to compete with a Washington State ballot initiative that limits gun sales. Initiative 594 would require universal background checks, whereas their Initiative 591 bars universal background checks. Guess which one is backed by the gun industry? So restricting gun sales via universal background checks won’t stop the killers? Really?

It means those gun makers who fund the NRA are directly responsible for the bizarre mass shootings that have discriminately killed so many children and adults. Their only answer has been to blame the victims who hadn’t purchased guns (with high capacity magazines) for not being ‘cocked and ready’ when a crazed gunman commits mayhem.

Yet large capacity ammunition magazines are the common thread uniting all of the high-profile mass shootings in America, according to the Washington DC Violence Policy Center that listed the mind-numbing results—42 mass killings from 1984 to June 2013, with 380 killed and 365 wounded by the gunmen. Two of the shooters used assault rifles with 75-round high capacity drum magazines enabling the huge body count.

The shooter who killed 20 children and 7 adults at Sandy Hook Elementary School in Newtown, Connecticut in 2012 equipped his assault weapon with 30-round magazines, which enabled him to fire 154 rounds in less than five minutes.

The gunman in Tucson, Arizona who killed six people and injured 13 others, including U.S. Representative Gabrielle Giffords, in a supermarket parking lot in 2011, used a handgun equipped with a 33-round magazine.  His shooting spree was only interrupted when he was tackled by a bystander as he finally stopped to reload his weapon.

We have to look at when gun manufacturers began to manufacture large magazine weapons in order to increase their profits for the origins of the mass killings. In fact, prior to the 1980s, the most popular type of handgun was the revolver, which typically holds six rounds of ammunition in a rotating cylinder. During the 1980s, however, the firearms industry began mass producing and marketing semiautomatic pistols, which can accept ammunition magazines.

In 1980, semiautomatic pistols accounted for only 32 percent of the 2.3 million handguns produced in America.9 By 2008, however, such pistols accounted for 76 percent of the 1.8 million handguns produced that year.

How has the gun industry been able to fool so many people for so long on the facts of gun violence? Factcheck.org points out how the NRA’s reflex response to any gun violence is to mount truly bizarre campaigns that deny any culpability for the mayhem.

The NRA’s response to the Sandy Hook Elementary School killing of 20 children and 7 adults is but one example. "We need to have every single school in America immediately deploy a protection program proven to work -- and by that I mean armed security," said the NRA’s Wayne LaPierre just one week after the massacre.

Why would the NRA so blatantly ignore the revulsion felt by so many over the massacre? New Jersey Governor Chris Christy highlighted the callous absurdity of Wayne Lapierre’s response. “In general I don't think that the solution to safety in schools is putting an armed guard because for it to be really effective in my view, from a law enforcement perspective, you have to have an armed guard at every classroom,” he said. “Because if you just have an armed guard at the front door then what if this guy had gone around to the side door? There's many doors in and out of schools.”

So the gun industry would be much happier it they could sell every teacher a firearm that would have to be kept in every classroom to be an effective deterrent. That would really boost their profits!

The Sandy Hook massacre even caused the U.S. Senate to attempt to take action to tighten gun regulations with universal background checks, including for gun show and online sales. Yet it was still voted down because of a multi-million dollar lobbying campaign by the gun industry.

“I agree wholeheartedly with the goal of the NRA,” Joe Manchin, one of the bill’s sponsors. “I was surprised when the latest alert from the NRA was full of misinformation. ... They are telling members that our legislation would criminalize the private transfer of firearms by honest, law-abiding citizens. ... That is a lie.”

The Brady Campaign To Prevent Gun Violence spells out the loopholes that allow gun sales to grow and gun companies to make even more profits. Online and gun show sales require no background checks, even though the Bureau of Tobacco and Firearms documents U.S. gun shows as a major source of bulk weapons’ sales to Mexican Drug Cartels.

The NRA’s excuses for Elliot Rogers Isla Vista, California, mass murder was that it was the result of California’s stringent gun regulation that prevents lawful citizens from owning guns. But that is an outright lie, as the California law only bans assault rifles with large magazine clips. California has banned the sale of Semi-automatic firearms that the state has classified as assault weapons, .50 BMG caliber rifles, and magazines that can hold more than ten rounds of

Since 2005, the gun industry and its corporate allies have given between $20 million and $52.6 million to the NRA through the NRA Ring of Freedom sponsor program. Donors include firearm companies like Midway USA, Springfield Armory Inc, Pierce Bullet Seal Target Systems, and Beretta USA Corporation. Other supporters from the gun industry include Cabala's, Sturm Rugar & Co, and Smith & Wesson.

And industry profits have soared. According to the Christian Science Monitor, $6 billion in estimated revenue was earned by the US gun and ammunition manufacturing industry in 2012, according to a financial report by the research firm D&B First Research based in Austin, Texas. The major manufacturers include Browning Arms, Freedom Group, Olin, Aliant Tech Systems, Sturm, Ruger & Company, and Smith & Wesson.  The biggest companies are Ruger and Smith & Wesson, which represent about 30 percent of the industry.

The estimated number of guns in circulation in the United States as of 2009 was 310 million, according to a survey from the National Institute of Justice. That number includes 114 million handguns, 110 million rifles, and 82 million shotguns. The number of available guns has increased 62 percent since 1994, when there were about 192 million firearms in circulation. "Per capita, the civilian gun stock has roughly doubled since 1968, from one gun per every two persons to one gun per person," according to a report from the Congressional Research Service.

Need we say more to uncover the tactics used by gun manufactures to increase their profits, regardless of public safety concerns? The Brady Campaign’s numbers tell it all:

  • One in three people in the U.S. know someone who has been shot.
  • On average, 32 Americans are murdered with guns every day and 140 are treated for a gun assault in an emergency room.
  • Every day on average, 51 people kill themselves with a firearm, and 45 people are shot or killed in an accident with a gun.
  • The U.S. firearm homicide rate is 20 times higher than the combined rates of 22 countries that are our peers in wealth and population.
  • A gun in the home is 22 times more likely to be used to kill or injure in a domestic homicide, suicide, or unintentional shooting than to be used in self-defense.

Gun manufacturers and the NRA are maximizing profits at the expense of public safety. They have become in fact a danger to civil society, rather than protector of public safety.

Harlan Green © 2014

Follow Harlan Green on Twitter: https://twitter.com/HarlanGreen

Pending and New-Home Sales Looking Up

The Mortgage Corner

Sales of new single-family houses are barely budging from their recession lows. But pending home sales for September nudged up to the highest this year, which is a sign that record low interest rates are bringing buyers back into the market.

Pending sales rose slightly in September and are now above year-over-year levels for the first time in 11 months, according to the National Association of Realtors.

The Pending Home Sales Index inched 0.3 percent to 105.0 in September from 104.7 in August, and is now 1.0 percent higher than September 2013 (104.0). The index is above 100 for the fifth consecutive month and is at the second-highest level since last September, reports the National Association of Realtors.

Lawrence Yun, NAR chief economist, says moderating price growth and sustained inventory levels are keeping conditions favorable for buyers. “Housing supply for existing homes was up in September 6 percent from a year ago, which is preventing prices from rising at the accelerated clip seen earlier this year,” he said. “Additionally, the current spectacularly low mortgage rates should help more buyers reach the market.”

Despite improved housing conditions and low interest rates (as low as 3.625 percent for the conforming 30-yr fixed rate today), tight credit conditions continue to be a barrier for some buyers. Of the reasons for not closing a sale, about 15 percent of Realtors in September reported having clients who could not obtain financing as the reason for not closing.

Yun says the final rule on Qualified Residential Mortgages should improve access to credit once it goes into effect next year. “The rule provides clarity for lenders and is a win for creditworthy consumers by ensuring they continue to have access to safe and affordable loan products without overly burdensome down payment requirements,” he said.

And Mel Watt, the newly appointed Director of FHFA that oversees Fannie Mae and Freddie Mac just announced he would be easing credit standards for the largest guarantors of residential mortgages.

But it is a two-edged sword, according to pundits. Watt said that Fannie and Freddie are working to develop “sensible and responsible” guidelines that will allow them to buy mortgages with down payments as low as 3 percent, instead of the 5 percent minimum that both institutions currently require. But lenders will not have to retain earnings to cover any losses, which means they could again begin to offer subprime mortgages (but that are not sold to Fannie or Freddie).

This change would apply to a “targeted segment of creditworthy borrowers” and take into account “compensating factors,” Watt said. (Housing experts speculate that maybe the lower down payments would only be offered to first-time buyers.) More details to come in the weeks ahead, Watt added.

But these provisions should boost sales to first time homebuyers, in particular who might not be able to afford larger down payments.

new sales

Graph:Calculated Risk

Sales of newly built, single-family homes inched up 0.2 percent in September to a seasonally adjusted annual rate of 467,000 units, the highest level in six years. Sales numbers for August were revised down from 504,000 to 466,000.

“Three consecutive months of sales upticks demonstrate steady growth in the housing market,” said Kevin Kelly, chairman of the National Association of Home Builders (NAHB). “Consistent job creation and low mortgage interest rates are spurring the release of pent-up consumer demand.”

So new-home sales have to improve, as well, to enlarge the housing inventory. Right now, most of housing construction is now multi-family dwellings to absorb the increasing demand for rental housing.

Harlan Green © 2014

Follow Harlan Green on Twitter: https://twitter.com/HarlanGreen

Monday, October 27, 2014

The Mystery of Money: Understanding the Modern Financial World

Harlan Green “Unpacks” the Money Metaphor--Book Review by Mark Whitehurst / CASA MAGAZINE

Yelling “Show me the money!” usually only works in the movies, but Harlan Green’s down to earth book, The Mystery of Money: Understanding the Modern Financial World, recently published by Publishing by the Seas, Inc., opens new doors into how the realm of money really works.

Creating perspectives on how money functions and doesn’t function is what local author and columnist Green accomplishes with this book, which is a quick and easy read at 85 pages.

“Demystifying financial information for readers has always been my goal over the past thirteen years amid the breathtaking real estate and credit bubbles that have transformed both domestic and world financial markets,” writes Green in The Mystery of Money’s introduction.

Over the years, Green has been a financial columnist for The Huffington Post; Popular Economics Weekly; CASA Magazine; and the Santa Barbara News Press.

Using common knowledge and experiences that were the result of the Great Recession and the Subprime Debacle as a starting point, Green provides readers with a social connection to money. It’s a connection that continues to be disconcerting, and Green tells it like it is.

“The shocking truth was that much of the so-called ‘complexity’ was caused by willful obfuscation — the disguising of financial information via many exotic derivatives and insurance vehicles that were off the glance sheets of financial institutions,” Green explains.

Green’s explanations lead to key points of reference and how to negotiate and mediate definitions and ideas about money.

He literally opens up a discussion on the art of negotiation, using some of his personal experiences as a mortgage broker.

“The one Golden Rule of any negotiation is never to feel rushed into making a decision,” he comments.

Green moves through the classic view of Herd behavior; Imperfect Financial Markets; Decision-Making; Irrational Exuberance; Managing Big Data; Personality Cults and Charismatic CEOs; and the Mystery of Real Wealth in nine chapters and an introduction.

The book, The Mystery of Money: Understanding the Modern Financial World, will soon be available at local book stores and is available from Amazon.

Thursday, October 23, 2014

California’s Fracking Controversy

Financial FAQs

Santa Barbara voters have an upcoming ballot measure that bans all forms of enhanced drilling techniques, including steam injection and fracking, and it is getting national attention. Fracking supporters tout the huge boost in national oil and gas production that franking, or hydraulic fracturing of shale oil deposits to make extraction possible, that is making the U.S. more independent of foreign oil and gas..

But it is the well-documented loss of property values for those properties close to fracking sites, due to lax environmental regulations that govern fracking operations, that may be the biggest concern for Santa Barbara County voters in November.  Nearly 7,000 new wells are proposed locally.

The loss of property values comes from the 24/7 operation of fracking sites that generates so much pollution. Twenty-four hour, day-for-night lighting is required on the rigs, as well as noise and truck traffic from the transportation of the chemicals used—some toxic—in the drilling operation. But there are also fears of ground water contamination from toxic chemicals being injected into the wells.

And fracking operations are non-stop, thanks to the “Halliburton Loophole”, a 2005 amendment to the Clean Air and Water Acts that former VP Dick Cheney, former Halliburton CEO, pushed through Congress exempting fracking operations from almost all Environmental Protection Agency regulations.

“Coupled with existing exemptions to a variety of pollution laws like the Clean Air Act, the Resource Conservation and Recovery Act, the Superfund Act, and the Emergency Planning and Community Right to Know Act, the 2005 carve-outs gave the fracking industry seven total exemptions from important environmental regulations,” reported a recent truthout.org article.

And Congress has not as yet been able to close any of those exemptions. Even former congressional allies of Cheney, such as House Majority Leader Dick Armey, are regretting the Halliburton Loophole they supported at the time. Mr. Armey is one of the plaintiffs now suing the drilling companies that are causing loss of property values in his own Texas backyard from fracking operations.

California already has a thriving fracking industry. The majority of the state’s new and active wells are concentrated in Kern and Los Angeles counties, said a National Resource Defense Council report entitled Drilling in California: Who’s at Risk? However, expanded fracking in the large Monterey Formation could bring the oil and gas industry into more communities, especially in Ventura, Monterey, Fresno and Santa Barbara counties.

The NRDC report reveals that 14 percent of the state’s population—5.4 million Californians—already lives within a mile of at least one oil or gas well. Of that group, 69 percent—3.7 million residents—are people of color (45 percent Latino/Hispanic, 13 percent Asian, 8 percent African American and 3 percent other).

No less than business friendly Forbes Magazine published a study documenting the loss of property values from hydraulic fracturing for those property-owners near fracking sites, with the headline Pollution Fears Crush Home Prices Near Fracking Wells.

“Researchers from the University of Calgary and Duke University studied property sales from 1994 to 2012 in 36 Pennsylvania counties and seven counties in New York,” said Forbes in describing the study. “They mapped sales against the locations of shale-gas wells, and they compared homes connected to public drinking-water systems to homes with private wells.


“Properties with private wells suffered a loss in value compared to properties connected to a municipal water system, they found, offsetting gains in value from mineral-rights royalties. The loss varied with distance from the nearest shale-gas well. At 1.5 kilometers, properties with private wells sold for about 10 percent less.”

Properties suffered greater losses when closer to shale-gas wells where hydraulic fracturing had been employed. Within 1 km of shale gas wells, properties with private drinking water wells dropped 22 percent in value. Properties connected to public water suffered no losses, but also showed no net gains.

There are a host of factors that cause this, said the study, from the noise and toxic smells of fracking machinery (methane and sometimes Hydrogen Sulfide gases are released), to growing evidence of pollution of ground water from the toxic chemicals used. Sulfuric acid is one of the chemicals used to dissolve the oil-bearing shale.

And then there’s the real danger of earthquakes from injecting waste water back into the ground, which have been occurring with increasing frequency in some Oklahoma fracking fields, reports NPR Radio in a July 2014 broadcast by Linda Wertheimer.

Denver, Colorado had the same problems with so-called natural gas injection wells back in the 1960s, and played a critical role in discovering the link between forced injection wells and induced earthquakes.

“In the mid-1960s, Denver experienced a series of quakes believed to have been caused by a 12,000-foot deep wastewater disposal well at Rocky Mountain Arsenal, according to a June 2014 report by Denver’s NBC Channel 9. It culminated in a 5.3 magnitude quake on August 9, 1967 that remains the strongest recorded earthquake in Denver's history, after which the well was decommissioned and the Army began to remove the wastewater it had pumped below the surface.

There are currently more than 1.1 million active oil and gas wells in the United States, and more than 15 million Americans now live within a mile of the hundreds of thousands that have been drilled since 2000, according to an analysis by the Wall Street Journal. Made possible by the advent of fracking, drilling is taking place in shale formations from California to New York and from Wyoming to Texas.

And there’s no indication that this “unprecedented industrialization” shows any signs of slowing. Almost 47,000 new oil and natural gas wells were drilled in 2012, and industry analysts project that pace will only continue.

Even Exxon CEO and board chairman Rex Tillerson, is suing to stop construction of a water tower that would supply nearby drilling operations because of the nuisance of, among other things, heavy truck traffic, noise and traffic hazards from the fracking operations the tower would support.

So the CEO of the single largest drilling company in the world acknowledges the “constant and unbearable nuisance” that would come from having “lights on at all hours of the night …traffic at unreasonable hours … noise from mechanical and electrical equipment.” And Tillerson’s lawsuit – filed in 2013 with other plaintiffs, including former House Majority Leader Dick Armey – claims the project would do “irreparable harm” to his property values, in papers filed for the Denton County, Texas lawsuit.

One little noticed side effect is that the secondary mortgage market hasn’t caught up with the risk of loaning on properties affecting by fracking, which means such properties could be harder to finance. Housing Wire has reported on a webinar entitled, “Oil and Gas Exploration for Mortgage Bankers,” in which Daniel McKenna, with the Ballard Spahr’s Mortgage Banking Group said, “The loans are actually low risk. But Fannie, Freddie, the FHA and the VA prohibit gas leases on their loans. There are a ton of different regulations that impact selling these loans on the secondary market.”

The Calgary and Duke University study of property values near shale gas wells has caused a 10 percent drop in values, but with fracking operations, values dropped some 22 percent in value. So it does look like the “Halliburton Loophole” that exempts the fracking industry from almost all environmental regulations will make Californians, a notoriously environmentally-friendly state, wary of allowing it to operate closer to population centers, at the very least.

Harlan Green © 2014

Follow Harlan Green on Twitter: https://twitter.com/HarlanGreen

Tuesday, October 21, 2014

Existing-Home Sales Highest in Year

The Mortgage Corner

The National Association of Realtors reports total existing-home sales, which are completed transactions that include single-family homes, townhomes, condominiums and co-ops, increased 2.4 percent to a seasonally adjusted annual rate of 5.17 million in September from 5.05 million in August. Sales are now at their highest pace of 2014, but still remain 1.7 percent below the 5.26 million-unit level from last September.

image

Graph: Calculated Risk

That has to be partly due to falling interest rates, with conforming 30-year fixed rates dropping as low as 3.625 percent for a 1 point origination fee in California. But also rents are soaring, up more than 10 percent year-over-year in five large rental markets -- San Francisco, Sacramento, Oakland, Denver, and Miami.

Lawrence Yun, NAR chief economist, says the improved demand for buying seen since the spring has carried into the fall. “Low interest rates and price gains holding steady led to September’s healthy increase, even with investor activity remaining on par with last month’s marked decline,” he said. “Traditional buyers are entering a less competitive market with fewer investors searching for available homes, but may also face a slight decline in choices due to the fact that inventory generally falls heading into the winter.”

image

Graph: Calculated Risk

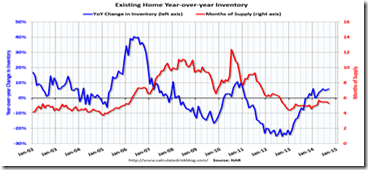
Total housing inventory at the end of September (blue line in graph) fell 1.3 percent to 2.30 million existing homes available for sale, which represents a 5.3-month supply (red line) at the current sales pace. This is far too few homes available for sale, which means a greater demand for new home construction. Despite fewer homes for sale in September, unsold inventory is still 6.0 percent higher than a year ago, when there were 2.17 million existing homes available for sale.

And housing prices continue to rise, though more slowly than last year. The median existing-home price for all housing types in September was $209,700, which is 5.6 percent above September 2013. This marks the 31st consecutive month of year-over-year price gains.

Why the falling interest rates? Worries of slower worldwide growth are worrying stock prices. The 10-year Treasury note yield dropped below 2 percent for the first time in 16 months. This has even caused Federal Reserve Vice Chairman Stanley Fischer to voice fears that the slowdown in the Eurozone in particular could slow U.S. growth. Why? Because it lowers the demand for U.S. goods and services.

Fischer said in a speech recently that, “if foreign growth is weaker than anticipated, the consequences for the U.S. economy could lead the Fed to remove accommodation more slowly than otherwise.”

Lawrence Yun added, “Economic instability overseas is leading to volatility in the stock market and is causing investors to seek safer bets, which will likely keep interest rates in upcoming weeks hovering near or below where they are now,” said  Yun. “This is welcoming news for consumers looking to buy, although they could temporarily become more cautious by less certain economic conditions.”

Of interest are all-cash sales, which tell us whether the mortgage markets are functioning better, or worse. Fewer all-cash sales generally mean banks are easing their credit standards. All-cash sales were 24 percent of transactions in September, said the NAR, up slightly from August (23 percent) but down from 33 percent in September of last year. Individual investors, who account for many cash sales, purchased 14 percent of homes in September, up from 12 percent last month but below September 2013 (19 percent). Sixty-three percent of investors paid cash in September. 

Distressed homes – foreclosures and short sales – increased slightly in September to 10 percent from 8 percent in August, but are down from 14 percent a year ago, another reason there are fewer all-cash purchases. Seven percent of September sales were foreclosures and 3 percent were short sales. Foreclosures sold for an average discount of 14 percent below market value in September (same as in August), while short sales were discounted 14 percent (10 percent in August). 

Harlan Green © 2014

Follow Harlan Green on Twitter: https://twitter.com/HarlanGreen

Monday, October 20, 2014

Deflation Is Now Major Concern

Popular Economics Weekly

We wrote recently about the Eurozone in danger of becoming Japan, which has suffered through some 2 decades of a deflationary spiral, before Prime Minister Abe opened the stimulus spigots. Why is deflation (or disinflation, which is lower inflation but not falling prices) such a bad thing?

Because it deflates everything, including profits, incomes and so job creation.   This starts a vicious circle of more job cuts and shrinking household incomes, which is what causes a recession, or depression. That danger is now slowly creeping into the U.S. economy, though the U.S.  is growing faster than almost all other developed countries at the moment.

Pundits, and even Fed Vice Chair Stanley Fischer are beginning to voice fears that the slowdown in the Eurozone in particular could slow U.S. growth. Why? Because it lowers the demand for U.S. goods and services.

Fischer said in a speech on Saturday that, “if foreign growth is weaker than anticipated, the consequences for the U.S. economy could lead the Fed to remove accommodation more slowly than otherwise.”

This means the Fed would have to keep interest rates at the so-called zero bound longer than it wants to. That’s because too much cheap money feeds asset bubbles, as happened with the housing bubble. So the European data added to a slew of fears that growth could be slowing across the world.

U.S. growth at present is doing very well with 4.6 percent growth in Q2 after the 2.1 percent shrinkage in Q1, and third quarter growth could exceed 3 percent based on recent inventory rebuilding numbers.

image

Graph: Trading Economics

But there are headwinds, as interest rates continue to plunge, which signals worries of slower worldwide growth that is hurting stock prices. The 10-year Treasury note yield dropped below 2 percent for the first time in 16 months. But the good news is it will stimulate more housing sales, as 30-yr conforming fixed mortgage rates have plunged to 3.75 percent with 0 origination points, and the Hi-Balance conforming fixe rate is just 3.875 percent with 0 points. So the worries of slower U.S. growth, at least, have no basis.

image

Graph: Econoday

In fact,U.S. industrial production is approaching its historical average. Industrial production jumped an outsized 1.0 percent in September after a decline of 0.2 percent in August. Forecasts were for 0.4 percent. Overall capacity utilization jumped to 79.3 percent from 78.7 percent in August, close to its 80.1 percent long term average.

Manufacturing was solid, rebounding 0.5 percent in September after a 0.5 percent decline the month before. Within manufacturing, the production of durable goods increased 0.4 percent in September, led by the aerospace and miscellaneous transportation equipment. The production of nondurable goods also moved up 0.5 percent in September. With the exception of petroleum and coal products, each of the major components of nondurables posted gains in September.

So the warnings are real, but somewhat exaggerated. Europeans cannot allow prolonged slow growth policies that emphasize deficit reduction over job creation programs for long. And Fed Vice Chairman Fischer just emphasized that job creation is more important for Fed policy makers, and why the Fed will keep interest rates low for as long as possible, given almost no inflation, to spur more job creation.

Harlan Green © 2014

Follow Harlan Green on Twitter: https://twitter.com/HarlanGreen

Thursday, October 16, 2014

Why Do We Need Wars for Great Recoveries?

Financial FAQs

Nobelist Paul Krugman has said history tells us it could take another world war, or similar mobilization effort to put everyone back to work and economic growth to return to historical levels from the Great Recession—even an Alien Invasion would do it, he once quipped

In fact, the Great Recession was the equivalent of the Great Depression, which took more than 10 years of massive infrastructure building, retooling of whole industries, and a World War to recover. But aren’t the wars are we are now fighting—against ISIS, Ebola, and global climate change—such equivalents?

What do we mean by that? Even the New Deal wasn’t enough to get us out of the Great Depression. It took the mobilization of everyone in the effort of producing and building things to defeat a worldwide danger. Government as well as the private sector was involved, as all governments are during wartime. Governments created the jobs and paid the bills that produced the millions of tanks, planes, and war equipment needed to defeat our enemies.

Well, it looks like we already have more world wars on our hands. ISIS has declared war on infidels and apostates, the Ebola Virus could infect and maybe kill tens of not hundreds of thousands, and climate change that is scheduled to flood major coastal cities by 2050.

The Pentagon has even said that global climate warming could provoke more wars and cost $trillions in lost property and foodstuffs if not dealt with soon. "Climate change will affect the Department of Defense ability to defend the nation and poses immediate risks to U.S. national security," it has reported.

And for the Ebola virus? the most authoritative model, at the moment, suggests a potential economic drain of as much as $32.6 billion by the end of 2015 if “the epidemic spreads into neighboring countries” beyond Liberia, Guinea and Sierra Leone, according to a recent study by the World Bank. This includes the possibility of the quarantine of whole countries, and the consequent reduction in world travel and trade.

The war against ISIS is also predicted to not only be very long, but very expensive. In a critically important article Harvard Professor Linda Bilmes wrote for the Boston Globe this week, the author of The Three Trillion Dollar War (with Nobel Prize winning economist Joseph Stiglitz) points out that although the US has already spent approximately one billion dollars thus far on President Obama’s plan to “degrade and destroy” ISIS, the price tag is going to climb steeply — and quickly — from there. Direct costs of the president’s plan will likely be on the order of $22 billion per year, but that is only the start.

Shouldn’t this call for mobilization of a nationwide campaign to defeat these enemies that threaten not just US, but the rest of the world? The 2014 Climate Change Adaptation Roadmap anticipates that rising temperatures, changing precipitation patterns, climbing sea levels and more extreme weather events will collectively have a profound effect on U.S. security:

‘In our defense strategy, we refer to climate change as a "threat multiplier" because it has the potential to exacerbate many of the challenges we are dealing with today – from infectious disease to terrorism. We are already beginning to see some of these impacts,” said the report.

A 127-page UN study on global warming “leaked” to Bloomberg News includes a 32-page summary and is filled with language highlighting the dangers from rising temperatures. Those include damage to crop production, rising sea levels, melting glaciers and more pervasive heatwaves. The report mentions the word “risk” more than 350 times; “vulnerable” or “vulnerability” are written 61 times; and “irreversible” comes up 48 times.

Possible permanent changes include the melting of the ice sheet covering Greenland. That would boost sea levels by as much as 7 meters (23 feet) and threaten coastal cities from Miami to Bangkok along with island nations such as the Maldives, Kiribati and Tuvalu.

This means putting everyone to work that wants to. It can be mass employment to rebuild the $2.2 Trillion in deferred infrastructure and climbing that the U.S. Society of Civil Engineers has been warning about, or putting the 11 million unemployed back to work building more schools, or cleaning up our environment, or replanting forests, or even rebuilding some of those homes that need to replace those lost during the housing bust.

There is currently a shortage of available homes with rental costs rising sharply. Government could subsidize the refinancing of home loans, as was done during the New Deal by the Home Owners Loan Corporation (HOLC). By the HOLC’s final year in 1936, it had provided just over a million new mortgages, had lent out approximately $350 billion ($750 billion today), and by 1934 about one in five mortgages in America were owned by the corporation. This is in contrast to just $1.8 billion spent by the Obama administration to date in subsidizing today’s distressed housing market.

Why not find a way to mobilize all our resources to fight those wars? GW Bush understood that government spending was required to fight his Wars on Terror, yet left us with the massive federal deficit because he wouldn’t mobilize and unite all Americans to participate. Instead he cut taxes sharply, rather than use the Clinton budget surplus to pay for it.

President Obama could cite the urgency to combat the spread of Ebola as well as ISIS in order to spend what is necessary to boost U.S. economic strength now. We have known since the Korean War that governments had to spend to create prosperity in peacetime as well as wartime. And what happens when we have another Hurricane Sandy or more Katrinas? Does anyone believe that we can’t afford to build what is necessary to prevent more natural disasters?

It’s only when those lessons of Great Depressions and wars are forgotten that we listen to the wrong people, forget we are a United States, and have the power to defeat these enemies.

Harlan Green © 2014

Follow Harlan Green on Twitter: https://twitter.com/HarlanGreen
Monday, October 13, 2014

Fannie/Freddie, Home Prices in Good Shape

The Mortgage Corner

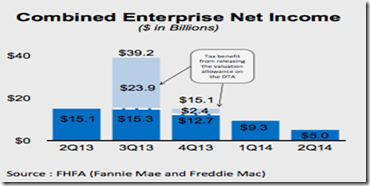
Government-sponsored enterprises Fannie Mae and Freddie Mac brought in a combined second-quarter net income of $5 billion, nearly half of the $9.3 billion the two made in the first quarter of 2014, the Federal Housing Finance Agency’s Quarterly Performance Report of the Housing GSEs stated.   But the decline is attributed mainly to lower income from private-label mortgage-related securities settlements.

image

Graph: Housing Wire

On the other hand, both enterprises reported that continued improvement in national home prices contributed to releases of loan loss reserves at both enterprises, with combined loan loss reserves decreased $4.5 billion during the quarter. Since Dec. 31, 2013, combined loan loss reserves at the GSEs declined 10%, or $7.1 billion to $64.9 billion.

To put it in perspective, for the first half 2014, the Fannie and Freddie reported combined net income of $14.3 billion, driven by proceeds from legal settlements in the first quarter, as GSE and FHFA continued to reach agreements with a number of financial institutions to cover claims in connection with the purchases of Private Label Securities. Bank of America is the latest to settle a record $16.5 billion lawsuit on its mortgage malpractices, much of it due to the purchase of Countrywide Financial with its subprime mortgages.

The Case-Shiller Price Index of 3-month same-home prices continues to slow, but is still up 6.7 percent year-over-year. Fourteen for the 20-city sample show declines in the month with Chicago and Minneapolis showing the most severe declines, at minus 1.6 percent in the month. Three cities show no change leaving three with gains led by Las Vegas at only plus 0.3 percent.

image

Graph: Econoday

Lawrence Yun, NAR chief economist, says price increases are balancing out to the benefit for both buyers and sellers. “National median home prices began their most recent rise during the first quarter of 2012 but had climbed to unsustainable levels given the current pace of inflation and wage growth,” he said. “At this slower but healthier rate, homeowners can continue steadily building equity. Meanwhile, for buyers, increased supply with moderate price gains is giving them better opportunities to choose.”

image

Graph: Black Knight

So the real problem is how to preserve the home owning advantages that Fannie Mae and Freddie Mac guaranteed mortgages have enabled since World War II. The Obama administration wants to abolish and replace the GSEs with some kind of secondary market clearing house that will guarantee and package these conforming and Hi-Balance conforming mortgages for investors that provide the same security to investors with their strict underwriting criteria that has kept default rates low, historically.

There really is no reason to attempt to reinvent these very successful ‘wheels’ that only failed because of the Great Recession. They have already made the US Treasury a profit on what was lent to them, and with adequate capitalization would continue to service homeowners in ways that the so-called Private Label mortgages have never been able to do.

Harlan Green © 2014

Follow Harlan Green on Twitter: https://twitter.com/HarlanGreen

Thursday, October 9, 2014

IMF Report—Europe Is Becoming Japan

Financial FAQs

The International Monetary Fund doesn’t want to say it outright, but its latest World Economic Outlook shows more stagnation of the European and Japanese economies, and the possibility of a third EU recession since 2008.

Could the EU become another Japan with its 20 years of downward spiraling deflation and slow economic growth that caused its economy to fall from second to forth in size, behind the U.S., Euro area, and China? We think so, if its austerity policies aren’t reversed. Instead of reducing deficits, more public spending should be allowed when private sector businesses and households are saving more and spending less.

EU GDP growth shrank -0.7 and -0.4 percent in 2012, 2013 respectively and the Euro Area is projected to grow just 0.8 percent in 2014. IMF chief economist Olivier Blanchard said in his blog that “Growth in the euro area nearly stalled earlier this year, even in the core.  While this reflects in part temporary factors, both legacies (ie, debt), primarily in the south, and low potential growth, nearly everywhere, are playing a role in slowing down the recovery.”

image

Trading Economics

And “Japan is growing, but high public debt inherited from the past, together with very low potential growth going forward, raise major macroeconomic and fiscal challenges,” said Blanchard. Japan’s economy grew 1.5 percent in 2012 and 2013, and is projected to grow 0.9 percent in 2014, according to the IMF. This is when U.S. GDP is projected to grow 2.2 percent in 2014 and 3.1 percent in 2015, according to the IMF.

Why the stagnation when Europe and Japan are now the second and fourth largest economies in the world, as we said? Much of it has to do with their own economic policies that underestimated the depth of their respective asset bubbles causing major recessions when they burst. And so both economies suffered in their own way from misplaced austerity policies.

image

Japan’s malaise has been ongoing since 1995, due in large part to its kieretsu system of interlocking industry ownerships that kept policymakers from writing down bad debts in a timely manner. Good money was thrown after bad debt in an attempt to rescue ailing companies and industries. This resulted in decades of downward spiraling deflation that only now is being addressed by their new Prime Minister Abe with massive public spending that is finally curing the deflation, at least.

Yet the EU has still not reversed their austerity policies of public spending cuts, though EU Central Bank head Mario Draghi has announced a program of Quantitative Easing, much like the Fed’s QE programs.

As Nobelist Paul Krugman said on the Bill Moyers Show ( and many other times),“ “The only obstacles to putting people to work, to having those lives restored, to producing hundreds of billions, probably 900 billion a year or so of extra valuable stuff in our economy, is in our minds. If I could somehow convince the members of Congress and the usual suspects that deficit spending, for the time being, is okay, and that what we really need is a big job creation program, and let’s worry about the deficit after we’ve had a solid recovery, it would all be over. It would be no problem at all… All the productive capacity is there. All that’s lacking is the intellectual clarity and the political will.”

That is of course what happened with the New Deal, though it took World War II to put everyone back to work. But European policymakers seem to have ignored the lessons of the Great Depression, and the truths in Thomas Piketty’s Capital in the Twenty-First Century, in which he opines that the wholesale transfer of wealth to the wealthiest that has been ongoing over the past 30 years is a major reason for the slow recoveries. The top 1 percent spend very little of their record earnings, and wealth taxes have been severely reduced, limiting governments’ ability to spend on public necessities and create more jobs.

The U.S. Federal Reserve is doing the right thing in staying the accommodative path, according to just released FOMC minutes of last month’s meeting. It agreed to keep the wording that interest rates would stay low “for a considerable time” as forward guidance, and sure enough, stocks had a huge rally after the announcement.

As if to echo the IMF report, the Guardian’s Economics Blog also announced that the experiment – German designed, German engineered and German exported – with austerity has failed. “The eurozone is not cutting its way back to prosperity. It is cutting its way towards being the new Japan.”

Harlan Green © 2014

Follow Harlan Green on Twitter: https://twitter.com/HarlanGreen

Wednesday, October 8, 2014

More Jobs Available, Goldman Upgrades RE Forecast

Popular Economics Weekly

Goldman Sachs economist David Mericle in his research report, “Housing: The Recovery Resumes” says that overall, the message from the broad housing data flow is that the housing market is still at the beginning of a new growth cycle. Real residential investment grew at an 8.8 percent rate in Q2 and is tracking at nearly 15 percent in Q3.

“We continue to see substantial upside for the housing sector in the long run,” said Mericle. “This view is driven by the large gap between the current annual run rate of housing starts, which have averaged about 1 million over the last three months, and our housing analysts' projection of a long-run equilibrium demand for new homes of about 1.5-1.6 million per year, estimated as the sum of trend household formation and demolition of existing homes.”

Trend household formation has been down since 2008. Given the current size of the adult population as well as current headship rates by age or race/ethnicity, the Harvard Joint Center for Housing Studies estimates that demographic trends alone will push household growth in 2015-25 somewhere between 11.6 million and 13.2 million, depending on foreign immigration. This pace of growth is in line with annual averages in the 1980s, 1990s, and 2000s, and should therefore support similar levels of housing construction as in those decades.

Part of the reason for Goldman’s optimism is the millennial generation of echo boomers, children of baby boomers, are beginning to leave home in larger numbers after being held back by the severity of the Great Recession and busted housing bubble. And they are the largest generation born from 1980 to 1996, outnumbering even their baby boomer parents.

image

More good news is the jobs picture is getting better. Tuesday’s JOLTS report (Job Openings and Labor Turnover Survey) said Jobs Openings rose to 4.8 million in August, up 23 percent year-over-year. The following Calculated Risk graph shows job openings (yellow line), hires (dark blue), Layoff, Discharges and other (red column), and Quits (light blue column) from the JOLTS report.

image

Graph: Calculated Risk

The number of job openings (yellow) are up 23 percent year-over-year compared to August 2013 and the highest since January 2001. Quits are up 5 percent year-over-year. These are voluntary separations. (see light blue columns at bottom of graph for trend for "quits"), and mean more workers are leaving for better jobs, which means they see better job prospects.

It is a good sign that job openings are over 4 million for the seventh consecutive month - and the highest since January 2001 - and that quits are increasing year-over-year, says Calculated Risk.

So these are good omens for a better housing market. The main problem seems to be supply, and the need for new-home starts that surpass the current 1 million average, thereby boosting new-home sales. But that will depend in large part on those millennials continuing to leave home.

Harlan Green © 2014

Follow Harlan Green on Twitter: https://twitter.com/HarlanGreen

Friday, October 3, 2014

Employment Report Won’t Cause Fed to Raise Rates

Financial FAQs

Unemployment falls below 6% for first time since 2008 as U.S. adds 248,000 jobs said today’s MarketWatch headline at the release of the Labor Department’s September unemployment report. But it won’t be enough to push Janet Yellen’s Federal Reserve to begin to raise interest rates sooner until next year, even though the bond vigilantes will be screaming for higher rates sooner.

image

Graph: Calculated Risk

Why? Because wages aren’t rising at all. The Bureau of Labor Statistics said, "Average hourly earnings for all employees on private nonfarm payrolls, at $24.53, changed little in September (-1 cent). Over the year, average hourly earnings have risen by 2.0 percent. In September, average hourly earnings of private-sector production and nonsupervisory employees were unchanged at $20.67.”

Chairperson Yellen has said that stagnant wages are a sign that there are still too many people out of work. According to the BLS, there are 2.954 million workers who have been unemployed for more than 26 weeks and still want a job. This was down from 2.963 in August. This is trending down, but is still very high.

And the number of persons employed part time for economic reasons (sometimes referred to as involuntary part-time workers) was little changed in September at 7.1 million. These individuals, who would have preferred full-time employment, were working part time because their hours had been cut back or because they were unable to find a full-time job.

image

Graph: Calculated Risk

Calculated Risk does an excellent analysis of the underlying reasons wage growth has been so meager. One reason so many are still out of work is the dropoff in government employment. In September 2014, state and local governments added 14,000 jobs.  State and local government employment is now up 143,000 from the bottom, but still 601,000 below the peak.

“Clearly state and local employment is now increasing,” says Calculated Risk’s Bill Mcbride.  “And Federal government layoffs have slowed (payroll decreased by 2 thousand in September), but Federal employment is still down 25,000 for the year.”

As a comparison to other presidential terms, Calculated Risk compared government hiring during both Republican and Democratic administrations.

image

Graph: Calculated Risk

“The public sector grew during Mr. Carter's term (up 1,304,000),” says Calculated Risk, “during Mr. Reagan's terms (up 1,414,000), during Mr. G.H.W. Bush's term (up 1,127,000), during Mr. Clinton's terms (up 1,934,000), and during Mr. G.W. Bush's terms (up 1,744,000 jobs).”

However the public sector has declined significantly since Mr. Obama took office (down 710,000 jobs). These job losses have mostly been at the state and local level, but more recently at the Federal level.  This has been a significant drag on overall employment, says Calculated Risk.

Much of government unemployment was due to falling revenues from the Great Recession, but much also from the political opposition to more New Deal type government stimulus spending.

In spite of that, the U.S. has done much better than Europe with its austerity policies that have led the EU into a third recession just since 1980. So we seem to have learned something from the Great Downturns that Europeans have yet to learn. Policymakers cannot weaken government programs and policies that create growth and jobs during Great Recessions, or Depressions.

Harlan Green © 2014

Follow Harlan Green on Twitter: https://twitter.com/HarlanGreen
Thursday, October 2, 2014

Employment Up, Interest Rates Falling Again

Popular Economics Weekly

We are still in the Goldilocks economy—it’s not too hot or too cold. In fact, there is enough geopolitical unrest (now it’s the Hong Kong youth protests against China’s hardliners) to drive down interest rates, and boost U.S. growth. We seem to be the island of calm in a world of storms, where investors are looking for safe havens.

The Automatic Data Processing (ADP) report just out showed private sector payroll employment increased by 213,000 jobs from August to September according to the August ADP National Employment Report. This is the precursor to this Friday’s Bureau of Labor Statistics ‘official’ September unemployment report for both private and public employment, which is expected to be in the same range.

Mark Zandi, chief economist of Moody’s Analytics that puts out the report, said, "Job gains remain strong and steady. The pace of job growth has been remarkably similar for the past several years. Especially encouraging most recently is the increasingly broad base nature of those gains. Nearly all industries and companies of all sizes are adding consistently to payrolls.”

And initial jobless claims continue downward, another sign that the unemployment rate should fall further tomorrow. There are fewer and fewer workers drawing unemployment benefits which points solidly at improvement underway in the labor market. Initial claims fell 8,000 in the September 27 week to 287,000, pulling down the 4-week average by a sizable 4,250 to 294,750 which is nearly 10,000 below the month-ago comparison.

image

Graph: Econoday

This is while interest rates are plunging due to investor flight-to-quality from the worldwide unrest. Conforming 30-year fixed rates are back down to 3.625 percent for a 1 pt. origination fee, 3.75 percent for 0 pts. in origination fees.

It may bring more of the record millennial generation of echo boomers (i.e., children of baby boomers) that outnumber their baby boomer parents into the housing market.

Marketwatch’s Amy Hoak, for one, believes this will happen sooner. Reporting on a National Association of Business Economist conference, she said,“In August 2014, only 29 percent of all buyers of existing homes were first-timers, according to National Association of Realtors data. For comparison, between October 2008 and October 2010, an average 41 percent of all buyers of existing homes were first-timers, David Crowe, chief economist for the National Association of Home Builders, pointed out during the panel discussion.

Still, the purchase activity of home buyers younger than 30 who bought with a mortgage (with the intent to live in the home) rose 8 percent, year over year, in 2012, according to a Zelman & Associates analysis. Purchase activity for this group rose 10 percent, year over year, in 2013. And purchase activity rose 19 percent, year over year, in both 2012 and 2013 for those between the ages of 30 and 39.

The key will be an improving rate of household formation for the millennials.

image

Graph: Business Insider

The improving labor market is helping U.S. household formation among young adults, according to Michael Gapen at Barclays. The employment-to-population ratio for 16-24-year-olds has climbed to 47.7 percent in May, from an average of 46.5 percent in 2013.

In particular, data from the Current Population Survey, which includes extensive information on both the number and characteristics of US households over time, suggest that more young adults are now finding it feasible to move out, said Gapen.

While the employment-to-population ratio for those in the 25-34 bracket has also ticked up, they are already less likely to live at home with their parents. "Only 18.8 percent and 8.9 percent of 25-29 year olds and 30-34 year olds, respectively, live with parents," writes Gapen.

In 2013, 55.3 percent of 18-24-year-olds lived at home, compared with 56.2 percent in 2012. Since there were estimated to be 30 million 18-24-year-olds in the U.S. last year, according to Current Population Survey estimates, the one percentage point decline suggests that 300,000 young adults were looking to move out.

Tomorrow’s BLS unemployment report should tell us more, but the youngest adults look like they are ready to be on their own.

Harlan Green © 2014

Follow Harlan Green on Twitter: https://twitter.com/HarlanGreen

Wednesday, October 1, 2014

Pending-Home Sales Decline Slightly

The Mortgage Corner

The Pending Home Sales Index, a forward-looking indicator based on contract signings, fell 1.0 percent to 104.7 in August from 105.8 in July, and is now 2.2 percent below August 2013 (107.1). Despite the slight decline, the index is above 100 – considered an average level of contract activity – for the fourth consecutive month and is at the second-highest level since last August.

Lawrence Yun, NAR chief economist, said contract signings are holding steady and fewer distressed sales and less investor activity is likely behind August’s modest decline. “Fewer distressed homes at bargain prices and the acknowledgement we’re entering a rising interest rate environment likely caused hesitation among investors last month,” he said. “With investors pulling back, the market is shifting more towards traditional and first-time buyers who rely on mortgages to purchase a home.”

And the S&P/Case-Shiller U.S. National Home Price Index, which covers all nine U.S. census divisions, recorded a 5.6 percent annual gain in July 2014. The 10- and 20-City Composites posted year-over-year increases of 6.7 percent.

image

Graph: Calculated Risk

Data through July 2014 show a significant slowdown in price increases. Nineteen of the 20 cities saw lower annual returns in July. Las Vegas, Miami and San Francisco were the only cities to report double-digit annual gains. Cleveland’s rate remained unchanged at +0.9% for the 12 months ending July 2014.

Las Vegas rose 12/8 percent, Miami 11 percent, and San Francisco 10.3 percent. The PHSI in the Northeast slipped 3.0 percent to 86.5 in August, but is still 1.6 percent above a year ago. In the Midwest the index fell 2.1 percent to 102.4 in August, and is 7.6 percent below August 2013.

Pending home sales in the South decreased 1.4 percent to an index of 117.0 in August, unchanged from a year ago. The index in the West rose for the fourth consecutive month (2.6 percent) in August to 102.1, but still remains 2.6 percent below August 2013.

The major reason for less investor demand is the fall in foreclosures and delinquent mortgages, as we said. Fannie Mae reported today that the Single-Family Serious Delinquency rate declined in July to 2.00 percent from 2.05 percent in June. The serious delinquency rate is down from 2.70 percent in July 2013, and this is the lowest level since October 2008.

Freddie Mac also reported that the Single-Family serious delinquency rate declined in July to 2.02 percent from 2.07 percent in June. Freddie's rate is down from 2.70% in July 2013, and is at the lowest level since January 2009. Freddie's serious delinquency rate peaked in February 2010 at 4.20%.

image

Graph: Calculated Risk

“The employment outlook for young adults is brightening and their incomes3 finally appear to be rising,” said Yun. “Jobs and income gains will help repay student debt and better position first-time buyers, setting the stage for improved sales growth in upcoming years.” 

In fact, overall consumer incomes are rising. Personal income growth posted a 0.3 percent gain in August, following a 0.2 percent rise in July. The latest number matched expectations for a 0.3 percent advance. The wages & salaries component was even stronger with a 0.4 percent boost, following a 0.2 percent increase the month before.

image

Graph: Econoday

Personal spending jumped 0.5 percent after no change in July, while there was no increase in the PCE inflation index at all, mainly due to falling gas prices. Strength was in the durables component which jumped 1.8 percent after no change in July. August reflected a jump in auto sales. Nondurable spending declined 0.3 percent after no change in July. Services jumped 0.5 percent in August after being unchanged the month before.

And with interest rates falling again—the 30-yr conforming fixed rate is back to 3.75 percent with 0 origination points—more first-timers in particular can afford to buy homes. We are of course speaking of the 18 to 35-yr olds of the so-called millennial generation who have taken longer to both find jobs and leave their parents’ home.

Harlan Green © 2014

Follow Harlan Green on Twitter: https://twitter.com/HarlanGreen