Showing posts with label CBO. Show all posts

Tuesday, March 9, 2021

Why the American Rescue Plan Is So Important

 Financial FAQs

There are several good reasons for passing the American Rescue Plan (ARP). Firstly, it abolishes once-and-for-all the Reagan-era myth that ‘government is the problem’.

With the thinnest of Democratic majorities, the Biden administration is getting things done; from speeding up of vaccine deliveries, to expanding Obamacare coverage, to requiring masks on interstate and international travel and re-joining the Paris Accord on climate change—all this enabling a speedier economic recovery.

And it benefits so many Americans—more than 60 percent, according to economist Steven Ratner on Morning Joe, in comparing the American Rescue Plan to Trump’s Tax Cuts and Jobs Act that transferred $1.9 trillion in tax cuts to the wealthiest 10 percent of income earners with none of it supporting public spending, whereas the $1.75 trillion in spending from the ARP will benefit programs for more than 60 percent of Americans.

 MorningJoe

This will include the poorest among US, including minorities and immigrants, according to the PEW Research Center’s latest survey:

“About six-in-ten White (60%) and Asian adults (58%) currently say their personal financial situation is in excellent or good shape. In contrast, a majority of Black (66%) and Hispanic (59%) Americans say their finances are in only fair or poor shape.

The Congressional Budget Office has said that it could take five years for employment to reach levels prior to the pandemic without the American Rescue Plan.

The ARP’s main objective is to put people back to work as soon as possible, according to Fed Chairperson Janet Yellen.

““I think we should want a rapid recovery,” she said in a recent PBS Newshour interview. “We have a large number of workers who are long-term unemployed, and we have to make sure they’re not scarred to the point where this pandemic has a permanent impact on their lives.”

And speaking of the latest strong unemployment report that created 379,000 more payroll jobs, “at that pace it would take us more than two years to get to full employment,” Yellen said in the same interview. The “real” unemployment rate, after factoring in 4 million who dropped out of the labor force after losing their jobs, was more like 10 percent.

The PEW report said that income differences are particularly pronounced, with a gap of 60 percentage points between the shares of upper-income (86%) and lower-income (26%) adults who rate their financial situation as excellent or good. “About six-in-ten adults with middle incomes (58%) say their finances are in excellent or good shape.”

The ARP should also boost consumer sentiment now at a six-month low in the U. of Michigan February sentiment survey, with the entire loss concentrated in the Expectation Index and among households with incomes below $75,000 (the income brackets targeted by the government cash payouts), as I said last week.

“Households with incomes in the bottom third reported significant setbacks in their current finances, with fewer of these households mentioning recent income gains than anytime since 2014,” said the U. Michigan survey.

Need we say more? This is why the American Rescue Plan is so popular with a 76 percent approval rating per the latest Politico survey.

Harlan Green © 2021

Follow Harlan Green on Twitter: https://twitter.com/HarlanGreen

Thursday, July 16, 2020

What ‘V’– Shaped Recovery?

Popular Economics Weekly


It’s becoming obvious to me there will be no ‘V’ shaped economic recovery with positive GDP growth resuming in the fall and winter quarters, after the plunges we are seeing in Q1 and projected Q2 growth. The actual Q2 GDP number is not out until the end of July, but economists are saying negative Q2 growth could be somewhere around minus -20 percent.

Why? There are already reversals of business openings as COVID-19 infections soar again in some 35 states. In fact, we won’t really know what GDP growth might be in the fall because the experts don’t know when infection and even death rates will begin to decline again.

That must be why today’s initial jobless claims release shows another 1.3 million jobless claims, same as last week, so new claims for unemployment continue to pour into overwhelmed state employment offices, which means many of the still 15 million unemployed haven’t even begun to receive unemployment insurance more than one month after the $3 trillion CARES Act was passed.

An even better barometer of the jobs market is the continuing claims number, which is 17 million receiving unemployment compensation from the states alone, and with the total of all people receiving benefits through all state and federal programs has hovered near 30 million from the first week of May to late June. These are known as continuing jobless claims. They rose again in the week ended June 20 to 32.9 million.

It is not good news that so many are out of work. The monthly employment report painted a slightly different picture. It showed that the economy regained 7.5 million jobs in May and June, partially recovering some of the more-than 22 million jobs lost during the first two months of the pandemic. A variety of other economic indicators also suggest that more people have gone back to work.

So who really knows what job and economic growth will look like in the fall and winter?

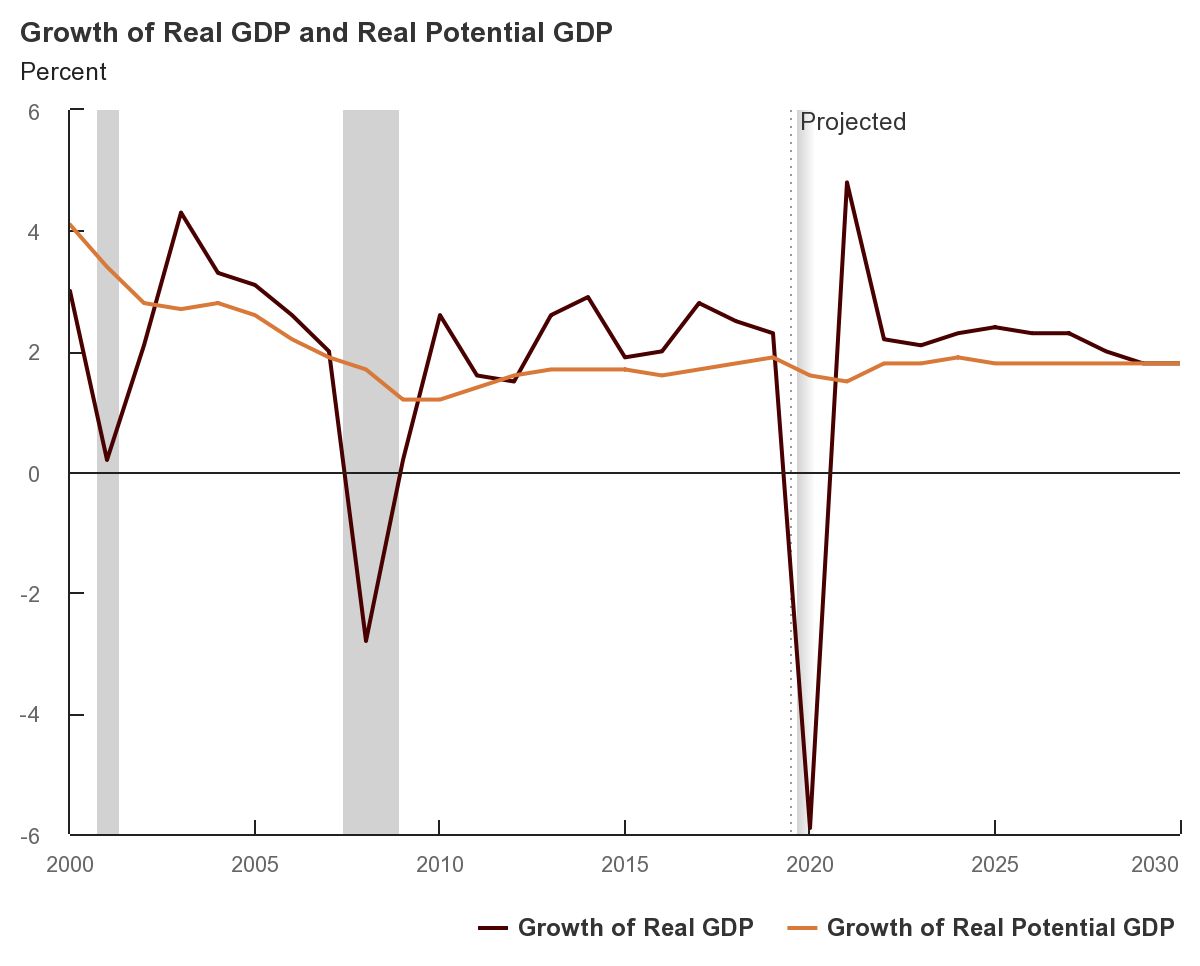
The non-partisan Congressional Budget Office that does projections for congress is also more optimistic in its latest projections. CBO projects that if current laws governing federal taxes and spending generally remain in place, the economy will grow rapidly during the third quarter of this year. So the CBO is saying there could be a ‘V’-shaped recovery!

  • · Real (inflation-adjusted) gross domestic product (GDP) is expected to grow at a 12.4 percent annual rate in the second half of 2020 and to recover to its prepandemic level by the middle of 2022.
  • · The unemployment rate is projected to peak at over 14 percent in the third quarter of this year and then to fall quickly as output increases in the second half of 2020 and throughout 2021.
“Following that initial rapid recovery,” said the CBO, “the economy continues to expand in CBO’s projections, but it does so at a more moderate rate that is similar to the pace of expansion over the past decade.”
They actually mean growth will return to the long-term 2 percent growth rate that has prevailed since the end of the Great Recession, and that won’t happen until at least 2022.
But what about the duration of the pandemic when the US can’t get its united states’ effort together, which the rest of the developed world seems to be doing?

These are not great numbers, unless more ways are found to either boost labor productivity, or US population growth. Our population growth is low because of the declining birth rate and immigration restrictions. Yet neither of them will pick up until this pandemic is really over, and Americans can again come out of their shelters.

Harlan Green © 2020

Follow Harlan Green on Twitter: https://twitter.com/HarlanGreen

Wednesday, July 16, 2014

Don’t Forget the Millennials!

Popular Economics Weekly

In Janet Yellen’s current congressional testimony, the Fed Chair is saying the Fed could keep rates low for a long time to come. Why? Because unemployment is still too high, and economic growth too slow at present.

That’s because the CBO says thanks to the lingering effects of the recession, the aging of the country, the shrinking of the labor force, and various tax and spending policies, the nation now only has the potential to grow about 2.1 percent per year over the next decade, on average.

We believe that is far too pessimistic an outcome. For starters, GDP growth has averaged more than 3 percent over the long term, including the Great Depression. And no one is taking into account the next generation, the Gen Y’ers or Millennials, entering the workforce, which because of their size should kick start growth around 2020, and obviate the worries about soaring budget deficits as the baby boomers retire.

image

Graph: Trading Economics

In the last two decades our growth rate has been steadily decreasing. The 50’s and 60’s average growth rate was above 4 percent, It dropped to around 3 percent in the 70’s and 80’s. In the last ten years, the average rate has been below 2 percent and since the second quarter of 2000 has never reached the 5 percent level.

Yet if government was ever allowed to create jobs again, we could have above average job creation, and so higher GDP growth for decades to come. The New Deal proved that. When New Deal spending kicked in, it boosted growth by literally creating millions of WPA, CCC jobs that resulted in new highways, bridges, dams, and the care of natural resources. Conversely, when government spending was cut back prematurely in 1937 in an attempt to balance the budget, the Great Depression resumed.

image

Graph: Seeking Alpha

Especially spending on public infrastructure stimulates the U.S. economy in the short-run, given that there is some $2.2 trillion in deferred infrastructure maintenance, according to the US Society of Civil Engineers. Investing in infrastructure goes beyond mere improvements to the quality of roads, highways, sewers, and power plants. These investments also generate “significant economic returns for other portions of the U.S. economy and substantially increase ultimate tax revenue for the government,” according to a 2012 College of William & Mary academic study.

And what about demographics, the assertion that since baby boomers are retiring, the work force will shrink rather than grow, further cutting GDP growth? Ah, but we are speaking of the so-called Millennium generation born between 1981 to 1998, which numbers more than 70 million in the US alone. In fact, one commentator maintains, starting around 2020 (or a few years after 2020), the U.S. should see another robust growth period similar to the period enjoyed by the baby boomer generation.  This is because there will be just as many new workers in the work force from the Gen Y or Millennial generation as there were in the baby boomer generation. 

Barron’s Magazine has been looking at the Millennials’ potential. FOR ONE THING, THE MILLENNIALS -- sometimes called Generation Y, and defined by many demographers as ranging from ages 18 to 37 -- make up the largest population cohort the U.S. has ever seen. Eighty-six million strong, it is 7 percent larger than the baby-boom generation, which came of age in the 1970s and '80s. And the Millennial population could keep growing to 88.5 million people by 2020, owing to immigration, says demographer Peter Francese, an analyst at the MetLife Mature Market Institute.

This echo-boom generation totals 27 percent of the U.S. population, less than the 35 percent the boomers represented at their peak in 1980. When the baby-boom generation drove the economy in the 1990s, growth in gross domestic product averaged 3.4 percent a year. As the Millennials hit their stride, they could help lift GDP growth to 3 percent or more, at least a percentage point higher than current levels.

So there’s no real reason to be so pessimistic about economic growth and a soaring federal deficit for decades to come. If GDP growth is dependent on workforce growth, and 1990’s growth repeats itself—which was the longest uninterrupted economic expansion in our history that also gave us 4 years of budget surpluses—then we may see the next generation already taking charge. And they could turn out to be much more industrious than we know!

Harlan Green © 2014

Follow Harlan Green on Twitter: https://twitter.com/HarlanGreen

Monday, May 20, 2013

Consumer Sentiment, Leading Indicators Signal Higher Growth

Popular Economics Weekly

Both the University of Michigan’s Consumer Sentiment survey and Conference Board’s Index of Leading Indicators rose in May, signaling that employment and growth may be stronger than forecast by most economists.

How can that be with 7.5 percent of the workforce looking for work and some 18 million that have either part time, or no work at all? The real answer is the U.S. economy is almost too complex to accurately measure, and economists have their biases when predicting growth. In fact, few understand what is called macroeconomics, which helps to predict how government polices affect growth.

For instance, Haver Analytics surveys monthly a group of leading economists, and found that the latest Blue Chip survey foresaw U.S. economic growth of 1.6 percent in Q1’13 following an anemic 1.4 percent rise during Q4'12, when Q1 GDP growth was actually 2.5 percent.

“There is, however, divergence as to the degree of further improvement,” wrote Haver Analytics in a major understatement. “By the end of 2013, the consensus foresees GDP growing at 2.7 percent rate with the top 10 forecasts at 3.6 percent and the bottom 10 at 1.8 percent. The same divergence holds true for next year's expected growth. The consensus of a 3.0 percent advance in real GDP for Q4 2014 is derived from 3.8 percent at the top end and 2.2 percent at the bottom.”

The Blue Chip Indicators also forecast a 7.5 percent unemployment rate by the end of 2013, when it has already dropped to that level in May. The Congressional Budget Office also forecasts 2 percent growth this year, rising to 3.5 percent in 2014.

clip_image002

Graph: Calculated Risk

Consumer spirits are improving dramatically this month in what very well may be a reflection of improvement in the jobs market. The consumer sentiment index jumped to 83.7 for the mid-month reading vs 76.4 for the final April reading and vs April's mid-month reading of 72.3. The Econoday consensus was looking for 78.0 with the high-end estimate at 82.5. The latest reading is near the recovery high set in November.

Boosted by strength in housing permits, the Conference Board’s index of leading economic indicators (LEI) surged 0.6 percent in April, double the rate of growth expected by the Econoday consensus and at the high-end of the Econoday consensus. The gain points to rising economic momentum six months out.

Also showing strength are financial measures, including credit activity, as well as jobless claims and the stock market. On the negative side are manufacturing measures, which reflect this sector's ongoing bumpy ride, as well as consumer expectations. This latter factor, however, is very likely to turn positive in May judging by this morning's big jump in the consumer sentiment report.

clip_image004

Graph: Haver Analytics

The bottom line is that conditions may be improving enough that consumers are willing to spend again. The household debt-service ratio - an estimate of the share of debt payments to disposable personal income - fell to 10.38 percent in Q4’12, reported the Federal Reserve.

That was the lowest since the series started in 1980. In comparison, the ratio, which takes into account outstanding mortgage and consumer debt, was 10.56 percent in the third quarter. It peaked in the third quarter of 2007, shortly before the U.S. economy fell into recession. This may give consumers, who power 70 percent of economic activity, enough confidence to spend again.

Harlan Green © 2013

Follow Harlan Green on Twitter: www.twitter.com/HarlanGreen

Thursday, November 3, 2011

Dear Supercommittee: “It’s Consumer Spending, Stupid!”

Financial FAQs

“With only about a month remaining before its recommendations are due, lawmakers on the congressional supercommittee charged with finding savings from the federal budget wrestled with cuts to defense, foreign aid and other programs on Wednesday”, said Bloomberg Marketwatch.

But the historical record tells us that finding “savings” in government spending will shrink, not expand economic growth. And so finding savings that aren’t spent elsewhere on stimulus programs won’t in fact reduce the federal deficit, which depends on increased growth. So once again as Paul Krugman has said, “And those who are determined to forget the past run a high risk of reliving it — which is why we’re in the state we’re in.”

At the risk of stealing the title from a New York Times Op-ed by economic historian and Rutger’s Professor James Livingston, “It’s Consumer Spending, Stupid”, we now have historical data verifying that consumers and government spending have driven economic growth over the past century, not corporate profits. This should not be surprising given that consumer spending now makes up 70 percent of economic activity.

Professor Livingston’s apostasy is letting us in on the “best kept secret of the last century: private investment—that is, using business profits to increase productivity and ouput—doesn’t actually drive economic growth. Consumer debt and government spending actually do”.

This is blasphemy to the classical orthodoxy, needless to say, but a truth that the #OccupyWallStreet protests recognize. Livingston says, in fact “…corporate profits are…just restless sums of surplus capital, ready to flood speculative markets at home and abroad. In the 1920s, they inflated the stock market bubble, and then caused the Great Crash. Since the Reagan revolution, these superfluous profits have fed corporate mergers and takeovers, driven the dot-com craze, financed the “shadow banking” system of hedge funds and securitized investment vehicles, fueled monetary meltdowns in every hemisphere and inflated the housing bubble.”

clip_image002

Graph: Congressional Budget Office

This also tells why this recovery has been so frustratingly anemic. It isn’t consumer debt, as much as the lack of income that has prevented consumers from spending enough to boost economic growth. There has been almost no household income growth above inflation since the 1970s, mainly because so much wealth was siphoned off to the wealthiest via tax loopholes and less progressive tax rates, according to the latest CBO study on income inequality.

It should no longer be a surprise to anyone that the share of income going to higher-income households rose, said the CBO study, while the share going to lower-income households fell. But it’s nice that the CBO is also providing more evidence, to whit:

  • The top fifth of the population saw a 10-percentage-point increase in their share of after-tax income.
  • Most of that growth went to the top 1 percent of the population.
  • All other groups saw their shares decline by 2 to 3 percentage points.

How do we know that it isn’t corporations reinvesting their profits that spurs growth? After all, between 1900 and 2000, real gross domestic product per capita (the output of goods and services per person) grew more than 600 percent.

We know because net business investment declined 70 percent as a share of G.D.P. over that century, says Professor Livingston. In 1900 almost all investment came from the private sector — from companies, not from government — whereas in 2000, most investment was either from government spending (out of tax revenues) or “residential investment,” which means consumer spending on housing, rather than business expenditure on plants, equipment and labor.

In other words, over the course of the last century, net business investment atrophied while G.D.P. per capita increased spectacularly. In other words, corporations decided to spend their profits elsewhere. “The architects of the Reagan revolution tried to reverse these trends as a cure for the stagflation of the 1970s, but couldn’t, said Livingston. In fact, private or business investment kept declining in the ’80s and after. Peter G. Peterson, a former commerce secretary, complained that real growth after 1982 — after President Ronald Reagan cut corporate tax rates — coincided with “by far the weakest net investment effort in our postwar history.”

So even cutting corporate taxes, the cry of conservatives today, hasn’t encouraged corporations to invest in future growth. Professor Livingston has done a great service in what may be a first—actually exploding the myth that profits drive growth. It also explodes the myth that corporations have their customers’ best interests at heart. For their customers are consumers in the main, and consumers’ incomes have not even kept up with inflation. The huge jump in labor productivity has not been shared by their employees, in other words.

On the other hand, it is the investor class that profited immensely from the myth that business investment creates jobs. Even though the historical record shows it merely bloated the financial sector from 8 percent to more than 20 percent of GDP over the past decade, which led to excessive speculation. It was excessive investments in new technology, for instance, that caused the dot-com bubble and market crash in 2000. Then came the housing bubble that resulted from overbuilding of housing, fuelled by too easy credit conditions.

“Consumer spending is not only the key to economic recovery in the short term; it’s also necessary for balanced growth in the long term,” says Professor Livingston. “If our goal is to repair our damaged economy, we should bank on consumer culture — and that entails a redistribution of income away from profits toward wages, enabled by tax policy and enforced by government spending. (The increased trade deficit that might result should not deter us, since a large portion of manufactured imports come from American-owned multinational corporations that operate overseas.)”.

We don’t need the traders and the C.E.O.’s and the analysts — the 1 percent — to collect and manage our savings. Instead, we consumers need to save less and spend more in the name of a better future. We don’t need to silence the ant, but we’d better start listening to the grasshopper, says Professor Livingston. 

So when will consumers—you and I, that is—wake up to the fact that the future is ours for the taking? 

Harlan Green © 2011