Showing posts with label employment. Show all posts

Tuesday, September 1, 2026

Not A Merry Christmas?

 Financial FAQs

Personal income increased $115.1 billion (0.4 percent at a monthly rate) in July, according to estimates released today by the U.S. Bureau of Economic Analysis (BEA). Disposable personal income (DPI)—personal income less personal current taxes—increased $125.9 billion (0.5 percent), and personal consumption expenditures (PCE) increased $36.3 billion (0.2 percent).” BEA.gov


BEA.gov

We are fast approaching the shopping season and there are growing worries about consumers ability to soldier on the rest of year with the sudden drop (-0.6%)in July retail sales. They seem to be running out of money. And we know what that means, since consumer spending powers most economic activity

The picture of declining consumer incomes in the BEA’s Personal Consumption Expenditures graph is disheartening, to say the least, and could precipitate a recession sooner rather than later. It’s not only because the job market is shrinking, but our working population as well.

The U.S. economy lost -23,000 payroll jobs this July after gaining just +20,000 jobs in July. It’s the picture of a labor market stuck in neutral; most employers are neither hiring nor firing.

Yet the unemployment rate has been stuck at a fairly low 4.2 percent for months. Why wouldn’t employers hire more workers? Because there’s not as much demand for consumer products, which powers most economic growth. And demand is declining, not only because of the soaring inflation—3.7 percent in the PCE report above—but fewer shoppers.

Population growth in the United States has slowed significantly with an increase of only 1.8 million, or 0.5%, between July 1, 2024, and July 1, 2025, according to the new Vintage 2025 population estimates released today by the U.S. CensusBureau.

And we know why.

“The slowdown in U.S. population growth is largely due to a historic decline in net international migration, which dropped from 2.7 million to 1.3 million in the period from July 2024 through June 2025,” said Christine Hartley, assistant division chief for Estimates and Projections at the Census Bureau.

Low population growth = slow economic growth = fewer jobs, in other words. The decline in “net international migration” is the culprit, to no one’s surprise. Trump is bragging about the tens of thousands of deportations in his single-minded assault on undocumented immigrants; many who have worked long enough in the U.S. to raise children who are citizens now serving in the military.

Those believing that inflation will decline as more companies adopt A.I. software to replace those workers and improve labor productivity will be sadly disappointed. The bond market selloff is the first warning that higher interest rates are here to stay—as long as higher tariffs and ongoing wars raise the risk factors that govern economic activity.

“Government bond yields are hitting multi-decade highs, reflecting anxiety about debt levels, deficits and inflation. The effects will extend to mortgages, business loans and other types of credit,” said the NYTimes at this writing.

Who will buy the products if there are fewer shoppers? That is Silicon Valley’s A.I. miscalculation. Consumers already know this, and their declining personal savings rate to 3 percent (in graph) highlights this fact. They have less to spend, period.

Harlan Green © 2026

Follow Harlan Green on Twitter: https://twitter.com/HarlanGreen

Saturday, August 29, 2026

Not Another Greenspan?

 Popular Economics

“The Consumer Price Index for All Urban Consumers (CPI-U) increased 0.1 percent on a seasonally adjusted basis in July after falling 0.4 percent in June, the U.S. Bureau of Labor Statistics reported today. Over the last 12 months, the all items index increased 3.4 percent before seasonal adjustment.” BLS.gov

FREDcpi

Kevin Warsh, the new Federal Reserve Chairman sounded hawkish in his first speech at the Fed’s annual Jackson Hole conference, as if an interest rate hike was needed soon to fight rising inflation.

"While the PCE and CPI (inflation) readings were better than expected, they do not tell me that underlying trends have meaningfully improved, and we must be confident that underlying inflation is moving to our objective, clearly and at sufficient speed. Otherwise, we have work to do."

But Warsh is a true-red Republican appointed by President Trump and we know that Trump wants to keep interest rates as low as possible to pay for the tariffs and war he has started and will go at any lengths to make it happen, including attempting to fire Fed Governors (Lisa Cook).

Good luck is all I can say. Warsh confronts a scenario that is frighteningly similar to that of Alan Greenspan’s tenure as Fed Chairman in early 2000. President GW Bush needed ultra-low interest rates to pay for his wars on terror after 9/11. But he also passed huge tax cuts that Republicans didn’t want to pay for.

And Greenspan worked to assist him in financing the invasions of Iraq and Afghanistan by convincing his Fed Governors to hold down interest rates for as long as possible—too long it turned out. The Fed Funds rate was held at 1 percent while CPI inflation was ultimately rising to 5.3 percent by 2008, igniting the housing bubble that ultimately burst, thus creating the Great Recession.

Maybe Greenspan was at heart an inflation dove, because the Fed got behind the inflation curve and didn’t raise its Fed Funds rate to 5.25 percent until 2006, which was too late to stop the housing bubble and soaring inflation.

So does Chairman Warsh’s pronouncement that inflation will be tackled, no matter the consequences, to be believed? The Fed Governors have been sounding equally hawkish on the need to fight inflation. And "short-term interest rates are predominant tool to achieve the dual mandate," said Warsh (i.e., stable prices and maximum employment).

Yet U.S. debt is growing faster than the economy, and the job market is barely growing. A.I. won’t be the savior if consumers run out of money because they no longer have a job. The BLS’s latest benchmark revision of payroll jobs estimate implied that non-seasonally adjusted nonfarm payroll gains averaged about 11,000 per month through March over the preceding 12 months instead of 18,000, reports Reuters.

So will Warsh and the Fed be able to withstand the merciless vituperation sure to come from the child-like brain of Donald Trump and maintain the inflation fight when the going gets tough?

We don’t want another bubble to burst with A.I.’s investment bubble growing every larger on top of the tariffs and endless wars.

Harlan Green © 2026

Follow Harlan Green on Twitter: https://twitter.com/HarlanGreen

Thursday, August 6, 2026

Where are the Jobs?

 Financial FAQs

“The number of job openings was little changed at 7.4 million in June, the U.S. Bureau of Labor Statistics reported today. Hires were unchanged at 5.3 million, while total separations changed little at 5.4 million.” BLS

FREDjolts

The job market is shrinking, contributing to the slower economic growth we are seeing this year. For instance, fewer job vacancies are being reported by the Job Openings and Labor Turnover (JOLTS) report, a survey that measures the monthly number of available jobs.

And fewer workers means less will be produced. The JOLTS report also tells us there are more separations–workers leaving the workforce for a variety of reasons than hires.

That’s probably why Q1 2026 GDP growth was just 2.1 percent, and the advance Q2 estimate was 1.5 percent. But there are indications that the AI construction may cause third quarter GDP growth to be higher, as much as 3 per cent with the huge surge in AI spending.

The number of job openings increased in transportation, warehousing, and utilities (+97,000) and in federal government (+39,000). Job openings decreased in wholesale trade (-74,000), nondurable goods manufacturing (-55,000), and mining and logging (-9,000), per the JOLTS report.

The question will be why the reluctance to hire more workers in other sectors? Is it AI? We know that as much as $800 billion is being invested in AI infrastructure and might replace a lot of jobs. So companies may have frozen the number of new hires until they know more about AI’s potential.

What are employers still looking for? The upcoming ‘official’ U.S. unemployment report out in days will also show a shrinking labor force. It’s a huge debate. Firstly, companies have no way yet of measuring what AI may earn on their investments.

“It’s a currency where you have no instinct to know what you are using, and the accounting practices aren’t even there,” said an economist cited by the NYTimes. “The AI stuff is being treated as an investment right now, but it’s a risky investment in case it has no returns.”

It’s not all bad news. The larger, lower paying, service sector economy is still growing. Service companies such as banks, retailers and restaurants expanded last month at an accelerated rate for the sixth month in a row. An index produced by the Institute for Supply Management inched up to 54.1% from 54.0% in the prior month, said MarketWatch’s Jeffry Bartash.

The manufacturing sector is also growing because of the AI buildout. “In July, U.S. manufacturing activity remained in expansion territory, growing at its fastest rate in more than four years,” reports Susan Spence, MBA, Chair of the Institute for Supply Management® (ISM®) Manufacturing Business Survey Committee.

But AI is still muddying the job creation picture. It is the sixth year of this expansion, so AI will determine if this is an ongoing boom, or a bust economy. The record DOW and S&P indexes are predicting boom times ahead, but that’s in part because Wall Street and financial markets are counting on the Mideast wars to be settled, Trump to stop levying illegal tariffs, and there are no prolonged energy shortages.

Will that happen? Or do we need a few more election cycles to determine what laws and regulations will govern this emerging economy?

Harlan Green © 2026

Follow Harlan Green on Twitter: https://twitter.com/HarlanGreen

Wednesday, July 8, 2026

Slower Economic Growth Ahead?

Popular Economics Weekly

Second-Quarter GDP Growth Estimate Increased
“On July 7, the GDPNow model estimate for real GDP growth in the second quarter of 2026 is 1.4 percent, up from 1.2 percent on July 1.”

AtlantaFed

What is happening to U.S. economic growth in 2026? The Atlanta Federal Reserve is one of the few organizations brave enough to attempt to predict future growth in constantly updated forecasts. And the news is not good for most Americans.

The culprit for the volatility in GDP second quarter economic growth predictions by the Atlanta Fed’s GDPNow estimate that had dipped as low as 1.2 percent and is still a mere 1.4 percent (in the above GDP graph), is the large increase in our trade deficit.

And this was the gap that President Trump wanted to shrink with his new tariffs. It has worsened largely because Trump and his advisors don’t know what they are doing; i.e., haven’t taken the time to make the tariffs legal by negotiating with trade partners after doing the required research and then getting congressional approvals, rather than via his illegal executive orders.

The GDPNow model was predicting 3-4 percent Q2 GDP growth until last June as per the graph. But the trade gap has suddenly jumped 42.2% to $77.6 billion, the highest level since March 2025, said the Commerce Department's Bureau of Economic Analysis and Census Bureau.

The most hurt is being done to American workers, since the enlarged trade deficit mirrors the production that had shifted overseas. So many of the components that go into the surging AI build-out are now being imported--especially computers and computer chips—which means an increasing share of the buildout is benefiting foreign workers.

This is a main reason for the alarming drop in June job numbers to a mere 57,000 workers, most of them in healthcare. Some 755,000 workers dropped out of the labor force in June because “jobs are hard to get,” said the Conference Board’s latest consumer Confidence Survey.

What's more, job gains in May and April were revised down to a combined 277,000 from a previous 351,000 - 74,000 fewer than previously reported.

Trump’s Iran War disaster is another reason for the hiring slowdown because higher energy prices from the Middle East is elevating inflation. Wall Street is hoping the A.I. revolution will boost labor productivity to such an extent that it will tame inflation, but without creating many new jobs.

The trade gap jumped 42.2% to $77.6 billion, the highest level since March 2025.

The major culprit; capital goods imports soared $1.1 billion to a record high $128.0 billion that subtract from GDP growth, which calculates just what is produced domestically.

We could be producing more of those imports domestically. But that hasn’t happened so exports dropped 3.2% to $317.7 billion in the latest report.

The shrinking labor force will also shrink GDP growth since fewer workers plus higher inflation means less will be produced domestically because of the higher costs, unless A.I. delivers on its promises of higher productivity. And that will take years, experts have been saying.

All this means fewer Americans will benefit for some time. The International Monetary fund predicts prices won’t come back down until the end of 2027, and only if the Iran war ends.

The official scorecard of the U.S. economy was updated to show the economy grew at a 2.1% annual pace in the first three months of the year, faster than the previously reported 1.6%.

Is that good news? Maybe, but Q1 consumer spending was the weakest in four years.

There will be more robots, Claude, ChatGPT, Open AI, etc., etc. but a shrinking workforce pays less taxes to support public policies, social security, Medicare. And don’t forget the public debt, which is soaring.

Harlan Green © 2026

Follow Harlan Green on Twitter: https://twitter.com/HarlanGreen

Wednesday, March 25, 2026

What, Another Great Recession?

 Financial FAQs

 “The conflict with Iran has already put fresh stress on the U.S. economy, as businesses are reporting rising prices, fewer orders and a decline in employment. A survey of service-oriented companies — the sector that employs most Americans — fell to an 11-month low of 51.1 in March from 51.7 in the prior month, S&P Global said Tuesday.” MarketWatch

FREDpayrolls

Maybe we shouldn’t be looking at the 1970’s era of stagflation for the kind of economic damage from the Iran War and closing of the Strait of Hormuz to oil shipments. There is a short-term spike in oil prices, though oil from other sources than the Gulf can eventually make up the difference in supplies.

The war’s damage may take longer to materialize but look more like the Great Recession, which we shouldn’t forget was a worldwide recession that occurred in 2008-09, the worst since the Great Depression of the 1930s.

We shouldn’t forget that the Great Recession Bush/Cheney and their oil barons ultimately spawned with the ill-planned invasions of Iraq and Afghanistan was based on lies about the weapons of mass destruction that Saddam Hussein didn’t have.

And now Trump and his Robber Barons are taking the Gilded Age dreams of William Mckinley one step further with lies that Iran is preparing nuclear weapons to justify the ill-prepared war with Iran while aliening the allies that would help them succeed.

This is even though Trump’s just-resigned Counterterrorism czar Joe Kent said Iran posed no imminent threat with nuclear weapons.

The Great Recession was caused by more than the Bush wars on terror, of course. It was caused by putting too many regulation-cutting foxes in the Bush/Cheney hen house that literally resulted in the failure of nonbank banks like Bear Stearns and Lehman Brothers to fail.

Trump is following the same playbook by gutting the government’s regulatory agencies that could prevent the blatant fraud occurring with the Trump administration’s Bitcoin investments that have no regulations or backing with assets.

This time negative GDP growth could come from the faltering labor market, which is frozen in place with almost no net new job creation at all in 2015 as highlighted in the above FRED graph. Fed Chair Powell remarked at his latest press conference that they were torn over whether to cut interest rates or raise them because Trump’s immigrant deportations were causing a labor shortage.

Economic growth ground to a halt as well in 2008, even when Fed Chair Greenspan anxiously began to cut interest rates to prevent the near failure of our banking system.

Powell’s Fed Governors also predicted overall GDP growth of 2.4 percent in 2026, even though Q4 2025 Real GDP growth slowed from 1.4 to just 0.7 percent. So I don’t understand the Fed’s optimism over economic growth.

And history has shown that no job growth will ultimately lead to no economic growth,

The frightening truth is that both Republican administrations have made bad decisions for the same wrong reasons.

Harlan Green © 2026

Follow Harlan Green on Twitter: https://twitter.com/HarlanGreen

Friday, February 6, 2026

Why the job Losses?

 Popular Economics Weekly

“The number of job openings continued to trend down to 6.5 million in December, the U.S. Bureau of Labor Statistics reported today. Over the month, both hires and total separations were little changed at 5.3 million each. Within separations, quits (3.2 million) were unchanged while layoffs and discharges (1.8 million) were little changed.” BLS

FRED/JOLTS

The Labor Department’s JOLTS report is another survey showing little or net job growth. That happens when the number of layoffs equals the number of hires (both hires and total separations—losses—were 5.3 million in December).

Alarm bells are ringing because it was the last this low during the worldwide economic COVID-19 pandemic (January 2021).

So now we must wait for the postponed official U.S. Labor Department unemployment report to know if we are slowly sinking into a job recession.

But workers can already see what is happening with their own eyes rather than listen to White House bromides that the economy must eventually get better. The private outplacement firm Challenger, Gray & Christmas said U.S.-based companies announced 108,435 layoffs in January, up sharply from the prior month. It was the biggest tally for the month of January since 2009.

“Generally, we see a high number of job cuts in the first quarter, but this is a high total for January. It means most of these plans were set at the end of 2025, signaling employers are less-than-optimistic about the outlook for 2026,” said Andy Challenger, workplace expert and chief revenue officer for Challenger, Gray & Christmas.”

It is up 205% from the 35,553 job cuts announced in December. January’s total is the highest for the month since 2009, when 241,749 job cuts were announced. It is the highest monthly total since October 2025, when 153,074 cuts were recorded.

There’s another reason companies have stopped hiring more workers than they are losing. They are waiting for the Supreme Court decision on whether the tariffs are legal that are making many of their products more expensive.

Trump’s executive orders are not laws, unless approved by congress. And congress has said they can be enacted if there’s a national emergency. A scarcity of strategic metals is an emergency whose imports can be taxed, but not coffee and every other product that Americans use every day because Trump doesn’t like that particular government.

What are the other culprits preventing job creation? Artificial Intelligence (AI) was cited for 7,624 job cuts in January, 7% of total cuts for the month. Companies referenced AI for 54,836 announced layoff plans in 2025. Since 2023, when this reason was first tracked, AI has been cited in 79,449 job cut announcements, 3% of all layoff plans announced in that period.

“It’s difficult to say how big an impact AI is having on layoffs specifically. We know leaders are talking about AI, many companies want to implement it in operations, and the market appears to be rewarding companies that mention it,” said Challenger.

Tariffs were cited for 294 job cuts in January, after causing 7,908 cuts in 2025.”

That is more sobering news. What will happen to the workers being laid off? Trump has cut back or cancelled many of the infrastructure programs that President Biden enacted in the Infrastructure, Inflation Reduction and CHIPs Acts that would employ these workers in sectors that are intended to modernize our economy.

But no, Trump wants to return to a fossil-fueled economy that is no longer growing (and is in fact losing workers). Republicans don’t seem to have a clue to the horrendous damage he is doing in turning back the clock to a distant era that no longer exists. It was called the Gilded Age and existed in the 1890s.

But the stock market is rallying to record highs with the DOW up 1200 at this writing. Yes, that's all due to the capital spending for new AI infrastructure. But it's creating jobs for robots, not humans.

Back to the 1890s? That can’t be done either, of course, and Americans are already seeing the results.

Harlan Green © 2026

Follow Harlan Green on Twitter: https://twitter.com/HarlanGreen

Friday, March 14, 2025

Do Job Cuts = Recession?

 Popular Economics Weekly

“I don’t see any kind of well-thought-out, comprehensive strategy coming out of the White House,” said Bernard Baumohl, chief global economist at the Economic Outlook Group, a nonpartisan forecasting firm.

What is the White House strategy? Is it based on the campaign promises to bring down inflation on “Day 1”, eliminate waste and fraud, and cut regulations that impede new investments, such as in AI?

The White House to date is attempting to explain why it hasn’t developed a strategy. Treasury Secretary Scott Bessent opined that,

“The market and the economy have just become hooked, and we’ve become addicted to this government spending, and there’s going to be a detox period. There’s going to be a detox,” Bessent, a former hedge-fund manager, said during a CNBC interview.

This description of a “detox” period is alarming, because the term has nothing to do with an economic plan, or anything else, but in fact means the Trump administration is hinting that a recession may be required to wean US off what they deem as too many government services that benefit ordinary Americans rather than the Oligarchs that have jumped onto the Trump/Musk bandwagon.

The wet dream of Republicans and conservatives has historically been to downsize government to little more than military defense. That’s why Trump has targeted USAID and the Department of Education, as well as cuts to social security, Medicare, and Medicaid.

Douglas Holtz-Eakin, a former (Republican) director of the Congressional Budget Office, said it was a fine sentiment for a Treasury secretary to want to reduce government spending but noted that there was no GOP plan in sight to accomplish this goal in any sustainable way, according to MarketWatch.


Part of the problem in downsizing government is that it’s extremely difficult to bring federal government spending below 20 percent of Gross Domestic Product as portrayed in the above FRED historical graph dating from 2010. Spending surged above that level only twice to aid recoveries from the Great Recession and COVID pandemic.

Part of that surge was the Biden administration’s new, New Deal legislation that has already brought 700,000 manufacturing jobs home in the CHIPS, Infrastructure and Inflation Reduction Acts.

These were public/private investments that resulted in the US having the fastest economic recovery from COVID-19 in the developed world.

Trumps says he also wants to bring manufacturing jobs home with the trade tariffs. But his single-minded emphasis on tariffs against friend or foe without negotiating up front will increase inflation, largely because it will be reciprocated, launching a trade war.

And rather than eliminating waste and fraud, the DOGE firings are downsizing or eliminating departments and agencies that make it work—such as the FAA, Energy Department, VA and even social security—which will do exactly the opposite—make us less safe.

“It all seems to be very capricious,” continued Baumohl, “and I think this has been of great concern, not just to U.S. and foreign investors, but certainly to consumers, and we’ve seen that in the abrupt decline in confidence, which is now showing up in in their spending patterns. Once consumers start to cut back, there is nothing that the government can do to make sure that the economy keeps out of recession, because we’re talking about 70% of all economic activity.”

Will such a strategy, or lack of it, work? American consumers are already starting to give the final word. The University of Michigan’s consumer sentiment survey showed consumers becoming even more pessimistic about their future.

“Consumer sentiment slid another 11% this month, with declines seen consistently across all groups by age, education, income, wealth, political affiliations, and geographic regions. Sentiment has now fallen for three consecutive months and is currently down 22% from December 2024.” said Survey Director Joanne Hsu.

It looks like the Trump/Musk administration doesn’t want Americans to know what they are really up to, and it is leading to the wholesale destruction of the U.S. economy.

It will take more than picketing Tesla factories and dealerships for Americans to prevent what is sure to become a recession from happening.

Harlan Green © 2025

Follow Harlan Green on Twitter: https://twitter.com/HarlanGreen

Thursday, October 3, 2024

NO MORE INFLATION

 Financial FAQs

The Fed is no longer worrying about inflation, since its preferred inflation gauge, the Personal Consumption Expenditure Index (PCE), recently dropped to a 2.2% inflation rate, close to the 2.0% target rate.

Fed Chairman Powell said recently the Fed is more worried that the job market is faltering, hence the -.50% Fed Funds rate cut last week with at least two more rate cuts in the offing this year. It would cut the Bank Loan Prime Rate to 7.50% that is the basis for most credit card and installment loan rates.

It is still too high for most borrowers, but auto sales have picked up, which is a sign consumers are still buying, that in means that Q3 GDP growth could also match second quarter’s GDP growth of 3.0 percent.

This is remarkable growth, even with the labor market slowdown, and the unemployment rate up to 4.3 percent in a year.

From the same month one year ago, the PCE price index for August increased 2.2 percent. Prices for goods decreased 0.9 percent and prices for services increased 3.7 percent. Food prices increased 1.1 percent and energy prices decreased 5.0 percent. Excluding food and energy, the PCE price index increased 2.7 percent from one year ago.

Job formation is slowing, as the BLS JOLTS report showed 8 million job vacancies, with 5.3 million Hires and 5.0 million Separations in the month. The 300,000 difference approximates the net number of new hires in August.

We are still fully employed, in other words, but the number of vacancies posted by employers looking for workers has come down considerably from the 12 million job opening high during the pandemic and lockdowns.

(That’s why it’s called the Job Openings and Labor Turnover Survey.)

Consumer spending is the biggest ‘tell’ on future employment and economic growth and it barely dropped to 2.7 percent annual growth from 2.8 percent in August. The savings rate is still a healthy 4.8 percent, close to historical norms, so the surge in vehicle sales is no fluke.

Business activity in the service sector is soaring (mainly dining out, travel, leisure activities), but the manufacturing sector is still contracting.

“In September, the Services PMI® registered 54.9 percent, 3.4 percentage points higher than August’s figure of 51.5 percent. The reading in September marked the seventh time the composite index has been in expansion territory this year,” said survey Director Sterve Miller.

Whereas, manufacturing “Demand remains subdued, as companies showed an unwillingness to invest in capital and inventory due to federal monetary policy — which the U.S. Federal Reserve addressed by the time of this report — and election uncertainty,” said survey director Timothy Fiore.

I see good growth this year. More reductions in interest rates will certainly boost manufacturing, and consumers are still saving, another sign they aren’t tapped out. 

But with one political party wanting to cut back on Bidenomics, the policies spurring much of the growth, economic and job growth next year could depend on which party wins the White House in November.

Harlan Green © 2024

Harlan Green on Twitter: https://twitter.com/HarlanGreen

Wednesday, October 26, 2022

Is Full Employment Still Possible?

 Financial FAQs

Roosevelt Institute

Paul Krugman has forwarded an excellent blog piece by Roosevelt Institute Fellow Justin Bloesch on why we can maintain near-full employment while inflation is returning to the rate that prevailed prior to the pandemic.

Bloesch maintains that full employment and 2 percent inflation rates are possible because there is no longer a higher “natural rate” of unemployment that the Fed must maintain to bring down inflation.

The Fed believes that the best way to bring down inflation is to slow economic growth by inducing lower consumer spending and capital investment by continuing to boost their short-term interest rate target to somewhere between 4.5 to 5 percent.

But the current 3.5-3.6 percent unemployment rate has prevailed since March 2022 even while wage growth and consumer spending have been slowing that are the major ingredients of inflation.

Top that off with supply-side bottlenecks already easing and commodity prices falling, leading us to believe that inflation will return to more historical levels by the spring of 2023.

The probability of such a return to more historical inflation levels of 2-3 percent that prevailed since the 1990s is further increased should the Ukraine War quiet down and China get its post-pandemic COVID problems resolved.

Justin Bloesch’s graph shows that COVID’s shock to the employment system was uniform across all sectors, and the post-pandemic recovery has been uniform across all job sectors as well. This suggests that the COVID pandemic was the main cause of the inflationary surge, and as infection rates continue to decline, more people will want to return to work, keeping unemployment low, and lowering the pressure for employers to raise wages further.

“The better explanation for a temporarily high V/U ratio (i.e., job vacancy to unemployment), and the overall high level of churn in the economy, is just that the economy was rapidly emerging from the pandemic. Many workers did lose their jobs and took jobs in new sectors, and demand for labor was both high and growing rapidly,” said Bloesch. However, as the economy shifts to a slower pace of growth, it is likely that recruiting activity can fall without triggering layoffs.”

This is while the Fed seems to believe that we can’t maintain full employment and a tight labor market without pushing wages even higher, as employers compete for scarce workers.

We have had lower inflation during the last few decades, an era labeled the “great moderation” by economists, because of modern technologies like speeded up just in time supply chains and improved production facilities jn many Asian and third world countries that created an excess of goods and services worldwide.

Harvard Professor Jeffery Frankel, a member of President Clinton’s Council of Economic Advisors, sees commodity prices in particular continuing downward in a recent Project Syndicate article because of the current economic malaise.

“There are two macroeconomic reasons to think that commodity prices in general will fall further. The (slowing) level of economic activity is a self-evidently important determinant of demand for commodities and therefore of their prices. Less obviously, the real interest rate is another key factor. And the current outlook for both global growth and real interest rates suggests a downward path for commodity prices.”

So there doesn’t have to be such a draconian tradeoff between what has been called a “natural rate” of unemployment and inflation. In fact, the relationship between employment and inflation seems to have created a lower “natural rate” than the Fed and many forecasters are using to determine what is the ideal interest rate target the Fed should be shooting for.

This is important and might prevent the large number of layoffs the Fed is expecting because of their current policies, given today’s market conditions in a fast-changing world.

Tomorrow’s release of the government’s first estimate of Q3 GDP growth may give us a hint of what kind of slowdown we are already experiencing.

Harlan Green © 2022

Follow Harlan Green on Twitter: https://twitter.com/HarlanGreen

Monday, June 13, 2022

Higher Inflation Doesn't Mean Stagflation

 Financial FAQs

The current headlines would have us believe the bipartisan $1.9 trillion American Rescue Plan and $1.2 trillion American Infrastructure Investment and Jobs Act approved overwhelmingly by both Democrats and Republicans in 2021 will cause prolonged inflation and perhaps lead to a recession.

What the twin 2021 bills have done instead is create record employment, with full employment achieved 26 months after the COVID recession, vs. the 76 months it took to reach full employment after the Great Recession, which was because congress shortchanged the prior recovery with too little aid.

EPI.org

Former Fed Chair Ben Bernanke said on Fareed Zakaria’s GPS Sunday that he doubts that the current inflation surge might turn into another stagflationary episode. The 1970’s stagflation was caused by 14 years of high inflation, whereas we are suffering from just 6 months of higher inflation, after 40 years with very low inflation since the 1970s.

A recurrence of the stagflation of the 1970s is only possible if rising interest rates engineered by the Fed cause a prolonged slowdown in business activity and consumers spending. The 1970’s inflationary spiral was caused by policies that enabled workers to push up wages every time there was a spike in inflation. 

Workers’ salaries today are barely keeping up with inflation and declining, rather than staying ahead of it, which means that wages, some two-thirds of product costs, won't be part of the inflation equation this time.

The rate of inflation over the past year, based on the more reliable PCE Index, slowed to 6.3 percent in April from a 40-year high of 6.6 percent in March, the first decline in a year and a half.

May’s U.S. CPI surge of 8.6 percent was concentrated in three categories: airfares, used car prices and shelter costs, all in the service industries. Most of the inflation to date is in the goods sector. Surging shelter costs will be the most worrisome trend and that the Fed will watch most closely.

Higher inflation is occurring all over the world from the same factors, which signals that it’s mostly about rising food and energy prices affected by panicky traders worried about food and energy shortages. For example, Russia’s inflation rate is currently18 percent, Turkey’s 70 percent and the EU inflation rate is 8 percent.

The Russian invasion of Ukraine and the sanctions that it triggered account for more than a third of the 40-year high CPI annual inflation of 8.6 percent, according to Mark Zandi, chief economist at Moody’s Analytics, as reported by MarketWatch.

The real question is whether longer term inflation is embedded in consumers’ expectations as happened in the 1970s. But that would mean the so-called ‘supply-shocks’ from COVID, China, and the Ukraine war that are the main cause of the current inflation rate don’t eventually subside.Why wouldn't they?

Harlan Green © 2022

Follow Harlan Green on Twitter: https://twitter.com/HarlanGreen

Wednesday, March 9, 2022

Wartime Should JOLT Job Formation

 Financial FAQs

Calculated Risk

The last time we had truly full employment in America was during World War Two. It’s a horrible thought, I know, but we ought to look at the ramifications of Putin’s invasion of Ukraine.

The world was at war then and all hands were needed in in our factories to win the fight. (Remember Rosie the Riveter?) We may need to do so again if the Ukraine war spreads beyond its borders.

It could mean the huge demand for workers will continue, and push wages even higher.

Today’s JOLTS report showed that businesses continue their massive hiring effort in January and may continue to do so for the rest of this year. The Labor Department is reporting that after falling to as low as 4.6 million early in the pandemic, the number of open jobs soared above 10 million last summer for the first time ever. They have remained extremely high since then.

And though the economy has added an average of 614,00 new jobs in each of the past five months, businesses still say it’s hard to attract new employees and retain old ones.

The number of job openings was little changed at 11.3 million on the last business day of January, the U.S. Bureau of Labor Statistics reported today. Hires and total separations were little changed at 6.5 million (blue line in Calculated Risk’s graph) and 6.1 million (red bars), respectively.”

This gives us an idea of the immensity of the U.S. economy, as well as its future direction..

The yellow line on Calculated Risk’s graph shows how high the demand for jobs has risen. And more are quitting their jobs to find better jobs. Some 4.3 million quit their jobs in the month. Quits peaked at 4.5 million in November. Before the pandemic, the number of people quitting jobs averaged fewer than 3 million a month.

There were 6.3 million Hires (blue line in graph) and 6.1 million Layoffs (red bar), so we should look for more job growth this year, in spite of the touted labor shortages.

But why are so many being hired if that is the case? More are re-entering the work force than was expected.

“Some 300,000 people entered the labor market in February, pushing the increase over the past six months to 2.5 million. Perhaps not coincidentally, economists note, the surge in the labor force began around the time that extra federal benefits for the unemployed expired,” said MarketWatch’s Jeffery Bartash recently.

A wider war is probably not in the cards with NATO saying the Ukraine invasion is not “our” war, but even the threat of war has caused economic activity to pick up, historically.

And with the largest number of immigrants fleeing the war zone since World War Two, who knows what can happen next?

Harlan Green © 2022

Follow Harlan Green on Twitter: https://twitter.com/HarlanGreen

Thursday, February 10, 2022

Inflation is Not So Scary

 Financial FAQs

FREDcpi

It can be no surprise that retail prices have risen 7.5 percent in a year. COVID-19 has scared financial markets and some 3 million workers from returning to their pre-pandemic jobs. The question is what can be done about it?

“The all items index rose 7.5 percent for the 12 months ending January, the largest 12-month increase since the period ending February 1982, said the BLS. The all items less food and energy index rose 6.0 percent, the largest 12-month change since the period ending August 1982. The energy index rose 27.0 percent over the last year, and the food index increased 7.0 percent.”

Part of the confusion is what has made this inflation surge unique. Studies show that it’s mainly worker shortages due to Omicron, countries slow to recover that are part of the disrupted supply chains, and consumers with lots of savings due to the pandemic aid.

The hope is that the Fed can tame some of the inflation by raising interest rates, making borrowing more expensive, which is the conventional tool to cool down activity.

Covid Tracker

But the ultimate inflation cure is if and when the Omicron and any other COVID-19 variant eventually morphs from a pandemic into an endemic virus, like the flu.

In fact, Omicron variant infections are declining faster than expected. As of February 2, 2022, the current 7-day moving average of daily new cases (378,015) decreased -37.6 percent compared with the previous 7-day moving average (605,735), reports the CDC’s Covid Tracker. Omicron infections are sharply down from the more than 800,000 at its peak in January.

At this tempo, it could be back to last October’s rate of approximately 100,000 daily new cases in March, per the CDC graph.

More good news is that the U.S. added 467,000 jobs in January and hiring was much stronger at the end of 2021 than originally reported, The U.S. added 510,000 jobs in December instead of 199,000. And employment rose by 647,000 in November compared to the prior estimate of 249,000.

That’s 709,000 more jobs added to nonfarm payrolls in the past two months, so more workers are returning to work. Leisure and hospitality jobs are increasing, which also means more consumers feel free enough to lead a more normal lifestyle.

There are many parts to the inflation puzzle, but it’s probably safe to say that once the fear of Omicron begins to subside and more economic activity kicks in that will further boost employment—such as from infrastructure spending over the next five years that repairs and upgrades the roads, bridges, energy grids, and water systems, inflation will subside.

That leaves the housing problem with soaring rents as well as housing prices. Approximately one-third of the CPI Index is rising housing costs, a much more difficult problem to solve with the current housing shortage. So perhaps the best cure for lingering inflation should be more $$ invested in housing?

I think we should call the next Build Back Better bill, the Build Back Better Housing bill, if we are really serious about wanting housing to be more affordable.

Harlan Green © 2022

Follow Harlan Green on Twitter: https://twitter.com/HarlanGreen

Wednesday, May 12, 2021

Job Openings Soar

 Financial FAQs

Calculatedriskblog

“The number of job openings reached a series high of 8.1 million (yellow line in graph) on the last business day of March, the U.S. Bureau of Labor Statistics reported today. Hires were little changed at 6.0 million (blue line). Total separations were little changed at 5.3 million (red bar). Within separations, the quits rate was unchanged at 2.4 percent while the layoffs and discharges rate decreased to a series low of 1.0 percent.”

In the arts, entertainment and recreation industry, vacancies increased by 81,000 jobs, said Reuters. Vacancies also increased in manufacturing, trade, transportation, and utilities industries as well as in finance. Job openings rose in the Northeast and Midwest regions. But vacancies dropped in the healthcare and social assistance industry.

There is a red-hot demand for workers after what I call the pandemic recession. So we are essentially at the starting gate of the next growth cycle with first quarter GDP already showing 6.4 percent growth.

So economic indicators will have crazy numbers until we reach herd immunity and everyone—including teachers, day-care workers and government workers—are able to return to work. There are still 2 million fewer women and 1.5 million fewer men in the labor force than pre-pandemic levels.

This Calculated Risk graph shows that companies are holding on to more of their employees with lower separations and quits, while last Friday’s unemployment report actually showed some 1 million new jobs were created, but just 266,000 above the normal seasonal rate of hiring.

The 2 million gap between Hires and Job Openings in the graph means companies are looking for workers. But it will take time for workers to find suitable jobs, and employers perhaps to begin to raise their minimum wages for essential workers in the service sector (that are the lowest paid).

A record number of small businesses said they could not fill open jobs in April, as well, adding to a growing national controversy over whether extra unemployment benefits are keeping scores of people from re-entering the labor force. The extra $300 in jobless benefits was extended to September in Biden’s $1.9 trillion American Recovery Act.

Some 44 percent of small businesses said job openings went unfilled in April, according to the National Federation of Independent Business. The NFIB is the nation’s largest small-business lobbying group.

And we have yet to see the enactment of an American Jobs Plan for massive infrastructure spending that will create even more jobs. Does that mean we have a labor shortage with more then 8 million still out of work who say they are looking for work?

There are supply bottlenecks while companies ramp up production again, and the inflation rate hitting new highs since the Great Recession. Will wages begin to rise as well from their lows of the last 40 years?

The consumer price index soared 0.8 percent to match the biggest monthly increase since 2009, the government said Wednesday. Economists had forecast a smaller rise. The rate of inflation over the past year jumped to 4.2 percent from 2.6 percent in the prior month — the highest level since 2008.

Wages have been held down for most workers by the rising power of corporations and weakening of labor unions since 1980. However, the trend is about to reverse as the demand for workers increases.

Will it cause the Fed to boost their short term interest rates? Fed Chair Powell doesn’t want to, but Treasury Secretary Yellen believes rates will have to rise if higher inflation continues.

Who is right? It is too early to tell. This also means the US economy is in for a wild ride this decade.

Harlan Green © 2021

Follow Harlan Green on Twitter: https://twitter.com/HarlanGreen

Wednesday, October 7, 2020

Do We Want Another Great Recession?

Financial FAQs


 MarketWatch

Federal Reserve Chair Jerome Powell has warned of “tragic’ economic risks if another coronavirus aid package isn’t passed by congress. This is while President Trump has just said that talks over additional aid will be suspended until after the election in order that the Senate has the time left to take up Judge Amy Barrett’s Supreme Court nomination.

“Over time, household insolvencies and business bankruptcies would rise, harming the productive capacity of the economy and holding back wage growth,” Powell said. “By contrast, the risks of overdoing it seem, for now, to be smaller.”

Employment of those in the bottom rung of the wage distribution scale remains 21 percent below its February level, while it was only 4 percent lower for workers who receive higher wages, the Fed chairman said.

It seems that Republicans have painted themselves into a corner if they expect to profit from an economy sure to get worse without another aid package before the election. Why are they writing off their chances on November 3rd with an economy sure to slow again? Your guess is as good as mine.

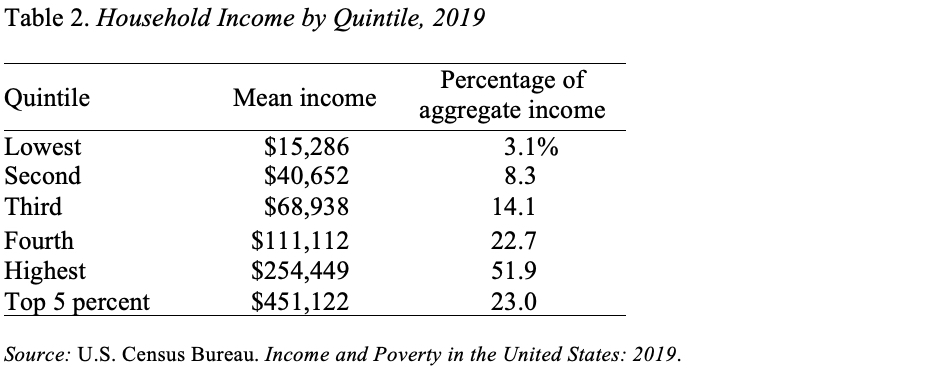
MarketWatch’s chart above highlights the problem. The top 10 percent of household income-earners now corral 51.9 percent of Americans’ aggregate income. That includes stocks as well as real estate and other investments by ‘rentiers’—those living off their assets, rather than the wages and salaries of most workers.

Out middle-income households now garner just 14.1 percent of household income, whereas it was closer to 20 percent in the 1960s and 1970s, before the cutting of taxes and deregulation of whole industries gave corporations the license to maximize their profits, rather than the welfare of their employees.

The predictions of future growth are dire without additional aid to households as well as certain industries his hardest by the pandemic shutdowns.

The NY Times Neil Irwin summarized best what is likely to happen without additional aid. “Business news headlines are reflecting a drumbeat of layoffs normally seen in recessions. In the last few weeks alone, oil giant Shell said it was cutting 9,000 positions, with Disney eliminating 28,000 and defense giant Raytheon 15,000.

“After shedding jobs in the spring, these sectors have brought workers back slowly, or not at all, through the summer. Some have continued cutting positions. Employment at corporate headquarters — “management of companies and enterprises,” in the official terminology — fell by 92,000 in March and April, with another 4,000 jobs lost since.”

He quotes Sophia Koropeckyj, an economist at Moody’s Analytics, who said we do expect there to be a new steady state, but not until 2023 or 2024,” In a new report, she estimates that 5 million people will find it difficult to get new work after the pandemic because their old jobs have disappeared or changed significantly. “I don’t think the severity of this downturn has been well understood yet given the bounce-back over the summer.”

Nobel-winning economist Paul Krugman has been saying what is obvious. Without additional government aid, we could sink into another Great Recession.

“The lesson I take is that our political dysfunction is even worse, our ability to rise to the occasion even lower, than I imagined. It’s hard to look at what’s happening now without feeling a sense of despair.”

Let us see what happens over the next few weeks. Few economists see good times ahead unless the 80 percent of households that earn wages and salaries; many are the essential workers that have a difficult time meeting even their living expenses; are given additional aid.

Harlan Green © 2020

Follow Harlan Green on Twitter: https://twitter.com/HarlanGreen


Monday, June 10, 2019

May employment Not Looking So Good

Popular Economics Weekly


Total nonfarm payroll employment edged up in May (+75,000), and the unemployment rate remained at 3.6 percent, the U.S. Bureau of Labor Statistics reported today. Employment continued to trend up in professional and business services and in health care.

This MarketWatch graph tells it all. Mostly lower-paying businesses in the service-sector; Leisure/Hospitality, Education/Health, and Professional Services gained 76,000 jobs; whereas those in higher-paying construction, manufacturing, wholesale trade, retail and government lost 75,000 jobs.

And since annual wages are barely rising above inflation—now 3.1 percent vs. 3.4 percent in earlier reports—some 5.8 million workers choose either part time work or no work at all, which is basically unchanged for months and means the labor participation rate has probably peaked, prior to the next slowdown (or recession).

The economy has now created an average of 151,000 new jobs in the past three months, down from as high as 238,000 at the start of the year.

So what happened to the consensus for BLS numbers of 180-200k+ payroll growth in May? It certainly looks like the manufacturing industries in particular are losing growth per the ISM manufacturing and non-manufacturing indexes, as I said yesterday. Guess why, with how many trade wars going on, and Midwest farmers now drowning in mud as well as debt? Manufacturers are affected because they have to either import or export most of their parts and products, whereas the service industry is mostly domestic industries (though computer software is exported).

As an example, the factory sector is a listing vessel based on the ISM manufacturing index for May which came in on the low side of estimates at only 52.1. This is the weakest score since October 2016 and shows modest-to-moderate rates of growth for production (51.2), new orders (52.7) and employment (53.7). Backlogs are sharply lower and in contraction, down 6.7 points in May to 47.2 for an unfavorable indication on June employment. But it still shows positive growth.


Whereas today’s ISM non-manufacturing index showed how strong the service sector is, and where most of the lower-paying jobs are created. Employment jumped 4.4 points to 58.1 in the best showing since October last year. New orders are also up 5 tenths to a very strong 58.6 which points to gains for the business activity index (production) in future months. Business activity in May was already very strong, over 60 at 61.2 for a 1.7 point gain.

The real issue will be how to fill the more than 7.5 million vacancies in the earlier JOLTS report. The March Job Openings and Labor Turnover Summary really showed how many more of those lower-paying jobs remain unfilled; and which a rising number of workers are refusing to fill. It’s why wages have risen so slowly for years and inflation has dropped to almost deflationary levels.

It also explains why housing hasn’t taken off during this recovery from the housing bubble. The median income of young adults in the 25–34 year-old age group that are the majority of new homebuyers was up just 5 percent from 1988 to 2016, according to the 2018 report from Harvard’s Joint Center for Housing Studies.

Meanwhile, gross domestic product per capita, a measure of total economic gains, increased some 52 percent from 1988–2017. If incomes had kept pace more broadly with the economy’s growth over the past 30 years, they would have easily matched the rise in housing costs—underscoring how income inequality has helped to fuel today’s housing affordability challenges, as well as economic growth in general.

Harlan Green © 2019

Follow Harlan Green on Twitter: https://twitter.com/HarlanGreen

Tuesday, October 10, 2017

A Poor Employment Report?

Popular Economics Weekly

What does it mean when 33,000 nonfarm payroll jobs were lost in September? Not much, when many of the losses came from the hurricanes that threw 1.5 million out of work, according to Marketwatch’s Jeff Bartash, and the rest of our economy is doing very well.

Wages jumped, also good news, but it was mainly because many of those lost jobs were in retail and restaurants which tend to pay the lowest incomes, hence the upward trend may be temporary.


The number of employed jumped by a huge 906,000 in the smaller household survey that determines the unemployment rate—in spite of the storms—while the number of job losses was smaller; at 331,000, hence the lower unemployment rate. So the rest of the U.S. is doing well.

And we now have a fast growing manufacturing sector that will grow even faster with the cleanup and rebuild from those disasters. Its growth is also helped by the cheaper dollar, which is boosting exports.

Econoday reports ISM's manufacturing index, already running well beyond strength in factory data out of Washington, is accelerating even further, to an index of 60.8 in September which is a 13-year best. Part of the gain in the index is tied to hurricanes and specifically deliveries times where slowing is translated as strength, as we said.

But it's more than that—maybe those higher exports are boosting GDP growth as well? Factory new orders rose 4.3 points in the month to 64.6 which is a 4-year high. And the hurricanes didn't slow down production which is at a very strong 62.2. Employment is a big standout in today's report, posting the first 60 score at 60.3 in 6-1/2 years.


The ‘other’ non-manufacturing service sector part of the economy is also growing robustly. The headline ISM non-manufacturing survey index jumped to 59.8 for the highest score in more than 3 years. New orders, that include strength for exports, jumped nearly 5 points to a robust 61.3 level that was last exceeded in April this year. Backlog orders jumped 2.5 points to 56.0 which helped employment rise 6 tenths to 56.8 with both these readings the strongest since May this year.

So the U.S. economy is firing on all cylinders, which is why the Fed is making louder noises re a December rate hike, in spite of nonexistent inflation. Why do so? Because it wants to gradually sell off its $4.5 billion hoard of government securities, which reverses the various QE programs that injected that much cash to boost growth.

So with less cash in circulation, money is no longer so cheap and market interest rates tend to rise. The Fed wants to be able to anticipate this trend.

But shouldn’t we be seeing more indications of higher growth than just one quarter of 3.1 percent GDP growth? That may happen if more federal funding than a measly $14.6 billion is available for Hurricane Harvey alone, when cleanup may cost $200 billion

Government-is-the-problem Texas Gov. Greg Abbott has changed his tune now that Texas is in need of federal funding. He said he thinks the state will need "far in excess" of $125 billion in federal relief dollars. Houston Rep. Sheila Jackson Lee called for a record-breaking $150 billion aid package on CNN recently.

Really, and who knows what Florida and Puerto Rico’s cleanup will cost? In fact, it will take such large amounts of federal spending to even sustain last quarter’s 3.1 percent growth rate, in my opinion.

Harlan Green © 2017

Follow Harlan Green on Twitter: https://twitter.com/HarlanGreen
Thursday, May 11, 2017

The Declining Treasury Yield Curve—Recession Looming?

Financial FAQs

We are basically at full employment with a 4.4 percent unemployment rate, which should tell us we are nearing the end of this growth cycle.
Econoday reports, “The total number of employed Americans, and this includes both the self-employed and those on payrolls, is 153.2 million and a new record. This total has been rising steadily since falling to a cycle low in December 2009 of 138.0 million. Doing the math here means that 15.2 million jobs have been added during this expansion. The upward slope has been steady and is showing no sign of letting up. The peak in the prior cycle was 146.7 million, hit in November 2007.”


So how do we know we have reached a peak in growth? The National Bureau of Economic Research that tracks growth cycles tells us by using 4 economic indicators: including unemployment, real personal income and real GDP growth (less inflation), and industrial production. Those indicators have already surpassed their last peaks that were reached in 2007, so the question is how much higher can they go before they reach this cycle’s peak.

It is possible the economy may continue to grow with Congress and the White House politically deadlocked and unable to pass any stimulus spending, but that would mean the private sector starts spending more of their $4 trillion plus in unspent profits they have been hoarding, rather than wait for the tax cuts that Republicans have been promising. But don’t bet on that bridge to nowhere, as the saying goes.

On the NBER’s faq page, they define the beginning and end of recessions. “We identify a month when the economy reached a peak of activity and a later month when the economy reached a trough.
The time in between is a recession, a period when economic activity is contracting. The following period is an expansion. As of September 2010, when we decided that a trough had occurred in June 2009, the economy was still weak, with lingering high unemployment, but had expanded considerably from its trough 15 months earlier.”

So June 2009 was identified as the end of the Great Recession (the trough in activity), which began in December 2007 (its prior peak). Calculated Risk’s Bill McBride has followed those NBER recession indicators, and as of April, 2015, they have all exceeded their past highs.

I believe the most important indicator has been personal income, which exceeded its past peak in 2012, but has fluctuated a bit since then.


Employment is also important, but has tended to lag the other indicators in predicting a recession. It didn’t peak until several months into the Great Recession, but is now 2 percent above its last peak.

All four recession indicators are now above their pre-recession peaks. The problem now is we and the NBER Business Cycle Dating Committee aren’t sure that economic activity tops out until months later when the NBER sees a sustained drop in activity, as their 2010 example showed. This past quarter’s meager 0.7 percent GDP growth is still growth, by the way.

So another indicator that might indicate a looming slowdown is the decline in slope of the so-called Treasury Yield Curve, which shows the difference between short term rates regulated by the Federal Reserve, and long term fixed Treasury yields determined by the bond markets—such as the 10 and 30-year Treasuries.

The difference between those 2 yields is basically the profit margin made by lenders that have to borrow at short term rates and lend at the longer term interest rates. It is no longer as steep as it has been, which means lenders become more restrictive, which shrinks available credit, always a sign of slower growth.

So, if the Fed continues to raise short term rates, and because of market uncertainty or low inflation long term rates don't rise from their lows, then it could mean a looming recession.  But that is a big 'if'.

Harlan Green © 2017

Follow Harlan Green on Twitter: https://twitter.com/HarlanGreen

Wednesday, June 22, 2016

Housing Now Leading Economic Recovery

Popular Economics Weekly
Harvard economist and GW Bush chief economic advisor Greg Mankiw’s recent New York Times Upshot column attempts to explain why US growth is so slow. “Here is the sad fact,” he says: “Over the last decade, the growth rate of real G.D.P. per person has averaged just 0.44 percent per year, compared with the historical norm of 2.0 percent. At a rate of 2.0 percent, incomes double every 35 years. At a rate of 0.44 percent, it takes about 160 years to double.”
And Mankiw blames it on policy missteps. E.g., when Barack Obama took office in 2009, the economy was in the midst of the Great Recession, and President Obama’s advisers relied on standard Keynesian theory when they proposed a large increase in government spending to energize the economy.  But it wasn't enough.

Instead of waiting for the stimulus spending to take effect, Obama listened to conservative economists (such as G Mankiw) and supported tax increases too soon in an attempt to pay down the debt accumulated during the Bush administration. The economy hadn’t yet recovered from a very Great Recession. President Roosevelt made the same mistake in 1937 when he also raised tax rates with a Republican Congress, which shrank growth so much that it prolonged the Great Depression.

We do have more signs of improved growth led by housing sales, which may offset some of the policy missteps--due in large part to misjudging the depth of the Great Recession. Sales of previously owned homes increased in May to the highest level in nearly a decade, reports the National Association of Realtors, another sign of durable demand in the housing market despite ongoing headwinds. And a recovering housing market has historically been a leading economic indicator of healthier consumers, hence future growth.


Existing-home sales rose 1.8 percent to a seasonally adjusted annual rate of 5.53 million, the National Association of Realtors said Wednesday. That was 4.5 percent higher compared to a year ago and the highest pace since February 2007 during the housing bubble.
Lawrence Yun, NAR chief economist, says existing sales continue to hum along, rising in May for the third consecutive month. "This spring's sustained period of ultra-low mortgage rates has certainly been a worthy incentive to buy a home, but the primary driver in the increase in sales is more homeowners realizing the equity they've accumulated in recent years and finally deciding to trade-up or downsize," he said. "With first-time buyers still struggling to enter the market, repeat buyers using the proceeds from the sale of their previous home as their down payment are making up the bulk of home purchases right now."
Any recovery depends on boosting aggregate demand—the demand for goods and services from all sectors of the economy, including governments. And to date the Obama administration has been too lax in encouraging both private and public investment that would expand capacity, and so productive jobs.

This is particularly true of government jobs. State and local government employment has been the largest drag on job growth. State and local governments lost 129,000 jobs in 2009, 262,000 in 2010, 247,000 in 2011, and 29,000 in 2012, for a total of 669,000 jobs lost due to the Great Recession. 

Through November 2015, reports Calculated Risk, state and local employment is up a net 70,000.   So, in the aggregate, state and local government layoffs are over.  However state and local government employment is still 561,000 below the pre-recession peak.  It is public sector jobs that have suffered the largest decline due to the Great Recession, in other words. Here is the comparison during presidential terms of government job creation.


The public sector grew during Mr. Carter's term (up 1,304,000), during Mr. Reagan's terms (up 1,414,000), during Mr. G.H.W. Bush's term (up 1,127,000), during Mr. Clinton's terms (up 1,934,000), and during Mr. G.W. Bush's terms (up 1,744,000 jobs).

However public sector declined significantly since Mr. Obama took office (down 638,000 jobs in 2015). These job losses have mostly been at the state and local level, but more recently at the Federal level.  This has been a significant drag on overall employment, needless to say.

How does one boost additional growth with a no-compromise Republican Congress that resists any and all Obama initiatives? (Yet he was able to pass Obamacare, but unable to defend it, resulting in the all-Repub 2014 Congress!).

So public employment is as important as private sector jobs. Not only does this put more people to work, but it provides the necessary energy-transportation-communication networks without which private industry cannot operate.

Harlan Green © 2016

Follow Harlan Green on Twitter: https://twitter.com/HarlanGreen

Friday, March 4, 2016

Job Markets Strengthen


 Americans are going back to work, though mostly in lower paying jobs at the moment.  That’s why those states and cities raising their minimum wage rate are so important for growth. 
 The U.S. added 242,000 new jobs in February, and added 30,000 more jobs to payrolls over the past 2 months, in revisions.  Why does this confute the naysayers that predicted an oncoming recession?  Consumers are buying again, with retail jobs up 54,900, and governments hiring again with all the public works projects starting or about to start.  Hence the 19,000 new construction jobs.


The increase in jobs last month is a sign the economy is picking up steam despite a rocky start to the year for stocks, mostly because of worries that a global slowdown could undermine growth at home. The jobless rate, meanwhile, was unchanged at 4.9 percent.
This is when the EU jobless rate is stuck at 10.3 percent, with Italy’s jobless rate at 11.5 and Spain’s at 20.9 percent respectively.
Even more remarkable was that the labor participation rate continues upward with 500,000 more workers entering the workforce in February and 2 million since.  It really looks like Americans are going back to work; particularly those most discouraged, as more states raise their minimum wage.
Oregon is the latest state jumping on the bandwagon, with its minimum wage rising in increments to $15 per hour over 5 years.  Another sign of strength was that temporary help services fell for a second straight month, down 10,000 following a 22,000 decline in January. Government added 12,000 to payrolls while construction, where spending is solid, rose 19,000, as we said. And this is even though mining and manufacturing jobs contracted, down 19,000 and 16,000 respectively.
The U.S. has created 12.7 million new jobs since 2011 and the unemployment rate has fallen below 5 percent. But workers still aren’t getting big pay raises.  Though almost seven years into the recovery, wages have barely accelerated. Hourly pay fell in February, reducing the year-over-year increase in wages to 2.2 percent from a post-recession high of 2.6 percent two months ago.
And, the so-called U6 rate that includes people who can only find part-time work or have become too discouraged to look for work dipped to 9.7 percent from 9.9 percent and reached the lowest level since May 2008.
We maintain raising the minimum wage of lowest paid workers is important for several reasons.  Firstly, health-care companies and social-assistance providers led the way in hiring, adding 57,000 jobs. Retailers beefed up staff by 55,000, and restaurants took on 40,000 new workers.  This means more employed consumers to boost retail sales, which comprise half of consumer spending, and consumers now power some 70 percent of economic activity.
Raising the minimum wage also takes more lower paid workers off the assistance rolls (such as food stamps), and unemployment insurance, and even welfare, which improves our budget deficit, as well.
It’s becoming a virtuous cycle, in other words, in spite of the drop in energy prices.  It means more money in the pockets of consumers, which in turn creates more jobs, and economic growth.

Harlan Green © 2016

Follow Harlan Green on Twitter: https://twitter.com/HarlanGreen