Showing posts with label JOLTS survey. Show all posts

Wednesday, May 12, 2021

Job Openings Soar

 Financial FAQs

Calculatedriskblog

“The number of job openings reached a series high of 8.1 million (yellow line in graph) on the last business day of March, the U.S. Bureau of Labor Statistics reported today. Hires were little changed at 6.0 million (blue line). Total separations were little changed at 5.3 million (red bar). Within separations, the quits rate was unchanged at 2.4 percent while the layoffs and discharges rate decreased to a series low of 1.0 percent.”

In the arts, entertainment and recreation industry, vacancies increased by 81,000 jobs, said Reuters. Vacancies also increased in manufacturing, trade, transportation, and utilities industries as well as in finance. Job openings rose in the Northeast and Midwest regions. But vacancies dropped in the healthcare and social assistance industry.

There is a red-hot demand for workers after what I call the pandemic recession. So we are essentially at the starting gate of the next growth cycle with first quarter GDP already showing 6.4 percent growth.

So economic indicators will have crazy numbers until we reach herd immunity and everyone—including teachers, day-care workers and government workers—are able to return to work. There are still 2 million fewer women and 1.5 million fewer men in the labor force than pre-pandemic levels.

This Calculated Risk graph shows that companies are holding on to more of their employees with lower separations and quits, while last Friday’s unemployment report actually showed some 1 million new jobs were created, but just 266,000 above the normal seasonal rate of hiring.

The 2 million gap between Hires and Job Openings in the graph means companies are looking for workers. But it will take time for workers to find suitable jobs, and employers perhaps to begin to raise their minimum wages for essential workers in the service sector (that are the lowest paid).

A record number of small businesses said they could not fill open jobs in April, as well, adding to a growing national controversy over whether extra unemployment benefits are keeping scores of people from re-entering the labor force. The extra $300 in jobless benefits was extended to September in Biden’s $1.9 trillion American Recovery Act.

Some 44 percent of small businesses said job openings went unfilled in April, according to the National Federation of Independent Business. The NFIB is the nation’s largest small-business lobbying group.

And we have yet to see the enactment of an American Jobs Plan for massive infrastructure spending that will create even more jobs. Does that mean we have a labor shortage with more then 8 million still out of work who say they are looking for work?

There are supply bottlenecks while companies ramp up production again, and the inflation rate hitting new highs since the Great Recession. Will wages begin to rise as well from their lows of the last 40 years?

The consumer price index soared 0.8 percent to match the biggest monthly increase since 2009, the government said Wednesday. Economists had forecast a smaller rise. The rate of inflation over the past year jumped to 4.2 percent from 2.6 percent in the prior month — the highest level since 2008.

Wages have been held down for most workers by the rising power of corporations and weakening of labor unions since 1980. However, the trend is about to reverse as the demand for workers increases.

Will it cause the Fed to boost their short term interest rates? Fed Chair Powell doesn’t want to, but Treasury Secretary Yellen believes rates will have to rise if higher inflation continues.

Who is right? It is too early to tell. This also means the US economy is in for a wild ride this decade.

Harlan Green © 2021

Follow Harlan Green on Twitter: https://twitter.com/HarlanGreen

Thursday, January 14, 2021

Economy Has Room to Expand

Financial FAQs


Calculated Risk

The latest Job Openings and Labor Turnover Survey (JOLTS) report showed that small businesses are hurting the most during this pandemic with even outdoor dining banned in some regions, such as Southern California, while new hires and job openings were basically unchanged in November.

The number of job openings was little changed at 6.5 million on the last business day of November, the U.S. Bureau of Labor Statistics reported today. Hires were little changed at 6.0 million (deep blue line on graph) while total separations increased to 5.4 million. Within separations, the quits rate (yellow line) was unchanged at 2.2 percent while the layoffs and discharges rate (red bar) increased to 1.4 percent.

It looks like most businesses are holding their breath over future plans until there is more certainty about COVID-19 outcomes. But even more will depend on what kind of legislation a Democratic congress will pass—including a higher minimum wage, expanding Obamacare with a public option, and a national reconstruction program that will begin to upgrade our badly obsolescent infrastructure and create millions of good-paying jobs.

Details include the fact that layoffs increased 295,000 to nearly 2.0 million in November. Hiring rose 67,000 to 5.979 million. The hiring rate was steady at 4.2 percent. A separate report showed a sharp decline in confidence among small businesses in December.  Hires increased in professional and business services (+175,000) and mining and logging (+13,000). Hires decreased in accommodation and food services (-73,000), other services (-67,000), and information (-43,000). The number of hires was little changed in all four regions as we said.


AppleMobility

What is still missing from this picture? Apple mobility tracks the number of Google map requests, with is a proxy for frequency of travel (except for regular commuters). It confirms people are traveling approximately 50 percent less, another so-called high frequency indicator of economic trends, which is why entertainment, leisure and hospitality jobs have declined as indicated in the most recent unemployment report.

Also, the NFIB Small Business Optimism Index declined 5.5 points in December to 95.9, falling below the average Index value since 1973 of 98. Nine of the 10 Index components declined and only one improved. Owners expecting better business conditions over the next six months declined 24 points to a net negative 16 percent, said the press release.

“This month’s drop in small business optimism is historically very large, and most of the decline was due to the outlook of sales and business conditions in 2021,” said NFIB Chief Economist Bill Dunkelberg. “Small businesses are concerned about potential new economic policy in the new administration and the increased spread of COVID-19 that is causing renewed government-mandated business closures across the nation.”

The beige-book report, prepared by the Federal Reserve on information collected by regional Fed banks on or before Jan. 4, showed modestly higher growth in most parts of the country but found that two districts reported no change in activity (St. Louis and Kansas City) while two noted a decline (New York and Philadelphia).

So there is no inherent reason business and consumer confidence might return to pre-pandemic levels once the vaccinations begin to reach the general population. Most economists predict a rebound by the beginning of fall when schools are scheduled to fully open again.  But it also means more national job-creating programs must be enacted by a Democratic administration that wants government to work for all Americans.

 Harlan Green © 2020

Follow Harlan Green on Twitter: https://twitter.com/HarlanGreen 

Thursday, November 12, 2020

Plenty of Available Jobs!

 Financial FAQs


Calculated Risk

There were 6.4 million job openings on the last business day of September, ‘little changed” from prior months, the U.S. Bureau of Labor Statistics reported yesterday. But it is below the 7 million job openings in the months before the pandemic.

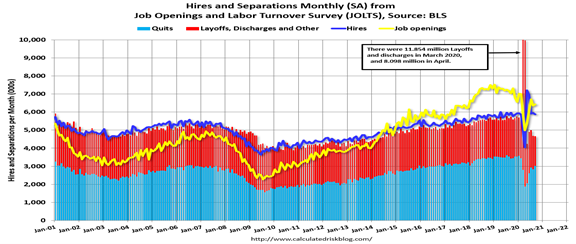
The Calculated Risk graph shows job openings (yellow line), hires (dark blue), Layoff, Discharges and other (red column), and Quits (light blue column) from the JOLTS report that gives us the best jobs picture outside the Labor Department’s monthly unemployment report.

And the number of Americans filing claims for unemployment benefits has remained above its 665,000 peak during the 2007-09 Great Recession. At least 21.5 million people were still receiving unemployment benefits in mid-October.

So the JOLTS report shows the spring back in job openings, but fallback in hires as the year end approaches.

How will the new Biden administration bring back those jobs with COVID-19 numbers surpassing last summer and predicted to rise through at least December?

The good news is that the economy was growing and unemployment at record lows before the pandemic hit. There was no housing boom and bust, or overleveraged financial markets and poor credit controls that caused the Great Recession.

But there is still the record income inequality worsened with this pandemic that will slow down any recovery. Consumer demand would be boosted by raising the national minimum wage, which Biden advocates. President Biden could do this for federal contract workers, but congress would have to approve a raise to it nationally.

We could recover quickly, if we regain a national resolve to work together, as this election seems to have mandated, in other words.

The U.S. has already regained 630,000 jobs in October and the unemployment rate fell sharply again to 6.9 percent, said the Bureau of Labor Statistics, reflecting a surprising show of strength for the economy even as coronavirus cases rose to record highs.

“These improvements in the labor market reflect the continued resumption of economic activity that had been curtailed due to the coronavirus (COVID-19) pandemic, and efforts to contain it,” the BLS said in its press release. “In October, notable job gains occurred in leisure and hospitality, professional and business services, retail trade, and construction. Employment in government declined.”

Covidtrackingproject

President-elect Biden’s creation of a COVID-19 national task force and implementing national mandates for mask wearing, testing, and vaccinations once he is in the White House should help to control its further spread and shorten the recovery time, bringing consumers back to their shopping ways.

The states reported 1.2 million tests and 131k cases, the highest single-day total since the pandemic started on Tuesday, reports the Covid Tracking Project. There are 62k people currently hospitalized with COVID-19. The death toll was 1,347, and now totals 231,659 Americans since the beginning of the pandemic.

So I see sunnier days ahead if we can prevent even worse consequences from the current phase two or three surge in infections and deaths. That means convincing most Americans to follow the science. President-elect Biden will have the bully pulpit to do so.

Harlan Green © 2020

Follow Harlan Green on Twitter: https://twitter.com/HarlanGreen

Tuesday, September 15, 2020

Where are the Jobs?

 Popular Economics Weekly


 Calculated Risk

The number of job openings increased to 6.6 million on the last business day of July, the U.S. Bureau of Labor Statistics reported last week, a good sign. Labor’s JOLTS report will be an important indicator for the last (September) unemployment situation report that comes out just before the November election.

These changes in the labor market reflected an ongoing resumption of economic activity that had been curtailed due to the coronavirus (COVID-19) pandemic and efforts to contain it, said the BLS. This release includes estimates of the number and rate of job openings, hires, and separations for the total nonfarm sector, by industry, and by four geographic regions.

It is showing that certain segments of the economy are doing well, in durable goods such as autos and home sales, because the top 20 percent of white collar income earners that stay employed while working from home, but not the 80 percent of essential workers that really make our economy grow.

For instance, the unemployment rate for companies involved in travel, hotels, dining out and other forms of leisure and hospitality stood at a stunning 21.3 percent last month, whereas the unemployment rate among banks, insurers, Wall Street brokerages and other companies involved in the handling of money was just 4.2 percent in August.

The JOLTS report showed hires had decreased to 5.8 million in July from 7 million (blue line in graph). This tallied with other indicators that fewer workers were being hired in July. Total separations were little changed at 5.0 million. Within separations, the quits rate rose to 2.1 percent, a sign more workers were finding better jobs. But where are they?

Hires increased in federal government (+33,000), largely because of Census hiring. Hires also increased in real estate and rental and leasing (+26,000). But the total number of hires decreased in all four regions.

The job openings were led by the retail sector, with 172,000 new vacancies, reports the Bureau of Labor Statistics (BLS). There were an additional 146,000 jobs in healthcare and social assistance. In the construction industry, job openings increased by 90,000. The job openings rate shot up to 4.5 percent, the highest since October 2019, from 4.2 percent in June.

While schools have opened for the new academic year, many are conducting virtual classes, reports Reuters. Problems securing childcare have forced some workers, mostly women, to resign from their jobs. The labor participation rate for women dropped in April to levels last seen in the late 1980s and has not rebounded much since.

Jobs decreased in a number of industries, with the largest fall in accommodation and food services (-599,000), followed by other services (-143,000), and health care and social assistance (-137,000).

This doesn’t show a very strong job recovery, and there will be many teachers and students opting to stay at home and study online, if they can afford it.

Over the 12 months ending in July, hires totaled 70.2 million and separations totaled 78.5 million, yielding a net employment loss of 8.2 million. These totals include workers who may have been hired and separated more than once during the year.

I don’t believe the picture will change much come November. Those with jobs will spend, but not the majority of wage-earners that will face an uncertain job future without more government aid and a more coordinated effort to control COVID-19 in the coming winter season.

Harlan Green © 2020

Follow Harlan Green on Twitter: https://twitter.com/HarlanGreen

Friday, June 12, 2020

Recession Has Arrived, No Big Surprise!

Financial FAQs

The Dow plunged 1,862 points on Thursday, as the Business Cycle Dating Committee of the National Bureau of Economic Research, which maintains a chronology of the peaks and troughs in economic activity in the United States, had just determined that a peak in monthly US economic activity occurred in February 2020.
The NBER press release said, “…The peak marks the end of the expansion that began in June 2009 and the beginning of a recession. The expansion lasted 128 months, the longest in the history of U.S. business cycles dating back to 1854. The previous record was held by the business expansion that lasted for 120 months from March 1991 to March 2001.”
And Fed Chairman Jerome Powell gave some further bad news. The Federal Reserve on Wednesday slashed its estimate for U.S. gross domestic product this year to -6.5 percent, yes minus 6.5 percent, when many economists were predicting a return to growth by the end of the year. It also raised its median forecast for 2020 unemployment to 9.3 percent.

Powell and the Fed Governors are saying we could have several years of very slow growth. This is exactly what happened from the 1918-20 Spanish flu pandemic, the only real historical comparison. That recession lasted from 1920-22 before growth resumed and became what is known as the “Roaring Twenties”, as I’ve said.


However, just reported initial claims for unemployment was better news as it is continuing to decline per the above graph. It fell to 355K to 1.542 million in the week of June 6 in seasonally adjusted terms, another sign that the work shutdown is ending, which could shorten the recession. 
Reuters ICAP news says “Our guess is that employment will rise again on a net basis in June as more workers are called back from temporary layoffs, but at the same time there continues to be a heavy flow of new job losses as the corporate sector re-evaluates the post-pandemic outlook.” 


And lastly, we have the just released the JOLTS report (Job Openings and Labor Turnover Survey - above graph) that counts the number of hires and layoffs each month confirming that hiring tumbled 1.6 million to a record low 3.5 million in April. Job openings declined 965,000 to 5.0 million on the last business day of April, the lowest since December 2014 when six to seven million job openings had been the norm for the past several years.

How do we make sense of all this news? Firstly, ignore the stock market for now as worthy of any prediction of future prosperity. It’s attempting to parse discounted earnings at least six months from now. And who knows what earnings will be even in one year?

Also, if a vaccine in developed by the end of this year or early next year, as Dr. Fauci keeps hoping, how will it be distributed to most of the earth’s now 8 billion in population? Because no one will be safe until we all are safe, if we want to resume normal economic activity, which has no borders.

So I am maintaining it will be at least two years before consumers or producers return to what would be normal activity.  BTW, what will be the ‘new normal’ everyone is talking about when people can safely gather again in large shopping mall or stadium crowds, for instance? The health care experts are saying mask wearing and social-distancing must be part of it.

 Harlan Green © 2020

Follow Harlan Green on Twitter: https://twitter.com/HarlanGreen
Friday, October 25, 2019

We Need New Jobs Deal


The best picture we have of current and future job trends is the Labor Department’s JOLTS report (i.e., Job Openings and Labor Turnover Survey). Calculated Risk’s colorful graph shows Job Openings (yellow line) hasn’t yet dropped below 7 million openings in August, though it is falling.
This is a given while there were 5.8 million Hires (dark blue line), so there are still 1.2 million job vacancies searching for employees.  It gives a good picture of the huge labor turnover rate in the $20 trillion U.S. economy.
It is also why it is so difficult to predict the next recession, or depression. I maintain we need another New Deal that boosts public spending on health care, education, infrastructure, R&D, and the environment, if we want to continue the longest economic recovery ever.
How low must the number of Job Openings fall—maybe 1-2 million?—for anyone to begin to worry that a lack of available jobs that promotes real productivity might begin to hurt growth?  The yellow line of the Job Openings tally dipped to some 2.4 million op enings in 2009 at the bottom of the Great Recession.
 The red and blue columns show Layoff, Discharges and other, and Quits (light blue column), which are basically flat, which means we are at the top of this business cycle.  The only hint of a downward trend in job formation is the downward curve in the number of Job Openings (yellow line).
We really must look for any downward trend in retail sales, and consumer spending to tell us the direction of economic growth.  Retail sales dropped 0.3 percent last month as households slashed spending on building materials, online purchases and especially automobiles, the first spending decline since February.
What else should we look for?  Nobel prize-winning behavioral economist Robert Shiller believes consumer spending is holding up this longest economic upturn since WWII because of the Trump presidency.  The fact that he touts himself as a successful businessman creates a general sense of optimism about jobs and the economy.
“Trump has for decades touted a glamorous narrative of his life by “surrounding himself with apparently adoring beautiful women, and maintaining the appearance of vast influence,” Shiller said in a recent op-ed in Britain’s the Guardian newspaper. “The end of confidence in Trump’s narrative is likely to be associated with a recession,” Shiller warned.
So such optimism can be a two-edged sword.  While Trump’s affluent lifestyle has been “a resounding inspiration to many consumers and investors … a severe recession may be his undoing,” Shiller warned.
What else could cause such an outcome?  The Great Recession that ended in June 2009 could have been a second Great Depression; but for the Obama administration’s passage of the $850 billion American Reinvestment and Recovery Act emergency aid package that gave states as well as Washington enough dollars to stop the losses.
But, alas, the religiously right wing Tea Party that resisted almost all public spending took over the house in 2010, sharply cutting back further government programs. The focus turned to austerity measures that hurt the Midwest and southern states depending on government largesse to support them, after the loss of all those manufacturing jobs.
The result is the discontent we see today.  We need another New Deal that will invest in our future generations--those roads, bridges, schools; need we say more?--rather than a “glamorous lifestyle”, to sustain this recovery.

Harlan Green © 2019

Follow Harlan Green on Twitter: https://twitter.com/HarlanGreen


Wednesday, September 11, 2019

JOLTS Survey Reports Increase in Hiring

Financial FAQs


This Calculated Risk graph for the Labor Department’s Job Openings and Labor Turnover Survey says (almost) all of it. The yellow line signifying job openings is still soaring far above hires (blue line); so much so that there were still 1.2 million job openings left unfilled in July, the last month surveyed.

Yes, the U.S. economy is so big that there were 5.95 million hires, an increase of 237,000 jobs, and 5.8 million separations that were for a variety of reasons. Many of the separations were voluntary because those employees probably found better jobs.

It’s important to note that the blue columns in the graph show that Quits, or the number of voluntary separations, have been rising since 2010 and are at post-recession highs. Quits are up 3 percent in just the last 12 months.

So we are seeing a very strong job market with that substantial gap between 7.2 million job openings and 5.8 million hires. Hires are still increasing in this 11th year of the recovery from the 2017-19 Great Recession. I.e., there are no signs of weakening job growth that could mean a contraction.


Another jobs indicator showed strength as well. The NFIB Small Business Optimism Index, fell 1.6 points to 103.1, remaining within the top 15 percent of readings, per Calculated Risk, which is important because small businesses create some 80 percent of new jobs.

However, the NFIB reported job creation picked up in August, with an average addition of 0.19 workers per firm compared to 0.12 in July. The problem is finding qualified workers is becoming more and more difficult with a record 27 percent reporting finding qualified workers as their number one problem (up 1 point).
“If the widely discussed slowdown occurs, a significant contributor will be the unavailability of labor–hard to call that a “recession” when job openings still exceed job searchers,” said the NFIB.
A further caveat to continued job growth was the Challenger, Gray & Christmas staffing report, which said U.S.-based employers ramped up the pace of downsizing in August, as companies announced plans to cut 53,480 jobs from their payrolls. This is up 37.7 percent from July’s total of 38,845, according to the latest report on job cuts released Thursday.
“Employers are beginning to feel the effects of the trade war and imposed tariffs by the U.S. and China. In fact, trade difficulties were cited as the reason for over 10,000 job cuts in August," said Andrew Challenger, Vice President of Challenger, Gray & Christmas, Inc.
July was a good month for job formation, in other words, as well as the August unemployment report that showed 130,000 new payroll jobs. However, optimism is slipping among the small business owners that are saying they don’t expect better business conditions and real sales volumes in the coming months.

Harlan Green © 2019

Follow Harlan Green on Twitter: https://twitter.com/HarlanGreen

Wednesday, May 8, 2019

Where Are the Workers?

Popular Economics Weekly

The number of job openings rose to 7.5 million on the last business day of March, the U.S. Bureau of Labor Statistics reported today. Over the month, hires and separations were little changed at 5.7 million and 5.4 million, respectively.

But the miniscule change in hires and separations doesn’t tell us the real employment story. This Calculated Risk graph shows the huge separation between the yellow line (Job openings) and blue line (Hires). It’s now almost 2 million.


The actual difference was because job openings surged 4.8 percent in the month to 7.488 million at the same time that hires fell 0.6 percent to 5.660 million, according to Econoday. “The gap between the two stands at a new record of 1.828 million, signifying a huge demand for workers that isn’t being met.”

Year-on-year, openings are up 8.6 percent vs. only a 0.6 percent rise for hires. The gap between total openings in March relative to the 6.211 million unemployed actively looking for a job in the month was 1.277 million.

This tells us how complex is the hiring process, since it’s becoming ever more difficult to match those looking for work with the advertised job openings. How can we fix the problem from the mismatch?

One hint is we know from last week’s unemployment report almost 500,000 fewer workers were available for work in the Household Survey, shrinking the labor pool, even though job hirings were up in the seasonally adjusted Establishment Survey that reports actual payroll numbers.

I believe those either leaving the workforce, or still looking for work, are waiting for better job prospects. Most do not want Amazon warehouse or Walmart jobs that pay barely above minimum wages.

The largest hires in the April unemployment report were all in the services sector. Professional services, education and health services led, with Leisure/Hospitality and construction hiring next—all in the lower-paying service sector.

Only 4,000 manufacturing jobs were created, according to the BLS, with the utilities and mining sector losing jobs.

Both the Institute of Supply Management’s (ISM) manufacturing and service sector activity surveys also declined in March, with manufacturing activity the weakest in 2 years. It was mainly due to the decline in new orders, possibly due to the trade uncertainty.

The 3.2 percent increase in the initial Q1 GDP growth estimate was a pleasant surprise, as I said last week, but it was largely because spending by local governments picked up due to the partial federal government shutdown and a “turnaround in investment, most notably in construction of highways and streets,” said the BEA. 

Local and state governments may have been waiting to see if the Trump administration would chip in to boost needed infrastructure upgrades, and since that didn’t happen states decided to implement the needed projects.

The buildup in unsold inventories, and fewer imports also increased GDP numbers. That’s because import prices are rising as the recent tariff increases are being passed on to the consumer, contrary to what administration officials are saying.

And rising prices will put a cap on growth, as well as future hiring. So we are waiting to see if more are willing to work, or are still waiting for the right job so they can afford to pay for those higher prices.

Harlan Green © 2019

Follow Harlan Green on Twitter: https://twitter.com/HarlanGreen

Friday, May 3, 2019

A Huge Employment Report

Popular Economics Weekly 


 The U.S. Bureau of Labor Statistics (BLS) reported today that total nonfarm payroll employment increased by 263,000 in April, and the unemployment rate declined to 3.6 percent. It was the lowest unemployment rate in 49 years—since December 1969.

A major reason for the rate drop was almost 500,000 fewer workers were available for work in the Household Survey, shrinking the labor pool, even though job hirings were up in the seasonally adjusted Establishment Survey that reports actual payroll numbers. Notable job gains occurred in professional and business services, construction, health care, and social assistance.

The fact that nonfarm payroll employment increased by 263,000 in April, compared with an average monthly gain of 213,000 over the prior 12 months showed that Fed Chairman Powell and his Board of Governors were correct in not signaling a rate drop anytime soon; maybe not for the rest of the year.

The BLS reported professional and business services added 76,000 jobs in April, with gains in administrative and support services (+53,000) and in computer systems design and related services (+14,000). Over the past 12 months, professional and business services has added 535,000 jobs, a sign that IT services continued to grow.

And construction, hence the real estate industry also showed strong growth, with construction employment up by 33,000, including gains in nonresidential specialty trade contractors (+22,000) and in heavy and civil engineering construction (+10,000). Construction has added 256,000 jobs over the past 12 months.

The construction jobs surge highlights the 3.9 percent increase in spending of state and local governments on infrastructure—such as roads and bridges—in the initial estimate of Q1 GDP growth.

Employment in health care grew by 27,000 in April and 404,000 over the past 12 months. In April, job growth occurred in ambulatory health care services (+17,000), hospitals (+8,000), and community care facilities for the elderly (+7,000).

This means the just reported 3.2 percent jump in Q1 GDP growth was no fluke, though manufacturers added a mere 4,000 jobs after no increase in March. Factory hiring has been very weak this year as companies struggle with stagnant exports and the effects of U.S. trade tensions with China.

Government jobs rose by 27,000, a good thing, as government activity has an important part in maintaining public services. The federal government is already starting to hire workers for the 2020 Census, said the Census Bureau.  Retailers, on the other hand, cut 12,000 jobs as traditional brands continue to lose ground to internet rivals.

But although the economy is still pumping out plenty of new jobs, the rate of hiring has slowed. The U.S. added an average of 169,000 jobs in the past three months, down from a three-year high of 232,000 in January, But that may be a fluke due to the December government shutdown.

So full economic speed ahead, if no more shutdowns! There are still more than 1 million job openings, according to the Labor Department’s JOLTS report, and the U.S. is the world’s largest economy because it actually churns out more than 5 million new jobs per month.

This also gives the Trump administration more incentive to settle its various trade battles, if it wants to have any wins in next year’s Presidential election.

Harlan Green © 2019

Follow Harlan Green on Twitter: https://twitter.com/HarlanGreen

Sunday, March 17, 2019

Why Even More Job Openings?

Financial FAQs


The consensus from the Labor Department’s latest JOLTS report is job openings (graph yellow line) keep rising and employers are scrambling to fill them. January’s number of job openings rose 1.4 percent to 7.581 million that also showed a sharp upward revision to December which is now at 7.479 million vs an initial 7.335 million.

The hires data (blue line) in the JOLTS report also rose 1.5 percent or nearly 100,000 to 5.801 million. And the spread with openings continues to widen to a new record of 1.780 million, which means 1.780 million jobs have yet to be filled, according to the survey.

Year-on-year, openings are up 21.7 percent which dwarfs the 4.2 percent rise in hires, says Calculated Risk. One indication of inflationary risk that Federal Reserve policy makers watch closely is the quits data in this report, rising nearly 100,000 in January to 3.490 million. It is workers seeking higher pay moving from one employer to another, which is usually a sign better jobs are available. 

Why is retail CPI inflation today just 2 percent, when it should normally be rising closer to the 3 percent average that prevailed through most of 2017, as I said in my last blog?

The University of Michigan sentiment survey gives some answers. The consumer sentiment index rose to 97.8 for the preliminary March reading which is above the consensus range. The expectations component, which sank sharply during the government shutdown in January, rose nearly 5 points to 89.2 for its best result since October. And current conditions look even better, up nearly 3 points at 111.2, their best level since before the December shutdown.

But inflation expectations, which the Federal Reserve watches very closely in this report, are still low. The year-ahead U of Michigan expectations reading is surprising because down 2 tenths to 2.4 percent though offset by a 2 tenths gain in the 5-year outlook to 2.5 percent.

This tells us consumers aren’t seeing many rising prices, and so continue to shop for discounts. Inflation expectations tend to be self-reinforcing, according to some recent research. It’s only when consumers see sharp price hikes that they begin to spend more, boosting prices further, as happened during the 1970s wage-price spiral that kicked inflation rates into double digits.

Yet inflation has been tame since the 1990s, and will probably continue as such, even with rising wages. The JOLTS report really tells us there just aren’t enough workers willing to work, qualified or unqualified. It’s a great place for working adults to be in.


It also means there are many working-age adults sitting out the recovery that left the workforce during the Great Recession and see no reason to return until earnings return to pre-recession levels. Workers’ average hourly earnings are at a nine-year high, but the recovery is in its tenth year, so the incomes of many hourly workers have yet to catch up to present living conditions.

Harlan Green © 2019

Follow Harlan Green on Twitter: https://twitter.com/HarlanGreen

Friday, March 8, 2019

Why Smallest Jobs Increase in 17 months?

Popular Economics Weekly


Is US economy running out of available workers? Just 20,000 nonfarm payroll jobs were created in February, per the Labor Department’s Bureau of Labor Statistics, the lowest total in 17 months. But it may have been because there aren’t enough workers that want to work. That has to be part of the reason for the sharp drop from January’s 311,000 new payroll jobs—that was also revised up from 304,000 jobs!
“The unemployment rate declined by 0.2 percentage point to 3.8 percent in February, said the BLS, and the number of unemployed persons decreased by 300,000 to 6.2 million. Among the unemployed, the number of job losers and persons who completed temporary jobs (including people on temporary layoff) declined by 225,000. This decline reflects, in part, the return of federal workers who were furloughed in January due to the partial government shutdown.”
Note that workers returning from the “partial government shutdown” accounted for some of the 300,000 decrease in unemployment, but that was in the Household Survey, a telephone survey of a smaller number of respondents that includes the self-employed.

The larger and generally more accurate Establishment survey of actual business payrolls showed a much larger decrease of 31,000 fewer construction workers (vs. 53,000 hired in January), with smaller drops in retail and government employment as well. So the two surveys don’t usually match.

That rate fell because of a sharp rise in the number of those employed (up 255,000) and a sharp fall in the number of unemployed, as I said, which makes for an unexpected 2 tenths dip in the unemployment rate to 3.8 percent.

The bottom line is there aren’t enough willing workers for hire. The number of job openings reached a series high of 7.3 million on the last business day of December due to the looming scarcity of hires. This means businesses must find more creative ways to hire and hold their employees—such as continue to raise salaries.

Wages in today's report are another indication of the labor shortage, jumping 0.4 percent in the month which is outside expectations for a year-on-year rate of 3.4 percent that is at the high end of expectations.

It should also mean more job creation this year, since many of those 6 million still out of work are simply waiting for wages to return to pre-recession levels, according to various sources. This is measured by the voluntary ‘Quits’ component of the Job Openings and Labor Survey that has been rising. Many of those having to work during and after the Great Recession had to take steep reductions in pay.


So getting back to an equivalent breakeven for those workers holding out means taking into account the pay losses from the downturn even with a fully employed economy.  The gap between openings and hires is now 1.428 million, a new record and up from 1.304 million in November. It’s a very good number for growth prospects in 2019, as employers don’t look for this many
new employees while continuing to raise wages, unless they see a better future. 

Harlan Green © 2019

Follow Harlan Green on Twitter: https://twitter.com/HarlanGreen

Thursday, February 14, 2019

More Job Creation Ahead

Popular Economics Weekly


The number of job openings reached a series high of 7.3 million on the last business day of December, the U.S. Bureau of Labor Statistics reported yesterday. Over the month, hires and separations were little changed at 5.9 million and 5.5 million, respectively.

This means more job creation this year, even with January’s 304,000 new payroll jobs in the BLS unemployment report.  The gap between openings and hires is now 1.428 million, a new record and up from 1.304 million in November. It’s a very good number for growth prospects in 2019, as employers don’t look for this many new employees, unless they see a sunny future.

And the gap is likewise high between openings and those who were actively looking for work, at 1.041 million and next only in the record book to November's 1.098 million.

Year-on-year comparisons further underscore the yawing gap with openings up 29.4 percent vs only a 7.1 percent gain for hires. Given how difficult it is for employees to fill openings, the number of layoffs & discharges in the month fell 3.2 percent to 1.697 million.

And the number of employees who quit rose 1.0 percent to 3.482 million in what hints at worker mobility and the pull from higher paying rivals. This is the reason workers’ pay is also rising faster—with real, after tax wages up 2 percent.

There was a slide in business optimism that is temporary, in my opinion, since the NFIB Small Business Optimism Index slipped 3.2 points in January; as owners continued hiring and investing, but expressed rising concern about future economic growth. The 101.2 reading, the lowest since the weeks leading up to the 2016 elections, however remains well above the historical average of 98, but indicates uncertainty among small business owners due to the 35-day government shutdown and financial market instability. The NFIB Uncertainty Index rose seven points to 86, the fifth highest reading in the survey’s 45-year history.

“Business operations are still very strong, but small business owners’ expectations about the future are shaky,” said NFIB President and CEO Juanita D. Duggan. “One thing small businesses make clear to us is their dislike for uncertainty, and while they are continuing to create jobs and increase compensation at a frenetic pace, the political climate is affecting how they view the future.”
Another ‘blip’ that could be temporary was the fall in December retail sales, down 1.2 percent. But that may also be due to the December ‘uncertainties’—a lousy stock market, lousy weather, and the record government shutdown. Republicans got the message, which is why the “no wall” budget compromise just voted on will pass White House muster this time with no government shutdown.


Another reason for optimism this year is less than 2 percent inflation in both the wholesale and retail sectors should keep consumers buying. Wholesale producer prices in the Producer Price Index were pulled down by a 3.8 percent drop in energy that follows 4.3 and 5.1 percent monthly declines in December in November, the latter the month when oil collapsed from $70 to $50.

And happy consumers amid lots of available jobs means they also see a sunny economic future and will act accordingly.

Harlan Green © 2019


Follow Harlan Green on Twitter: https://twitter.com/HarlanGreen

Wednesday, January 9, 2019

America’s Immigration Problem

Popular Economics Weekly


The Calculated Risk graph says it best in the Labor Department’s latest Job Openings and Labor Turnover Survey (JOLTS). There are still about one million more job openings (yellow line) than hires (deep blue line). There have been more openings than hires since January 2015, according to Calculated Risk.

This tells us several things about the U.S. economy. Firstly, America has a skilled labor shortage because technological innovation exceeds the existing labor force—in fact throughout its history.

America is still a young country in many ways, and our birthrate is declining. This is in contrast to older developed and developing countries in Europe and Asia that have had existing labor surpluses before the various technological revolutions.

Secondly, it is why we so badly need new immigrants to fill those vacancies. Therefore restricting immigration is counter-productive in so many ways. It restricts the growth of our labor force, which directly affects economic growth, and denies America’s history as the land of opportunity. America was founded by immigrants, and it is immigrants that contribute new ideas as well as new blood to our creative mix.

Lastly, the huge gap between job hires and openings tells us there shouldn’t be a fear of recession, or even a significant slowdown, for maybe years to come. Why? Job openings continue to far exceed the six million looking for work, according to the (BLS).

The number of job openings fell to 6.9 million on the last business day of November, the U.S. Bureau of Labor Statistics (BLS) reported today. Over the month, hires edged down to 5.7 million, quits edged down to 3.4 million, and total separations were little changed at 5.5 million. Within separations, the quits rate and the layoffs and discharges rate were unchanged at 2.3 percent and 1.2 percent, respectively. This release includes estimates of the number and rate of job openings, hires, and separations for the nonfarm sector by industry and by four geographic regions.

The BLS said large numbers of hires and separations occur every month throughout the business cycle. When the number of hires exceeds the number of separations, employment rises, even if the hires level is steady or declining. Conversely, when the number of hires is less than the number of separations, employment declines, even if the hires level is steady or rising.

And over the 12 months ending in November, hires totaled 68.0 million and separations totaled 65.6 million, yielding a net annual employment gain of 2.4 million. (These totals include workers who may have been hired and separated more than once during the year.)

So U.S. economic growth should continue to perk along, even if it slows to the historical rate of 2 percent that has prevailed since the end of the Great Recession. It may never climb above that rate without more workers joining the workforce, and there is more public sector investment. We know what those investments should be—infrastructure modernization, improving educational opportunities, combating global warming, etc.—that would give a big boost to labor productivity as well.

The ideal would be to spend more in public investments, but if congress can’t agree on more spending, either American households increase their number of offspring (which is highly unlikely) and/or we reverse the current administration’s anti-immigration policies.

Harlan Green © 2019

Follow Harlan Green on Twitter: https://twitter.com/HarlanGreen

Friday, November 2, 2018

U.S. Wages At 9-Year High

Popular Economics Weekly


Total nonfarm payroll employment rose by 250,000 in October, and the unemployment rate was unchanged at 3.7 percent, the U.S. Bureau of Labor Statistics reported today. Job gains occurred in health care, in manufacturing, in construction, and in transportation and warehousing—in basically all sectors of the U.S. economy.
“The rapidly growing economy generated a sizzling 250,000 new jobs in October, keeping the unemployment rate at a 48-year low and pushing the increase in worker pay to the highest level in more than nine years,” said MarketWatch’s Jeffery Bartash.
The large increase in worker pay highlighted the unemployment report, as did government reports such as the BLS Job Openings and Labor Turnover Survey (JOLTS) that showed more than 7 million job openings, and a high Quits rate of voluntary separations that usually means workers are finding better jobs.
“The number of job openings reached a series high of 7.1 million on the last business day of August, the U.S. Bureau of Labor Statistics reported in October. Over the month, hires and separations were little changed at 5.8 million and 5.7 million, respectively. Within separations, the quits rate was unchanged at 2.4 percent and the layoffs and discharges rate was little changed at 1.2 percent.”
The 5.8 million hires really highlights the incredible jobs turnover rate each month in the $20.7 trillion U.S. economy. A major component of the unemployment report was the 32,000 new manufacturing jobs created in October that was highlighted in the BEA’s report on new factory orders.

“Up a higher-than-expected 0.7 percent, factory orders in October added to September's very strong gain which is now revised 3 tenths higher to 2.6 percent,” said Econoday. “October's increase for durable goods, also at 0.7 percent, is revised 1 tenth lower from last week's advance report with orders for non-durable goods, which are the fresh data in today's report, up 0.6 percent reflecting gains for petroleum and chemical products.”
Why the lowest unemployment rate in many years? A major reason is the percentage of able-bodied Americans in the labor force from the ages 25 to 54 rose to 82.3 percent in October from 81.8 percent in the prior month. That marks the highest level since April 2010.

How about interest rates? The 10-year Treasury Bond yield rose to 3.15 percent once again, and the Fed is sure to raise their Fed Funds rate another one-quarter percent in December to 2.25 to 2.50 percent, which means the Prime rate will go to 5.50 percent. That hasn’t dented consumer spending yet, but it might in the New Year.

What with the election uncertainty, trade wars, jittery financial markets, and an administration fearful of its own survival, we don’t see how 2019 can be as good.

Harlan Green © 2018

Follow Harlan Green on Twitter: https://twitter.com/HarlanGreen

Friday, August 10, 2018

Why Aren't Wages Growing Faster?

Popular Economics Weekly

Graph: FRED

Interest rates are far too low for this late in the recovery from the Great Recession. We know this because the Treasury Yield Curve has been falling that measures the difference between the 10-year and 2-year Treasury bond yields. The difference is just 1 percent, when it has been around 2 percent during other prosperous times, as the FRED graph shows. It last was this low just before the last 2 recessions (gray columns in graph).

Why are interest rates still low? The simplest answer is there isn’t sufficient demand for what is being produced that would cause more borrowing, thus causing interest rates to rise. And though the Republican tax cuts have juiced profits of corporations and their stock holders, it hasn’t boosted the wages of ordinary consumers that power two-thirds of economic activity.

Consumers’ personal incomes are rising at the inflation rate on average, which means they don’t have sufficient income or savings that would cause them to increase their spending habits. It’s a difficult and maybe counter-intuitive concept. If prices are rising as fast as incomes, then consumers are also playing catchup in what they need to maintain their standard of living.

That is why economists worry that such low long term interest rates in particular could be a sign of another incipient recession. Banks cannot lend as much when their profit on loans is the difference between their cost of money and what they can lend at longer-term loan rates (such as mortgages and installment loans). So it means a shrinkage in the available credit.

The good news is that job openings are still soaring in the Labor Department’s JOLTS Report, which should boost wages. It is a survey of available jobs, vs. how many jobs have been created in June.
There were 6.662 million in June vs. an upwardly revised 6.659 million in May, reports the BLS.

Year-on-year, the number of job openings was up 8.8 percent. The number of hires remained well below job openings at 5.651 million in June, down from May's 5.747 million, while separations, which includes quits, layoffs and discharges, rose to 5.502 million from 5.419 million.
 

That means there were more than 1 million jobs that remained unfilled, which has to put more pressure on employers to boost wages. So will inflation behave enough to allow an increase in real wages, which should be rising above the rate of inflation this late in the recovery from the Great Recession?

That has been the problem since the 1970s, really. The Fed wants to keep inflation low, so it raises interest rates whenever there is a sign that workers’ wages are rising faster than inflation. But this puts a damper on consumer spending, which in turn keeps economic growth in the 2-3 percent range, which isn’t enough to either pay down personal or government debts.

And social security trustees calculate the $3 trillion social security trust fund will be depleted by 1934, which would mean taxes must be raised to maintain current benefits before then. Does anything believe Congress will allow said benefits to shrink, with voting seniors just daring them to cut their benefits?

It’s much easier for the Fed to allow inflation to rise above its 2 percent target range before raising their interest rates to allow faster wage growth, which in turn boosts tax revenues. The social security trustees use a mid-range GDP growth rate of approximately 2.6 percent to calculate longevity of the SS trust fund.

GDP growth has averaged 3.5 percent since the 1930s, including the Great Depression. Why have inflation hawks at the Federal Reserve so slowed growth since the 1970s by boosting interest rates at the slightest hint of higher inflation, which in turn has kept GDP growth below its long-range potential?

The real answer is that pro-business, pro-corporate administrations since 1980 have severely limited collective bargaining and other pro-labor laws in the name of globalization, thus limiting wage growth.

That’s why such policies are called trickle-down economics. Very little of the national wealth created since then has trickled down to the 80 percent that are the real wage earners.

Harlan Green © 2018


Follow Harlan Green on Twitter: https://twitter.com/HarlanGreen

Saturday, July 7, 2018

June Employment Robust For How Long?

The Mortgage Corner

More workers are being hired in manufacturing and professional services in June’s unemployment report. But this is before the trade war now taking hold with at least 5 allies and trading partners.
Washington's 25 percent duties on Chinese imports went into effect at midnight EDT and affected products such as water boilers, X-ray machine components, airplane tires and various other industrial parts. China immediately retaliated with tariffs on its $34 billion list of goods issued last month, including soybeans, pork and electric vehicles.

We know that manufacturing will also be hurt by the tariffs on imported steel and aluminum that go into the finished products the US exports, so the 36,000 new hires in manufacturing may be a temporary blip as manufacturers attempt to get ahead of already occurring price rises.
Even more hurt will be put on Midwestern farmers, as China, the EU, Canada, and maybe even Mexico will be targeting their produce with higher tariffs in response to Trump’s levies.


A sharp rise in the number of unemployed actively looking for a job, to 6.564 million from 6.065 million in May, lifted the unemployment rate 2 tenths to 4.0 percent from 3.8 percent in May, and also lifted the participation rate 2 tenths to 62.9 percent.

It’s because for the first time in nearly 20 years of existing records,  the number of job openings in April at 6.698 million in the Labor Department’s JOLTS report exceeded the number of unemployed actively looking for work, at 6.346 million. It suggests employers are having a hard time finding people to fill the jobs. That is the understatement of the year.

The gap between openings and hires in the JOLTS report was 1.120 million, the second largest on record next only to March's 1.147 million. It also gives a picture of why employers are having finally to raise their workers’ pay.
The Bureau of Labor Statistics reported “The number of persons employed part time for economic reasons (sometimes referred to as involuntary part-time workers) was little changed in June at 4.7 million. These individuals, who would have preferred full-time employment, were working part time because their hours had been reduced or they were unable to find full-time jobs."
But add the 1.5 million that want to work but haven’t worked in the past 26 weeks, and we still have a decent labor pool to draw from. It all adds up to 7.8 percent that are the “Total unemployed, plus all persons marginally attached to the labor force, plus total employed part time for economic reasons, as a percent of the civilian labor force plus all persons marginally attached to the labor force,” per the BLS.
So is the June jobs report just an attempt to get ahead of the inevitable jump in prices and job losses that a trade war causes? Such a war has to seriously hurt all business, not just US businesses.

Harlan Green © 2018

Follow Harlan Green on Twitter: https://twitter.com/HarlanGreen

Friday, June 8, 2018

JOLTS Report Suggests Workers Holding Out for Higher Pay

Financial FAQs
 

“For the first time in nearly 20 years of existing records, the number of job openings, at 6.698 million in April, is exceeding the number of unemployed actively looking for work, at 6.346 million in April (subsequently falling in last week's employment report to 6.065 million in May),” said Econoday on Tuesday’s release of the Labor Department’s JOLTS report.

Also, the gap between openings and hires in the JOLTS report, at 1.120 million, is the second largest on record next only to March's 1.147 million, reported Econoday.  It suggests employers are having a hard time finding people to fill the jobs. That is the understatement of the year. There are still 6 million working adults not happy; who are either looking for work or who work part time but want fulltime work, as I reported in the May Unemployment Report.

It means in fact employers will have to pay more to fill those job vacancies. The full name of the JOLTS report is Job Openings and Labor Turnover Survey, which also measures the Quits rate, the percentage of workers voluntarily leaving a job. And that is at the high end in this cycle, which means more are quitting and probably finding better-paying jobs.


Average hourly earnings are still rising just 2.7 percent per year, when they should be in the 3 to 4 percent range at this late stage of the recovery. That’s barely above the Fed’s preferred Personal Consumption Expenditure price inflation figure of 2 percent. Workers’ wages are barely keeping up with rising prices, in other words, hence they are extremely stretched and borrowing more than they are spending.

Hence, the record job openings. Those openings aren’t enticing enough to bring more workers back into the workforce. And that is of major concern; as tax revenues aren’t even close to covering the added federal debt of more than 2.2 trillion over the next 10 years according to the latest analysis of the recent tax cuts.

Consumer spending on consumer goods in April is picking up for a second straight month, pointing to a pickup in the U.S. economy in the spring. Spending jumped 0.6% after a revised 0.5% gain in March, the government said Thursday. But that is at the cost of drawing down their savings to dangerous lows.

Several Wall Street firms upped their GDP forecasts due to the spending uptick, but consumers’ personal savings rate dropped to 2.8 percent, only the third time since 2009 to drop below 3 percent.
Amherst Pierpont Securities raised its estimate of second quarter GDP growth to 4.5 percent from 4.2 percent. Macroeconomic Advisers increased its forecast to 4 percent from 3.6 percent. Barclays also upped its estimate, but it was near the low end of forecasts, raising its Q2 target to 3.3 percent from 3 percent.

GDP has only topped 4 percent three times since the end of the Great Recession in mid-2009; mostly due to the very poor growth in household incomes since its end in mid-2009. Why don’t corporations raise their workers’ wages enough to fill some of those job openings, even with the recent huge tax cut windfall? That’s a story for another time.

But we know what causes recessions, and depressions. Roosevelt’s Fed Chairman Marriner Eccles spelled it out in the 1930s:

"As mass production has to be accompanied by mass consumption, mass consumption, in turn, implies a distribution of wealth ... to provide men with buying power. ... Instead of achieving that kind of distribution, a giant suction pump had by 1929-30 drawn into a few hands an increasing portion of currently produced wealth. ... The other fellows could stay in the game only by borrowing. When their credit ran out, the game stopped."

Harlan Green © 2018

Follow Harlan Green on Twitter: https://twitter.com/HarlanGreen

Tuesday, October 17, 2017

Republicans Are Killing Housing

The Mortgage Corner

The Trump administration and Republicans’ anti-immigration policies will kill the housing market. Why? Trump wants to cut immigration quotas by 50 percent when there aren’t enough qualified workers to fill current job openings. And congress can’t agree on anything that gives easier access to citizenship for the foreign-born; which is why there is a housing shortage.

The housing market can’t provide enough housing even for current population growth. Both new and existing-home sales have declined this year because of the lack of housing. Builders and real-estate agents have complained for years about more red tape, tighter lending standards and a scarcity of inexpensive lots to build on.

And builders are now facing an extreme labor shortage. They can’t find enough carpenters, bricklayers and other workers with the needed skills. “Labor and material shortages are holding construction back, and will continue to do so for some time yet,” says Marketwatch, citing economists at Capital Economics.

Graph: FRED

The number of existing-homes listed for sale in 2017 to date is the lowest since 1999, according to the NAR. That’s in part because distressed sales volumes have fallen from more than 100,000 a month at the peak of the post crisis period, 2009-2012, to about 25,000 today, which means there aren’t many cheaply-priced homes left over from the housing crash. 

I said last week the Labor Department reported there were 6.1 million job openings in August in its JOLTS report, or Job Openings and Labor Turnover Survey, which was “little changed” from July, while hirings remained far behind at 5.430 million. The very large gap has been little changed for more than a few months. At 652,000, the current spread between openings and hirings is one of the very widest on record, and two months ago it was even higher—the spread was 1 million.

Why? There aren’t enough workers to fill current job openings; as I said—and the Trump administration wants to restrict the supply even further in its single-minded pursuit of minority white-nationalist voters?


Economists know that to advance economic growth to say, 3 percent for any length of time, 2.8 million new workers are needed each year, when our domestic population is capable of just 600,000 new adult workers, according to the U.S. Census Bureau. So where are the additional workers to come from if Trump and the Republican congress continue to block a more enlightened immigration policy?

Housing affordability will suffer the most, when household incomes are rising at half the rate of both housing prices and rental rates. It’s a sad fact that the average production and non-supervisory worker earned $37,600 annually in 2016. “When adjusted for inflation, the average wage has remained stagnant for 50 years,” said Executive Pay Watch, in a report conducted by the American Federation of Labor and Congress of Industrial Organizations (AFL-CIO).

So we are at a crossroads, if we want to provide the necessary housing for our growing population. A more enlightened immigration policy is the first step. And then Republicans should drop their obsession with unnecessary tax cuts and instead focus on that $1 trillion infrastructure bill they’ve talked so much about.  It’s even more necessary because of the horrific hurricanes.

Harlan Green © 2017

Follow Harlan Green on Twitter: https://twitter.com/HarlanGreen

Thursday, October 12, 2017

JOLTS Report And Too Many Job Openings!

Financial FAQs

The Labor Department reported today there were 6.1 million job openings in August in its JOLTS report, or Job Openings and Labor Turnover Survey, which was “little changed” from July, while hirings remained far behind at 5.430 million.  Corporations are flush with cash from record profits, so they need to put that cash to work by filling more of those job openings instead of asking for tax cuts they don’t need.

Graph: BLS.gov

In fact, the very large gap has been little changed for more than a few months. At 652,000, the current spread between openings and hirings is one of the very widest on record, and two months ago it was even higher—the spread was 1 million.

Yes, the gap between openings and hiring first opened up about 2-1/2 years ago signaling that employers are either not willing to offer high enough pay to fill empty positions and/or are having a hard time finding people with the right skills.

It’s worse than that. I maintain companies (corporations in particular) are using their record profits (up 7.4 percent in one year) to buy back their stock, instead; which enhances CEO pay.

I reported two weeks ago that Executive Pay Watch, in a report conducted by the American Federation of Labor and Congress of Industrial Organizations (AFL-CIO), said last year CEOs were paid 335 times the average worker. The average production and non-supervisory worker earned $37,600 annually in 2016. “When adjusted for inflation, the average wage has remained stagnant for 50 years,” said the report. 

This brake on economic growth is mainly because corporations have been able to successfully resist their employees’ demands for higher wages due to corporations’ monopoly positions in many industries, and massive lobbies. Instead they’ve used most of those profits to buy back their stock, and so enhance their earnings. CEO pay spiked 19.6 percent last year, before inflation.

And next year may not be better for their employees. I also reported recently that “Pay raises for U.S. employees are not expected to improve next year, according to a survey released recently by global professional services company Aon, based on a survey of over 1,000 companies. Base pay is expected to rise 3 percent in 2018, up slightly from 2.9 percent in 2017. Spending on variable pay — incentives or bonuses — will be 12.5 percent of payroll, low levels not seen since 2013. This suggests a “pessimistic view of corporate performance in the coming year,” Ken Abosch, a strategy and development analyst at Aon, said in a statement.


How can corporations be pessimistic about their prospects with their record profits? They now have the largest profits as a percentage of Gross Domestic Income (a measure of total national income) in history.

So, it should be obvious corporations want more tax breaks, rather than pay their employees more, so the Aon survey is suspect. Corporations are really not interested in expanding their markets—at least in the U.S. of A. They are more interested in expanding the pocketbooks of their executives and stockholders, which is why GDP growth has been below the long term average.
As Nobel economist Joseph Stiglitz has been saying for years, “…it is not as if America’s large corporations were starved for cash; they are sitting on a couple of trillion dollars. And the lack of investment is not because profits, either before or after tax, are too low; after-tax corporate profits as a share of GDP have almost tripled in the last 30 years.”
Consumers power two-thirds of economic activity, so economic growth can’t improve unless the incomes of consumers grow, and that won’t happen as long as corporations hoard their profits rather than invest in their own employees future growth.

Harlan Green © 2017

Follow Harlan Green on Twitter: https://twitter.com/HarlanGreen