Showing posts with label ISM non-manufacturing survey. Show all posts

Monday, May 26, 2025

Manufacturing Not the Problem

 Popular Economics Weekly

“In April, U.S. manufacturing activity slipped marginally further into contraction after expanding only marginally in February. Demand and output weakened while input strengthened further, conditions that are not considered positive for economic growth.” ISM Manufacturing
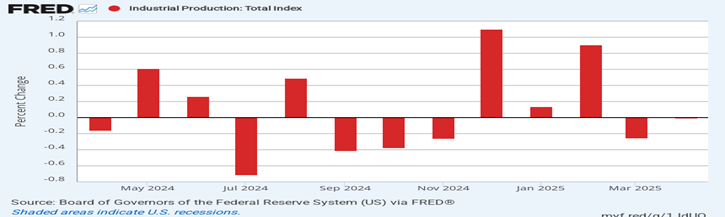
U.S. industrial production has stalled. Manufacturers are producing more than they can sell (higher input vs. output/demand). Unable to export the excess production, the Federal Reserve’s measure of industrial production showed seven months of zero or negative growth since last April.

What does that tell us? That manufacturing is no longer as important to our economy. We are now a mostly consumer-driven society that shops until we drop (and savings are exhausted), do lots of leisure things like travel and services that cater to us, such as healthcare, education, professional services (lawyers, doctors, engineers, etc.) construction, transportation and warehousing, and financial services.

But we also develop and export lots of software; information technologies, AI, ChatGPT and the like. This is all part of the service sector that really drives our economy. So, when President Trump says we need to bring back manufacturing, there’s not much manufacturing to bring back that would improve growth.

Also, we don’t have enough workers to fill the manufacturing jobs we have now. NyTimes’ David Brooks in an excellent Op-ed piece on our manufacturing history, said manufacturers can’t find enough workers today. There are almost 500,000 vacancies in manufacturing jobs. Trump is leading us down a blind path that only benefits him and Republicans, in other words.

This is while the service sector is still growing and will continue to grow even with more tariff threats if consumers will keep spending. The financial markets are more uncertain about future growth with higher tariffs because it means higher interest rates. We shouldn’t forget that former Fed Chair Alan Greenspan’s “irrational exuberance” speech warning that the financial markets were oversold, was four years before the Dot-com bubble burst and a recession ensued in 2000.

The Institute of Supply Management’s report on the service sector remains optimistic. “Economic activity in the services sector expanded for the 10th consecutive month in April, say the nation's purchasing and supply executives in the latest Services ISM® Report On Business®. The Services PMI® registered 51.6 percent, indicating expansion for the 56th time in 59 months since recovery from the coronavirus pandemic-induced recession began in June 2020.”

The take from this news is that Trump will make up any story to justify higher tariffs. He is thereby raising import taxes on the one hand for consumers and Main Street because we import so much, while cutting taxes for the wealthiest with the other hand via renewal of his tax cut bill that will cost more than $3trillion, according to government watchdog agencies.

Add the Medicaid and benefit cuts to the tariff costs, while firing those workers that run social security, Medicare; services that benefit all of us; and we can see the huge transfer of wealth to the oligarchs that Republicans’ budget deficits are engineering.

Harlan Green © 2025

Follow Harlan Green on Twitter: https://twitter.com/HarlanGreen

Wednesday, September 6, 2023

Consumer Services Show Growth Rebound

 Popular Economics Weekly

TradingEconomics

Why are the likes of Goldman Sachs chief economist Jan Hatzius predicting no looming recession and better economic growth ahead?

It’s partly because of Bidenomics, the boost to growth that the infusion of $billions into renewal of the US economy in infrastructure, CHIPs manufacturing, and the conversion to more climate friendly policies has jump started.

But it is also because consumers feel prosperous enough to continue to shop and enjoy more leisure activities such as dining out and travel.

The latest indicator of said prosperity is the Institute of Supply Management’s monthly survey of service sector industries that show a continuing expansion rather than contraction of these services, with any number above 50 in its index indicating expansion.

The ISM non-manufacturing Services PMI unexpectedly jumped to 54.5 in August 2023, pointing to the strongest growth in the services sector in six months, compared to 52.7 in July and forecasts of 52.5.

“Thirteen industries reported growth in August’” said Anthony Nieves, Chair of the Institute for Supply Management® (ISM®) Services Business Survey Committee.. “The Services PMI®, by being above 50 percent for the eighth month after a single month of contraction and a prior 30-month period of expansion, continues to indicate sustained growth for the sector. The composite index has indicated expansion for all but three of the previous 162 months.”

The service sector comprises more than 60 percent of economic activity, and overall consumer spending now almost 70 percent; even more important because of the shrinking industrial sector that Bidenomics is attempting to revive.

And surprise, surprise, Real Estate, Rental & Leasing were the leading service activities, with Accommodation & Food Services next in line. Does it mean the real estate sector (and housing) is recovering and could lead US out of the current malaise?

The construction sector, for instance, continues to expand with a total of 67,000 new construction jobs added in just the past three months.

Bidennomics is also helping decrease the growing income inequality, which has poisoned our politics as well as increased drug use and suicide rates among the working age population.

It’s become so bad that the top 1 percent of income earners corralled 19 percent of incomes earned in 2021, per the NYTimes graph, vs. its low of some 10 percent in the 1970s.

NYTimes

In the words of NYTimes David Leonhardt, “He (Biden) has signed laws (sometimes with bipartisan support) spending billions of dollars on semiconductor factories, roads, bridges and clean energy. He has tried to crack down on monopolies. He has encouraged workers to join unions.”

The ISM non-manufacturing survey reported faster increases were seen in business activity (57.3 vs 57.1), new orders (57.5 vs 55), employment (54.7 vs 50.7) and inventories (57.7 vs 50.4). Also, supplier deliveries increased (48.5 vs 48.1). In the last six months, the average reading of 47.7 percent reflects the fastest supplier delivery performance since June 2009.

This all is a sign that the service sector, comprising more than 60 percent of US economic activity is picking up speed, not slowing down.

Harlan Green © 2023

Follow Harlan Green on Twitter: https://twitter.com/HarlanGreen

Tuesday, November 8, 2022

We Have A Soft Landing (if the Fed is listening)

 Financial FAQs

FREDdurablegoods

After four consecutive 0.75 percent rate hikes, the Fed should slow down its rate increases, say at least three Federal Reserve Governors. That is good news as we try to assess the likelihood of another recession.

It’s good news because there are already signs of a possible soft landing in 2003, if the Fed will take their foot off the economic brakes until there is more certainty of its tightening efforts down the road.

Reuters quotes the Chicago Fed’s Charles Evens (San Francisco and Richmond Fed Presidents also advocate slowing) that it is time for the Federal Reserve to shift to smaller interest rate hikes to avoid tightening monetary policy more than needed and slow the pace further once risks become more "two-sided," (i.e., a possible recession) Chicago Fed President Charles Evans said on Friday.

"From here on out, I don't think it's front-loading anymore, I think it's looking for the right level of restrictiveness," Evans told Reuters in an interview, referring to the U.S. central bank's string of supersized rate hikes.

If the Fed did nothing more this year, we could have a ‘soft landing’ since growth is already slowing in both the manufacturing and service sectors of our economy.

New orders for factory goods are down, for instance (see top line in above FRED graph from 2/92) and holding at a lower level of activity. Orders for manufactured goods rose 0.3 percent in September, the Commerce Department said last Thursday, and orders have risen eleven months of the past year. The factory sector led the economy’s recovery from the pandemic because of huge pent-up demand for things like automobiles and other durable goods after the pandemic.

The ISM’s manufacturing index is now close to breakeven. The S&P global U.S. manufacturing PMI inched up to 50.4 in its “final” reading in October from the “flash” reading of 49.9. This is down from a reading of 52 in September.

“The U.S. manufacturing sector continues to expand,” said ISM Chair Timothy Fiore, “but at the lowest rate since the coronavirus pandemic recovery began. With panelists reporting softening new order rates over the previous five months, the October index reading reflects companies’ preparing for potential future lower demand.”

The Institute for Supply Management (ISM) serviced sector (non-manufacturing) Index that measures conditions at companies such as retailers and restaurants fell to 54.4 percent in October and touched the lowest level since the U.S. lockdowns in 2020, pointing to a slowing U.S. economy. A number above 50 signals expansion; but settling in a more normal range typical of a slower growing economy.

Granted this is before the Fed’s latest rate hikes take hold that could reduce the demand for goods and services even further, Consumer borrowing that is reported by the Fed is a better indicator of consumer wherewithal, since they wouldn’t be shopping as much as they have been if they fear an imminent recession.

Consumercredit

Consumer credit has been declining slowly, but again it is back to more normal pre-pandemic levels (see above Fed chart from 1/04). Revolving credit, like credit cards, rose 8.7 percent in September, less than half of the 18.1 percent gain in the prior month. Nonrevolving credit, typically auto and student loans, rose 5.7 percent, up from a 4.5 percent growth rate in the prior month. This category of credit is much less volatile.

The growing danger is to continue to tighten while there are still shortages of food and energy supplies, while demand is already shrinking in the rest of the world.

China’s economic woes are one example. Reuters reports “China's exports and imports unexpectedly contracted in October, the first simultaneous slump since May 2020, as a perfect storm of COVID curbs at home and global recession risks dented demand and further darkened the outlook for a struggling economy.”

The San Francisco Fed has also flagged the danger with its own published research that suggests we have already tightened too much. U.S. monetary policy is tighter than the Federal Reserve's policy rate suggests, according to research published Monday by the San Francisco Fed, with financial conditions by September 2022 reflecting the equivalent of a 5.25 percent policy rate, which it the top boundary of Chairman Powell’s own prediction.

"Accounting for the broader stance of policy and comparing the proxy rate to simple rules suggests U.S. monetary policy tightened sooner and more sharply than has been generally recognized," the Letter said.

Given what could be a brutal economic winter for much of the world, and demand maybe reaching parity with supply so that risks become more "two-sided" in Chicago Fed President Charles Evans words, we may now see a more benevolent Federal Reserve and enjoy the possibility of a soft landing.

Harlan Green © 2022

Follow Harlan Green on Twitter: https://twitter.com/HarlanGreen

Thursday, September 8, 2022

When Bad News is Good News

Financial FAQs

FREDserviceemployees

Doomsayers, such as historian Niall Ferguson, may be doing the Federal Reserve’s job by predicting a recession in the coming year. Their dire warnings are causing plunging stock prices for starters. And oil prices are plummeting as well, with WTI oil down to $83 per barrel at this writing.

Dr. Ferguson warned last Friday that the world is sleepwalking into an era of political and economic upheaval similar to the 1970s — only worse.

“The ingredients of the 1970s are already in place,” Ferguson, Milbank Family Senior Fellow at the Hoover Institution at Stanford University, told CNBC’s Steve Sedgwick.

“The monetary- and fiscal-policy mistakes of last year, which set this inflation off, are very alike to the ’60s,” he said, likening recent price hikes to the high inflation of the 1970s.

The U.S. economy is doing well, in spite of the doomsayers, as illustrated by the FRED graph above showing employment in the service-sector holding up that employs most American workers (gray bar is last recession).

The ISM’s service-sector index that measures business conditions at companies such as restaurants and hotels rose to 56.9 percent in August from 56.7 percent in the prior month, the Institute for Supply Management said Tuesday. It is the highest level since April.

“In August, the Services PMI® registered 56.9 percent, 0.2 percentage point higher than July’s reading of 56.7 percent,” said Anthony Nieves, Chair of the Institute for Supply Management® (ISM®) Services Business Survey Committee. “The Business Activity Index registered 60.9 percent; an increase of 1 percentage point compared to the reading of 59.9 percent in July. The New Orders Index figure of 61.8 percent is 1.9 percentage points higher than the July reading of 59.9 percent.”

Yet inflation is already moderating with average gas prices below $4 per gallon and both the Consumer Price Index and Producer Price Indexes down from their highs.

Such fears generated by the doomsayers—with little to go on except past history rather than present conditions—are doing as much to bring down inflation as the Fed’s hawkish comments that they will continue to push up rates until inflation is tamed.

This is also indicated by the various surveys that measure consumers’ future inflation expectations, such as put out by the University of Michigan’s sentiment survey. Future expectations of CPI inflation have averaged 3 percent since 2012 when the survey was first conducted.

“The median expected year-ahead inflation rate was 4.8%, down from 5.2% last month and its lowest reading in 8 months,” said the UMich survey’s Director and Chief Economist Joanne Hsu. “Uncertainty over expectations rose considerably, particularly among lower-educated consumers. Long run expectations came in at 2.9%, remaining within the 2.9-3.1% range seen in the past year (actually since 2012 per its chart).

So, all the bad news about a possible recession may be good news for economic growth, and consumers, if it keeps the Fed from putting too much pedal to the interest rate metal, as the saying goes. The Fed may not have to keep boosting short-term rates if they see consumers and producers pulling back as demand cools.

The remarks from recognized pundits are enough to recall the draconian measures taken by former Fed Chairman Paul Volcker’s Fed that raised its overnight rate to 20 percent to combat the 1970’s era inflation, causing two subsequent recessions in the 1980s.

Fed Chair Powell’s Fed doesn’t have to fight inflation on his own. There’s help on the way from those pessimists who won’t see what is staring them in the face—an economy still recovering from the worst pandemic in 100 years.

Maybe it will keep the Fed from raising interest rates much further?

Harlan Green © 2022

Follow Harlan Green on Twitter: https://twitter.com/HarlanGreen


Wednesday, August 3, 2022

Is the Recession Already Over?

 Financial FAQs

Calculated Risk

I was a bit facetious last week when I said calling a recession at this time because we may have two consecutive quarters of negative GDP growth is almost irrelevant, because it may be over as quickly as the artificially induced two-month recession in April-May 2020, when the pandemic was building a head of steam.

But another indicator, the JOLTS report that measures the number of job openings (black line in graph) decreased to 10.7 million on the last business day of June, the U.S. Bureau of Labor Statistics reported today. The slight decline in openings was too small to be conclusive of an extended downturn

Hires and total separations were little changed at 6.4 million and 5.9 million, respectively. Within separations, quits (4.2 million) and layoffs and discharges (1.3 million) were little changed.

The number of job opening didn’t rise above the longer term normal of 6-7 million openings until January 2017, per the Calculated Risk graph. That is when economic growth began to take off, and it rose sharply to its current nosebleed range of 11 million openings after the two-month 2020 recession.

The number of hires (blue line) and Layoffs (red bar) leveled off and began to taper in January 2022 per the graph, so then began a slight downturn in job formation that could predict looming negative GDP growth.

What better proxy for the beginning of a recession than the slowing of job growth? I also mentioned last week that consumer confidence was another good proxy, which is still in decline.

We will know more this Friday with release of the government’s July unemployment report. The rate has been below 4 percent since last December.

But we have now the just released ISM non-manufacturing survey of supply managers beginning to rise again. The ISM barometer of business conditions at companies such as restaurants and hotels that employ most workers rose to a three-month high of 56.7 percent in July, suggesting the economy is beginning to expand again in the face of growing headwinds.

“According to the Services PMI®, 13 industries reported growth,” reported Anthony Nieves, Chair of the Institute for Supply Management® (ISM®) Services Business Survey Committee. “The composite index indicated growth for the 26th consecutive month after a two-month contraction in April and May 2020. Growth continues — at a faster rate — for the services sector, which has expanded for all but two of the last 150 months. The slight increase in services sector growth was due to an increase in business activity and new orders.”

Orders and production rose, hiring improved and intense inflationary pressures eased somewhat last month, business executives told the Institute for Supply Management.

Even U.S. factory orders rose 2 percent in June, the government said Wednesday, in a report that offered some good news .Orders for durable goods made to last at least three years climbed a revised 2 percent in June, up from an initial 1.9 percent. Most of the increase was in autos and military planes. Orders for nondurable goods such as clothing and food products also rose 2 percent. Orders for nondefense capital goods, excluding aircraft rose a revised 0.7 percent, up from the prior reading of a 0.5 percent gain. Manufacturers are growing more slowly as the economy decelerates, but they are still growing.

This means we could already have reached a ‘trough’ in growth, or the bottom of the down cycle. And that confuses things even further! Stay tuned for Friday’s unemployment report to know more.

Harlan Green © 2022

Follow Harlan Green on Twitter: https://twitter.com/HarlanGreen

Saturday, April 9, 2022

What Stagflation?

 Financial FAQs

TradingEconomics

U.S. service sector activity that powers two-thirds of economic activity (above graph) is surging more than ever, according to the Institute of Supply Management non-manufacturing survey. It is growing per 58.3 percent of managers surveyed, with the index for employment and new orders even higher. New orders rose 4 points to 60.1 percent, and production activity also edged higher.

“In March, the Services PMI® registered 58.3 percent, a 1.8-percentage point increase compared to the February reading of 56.5 percent," said Anthony Neeves, Chair of the Institute for Supply Management®. "The 12-month average is 62.3percent, which reflects consistently strong growth in the services sector. The March reading indicates the services sector grew for the 22nd consecutive month after two months of contraction and 122 months of growth before that. A reading above 50 percent indicates the services sector economy is generally expanding; below 50 percent indicates the services sector is generally contracting.”

So this doesn’t look like impending stagflation, the wage-price spiral that happened in the 1970s and pushed inflation to record highs, while growth came to a standstill.

Pundits and some banks that forecast a future wage-price spiral seem to have forgotten that it took consecutive Arab (OPEC) oil embargoes in the 1970s causing gasoline shortages and long lines at gas stations for almost a decade to make that happen.

Whereas the Ukraine war and its concomitant sanctions are less than two months old. Why should we even be worrying about prolonged inflation, and what the Fed might do to tame it, when we don’t know whether this war will last for months, or years, and what will be needed to win it?

Predictions of a looming recession are premature, so say the least. Both the service and manufacturing sectors are booming, while supply chains are struggling to catch up and replenish inventories.

This is while the jobs market is red hot with more returning to work. New U.S. jobless claims matched a 54-year low of 166,000 in early April, for instance — the second lowest reading in history— during a period of remarkably strong hiring and the lowest layoffs on record.

The ISM’s service sector employment index increased to 54% from 48.5%. Businesses got no relief from inflation, however. The prices-paid index moved up to 83.8% from 83.1%, just a tick below a record high.

What will help to tame the inflation tiger? More workers returning to work will increase production, replenishing inventories. And governments will be increasing their spending, as well, due to the Ukraine war. This will stimulate further production increases.

MarketWatch columnist Jeffry Bartash maintains what was called the “Great Resignation” is over, a time since the pandemic when workers were reluctant to return to work.

“To be sure, Americans have been saying “I quit” in record numbers,” said Bartash. “Almost 57 million people left jobs — many more than once — in the 14-month period from January 2021 to February 2022. That’s a 25% spike vs. a similar time span before the pandemic.”

The hiring wave began more than a year ago. The U.S. added 431,000 new jobs in March, the government said last week, extending a streak of large job gains going back to the start of 2021. The unemployment rate also sank to 3.6 percent last month — just a tick above a 53-year-low — from nearly 15 percent just two years ago.

“All of the hiring took place against the backdrop of high covid cases and the reluctance of millions of formerly employed people to return to the labor market. Hiring might have taken place even faster, economists say, if the pandemic had petered out and generous government unemployment benefits were ended sooner,” continued Bartash.

So maybe we can endure a bit more inflation if the red hot demand that’s causing it is bringing more people into the workforce and helping Ukraine to win its war?

Harlan Green © 2022

Follow Harlan Green on Twitter: https://twitter.com/HarlanGreen

Thursday, November 4, 2021

Manufacturing, Service Sector Growth Prolong Recovery

 Financial FAQs

 FREDmanufacturing

U.S. manufacturing and service sector activity continued to climb, despite the price hikes and supply bottlenecks. And we are just at the beginning of the holiday shopping season. Both economic sectors per the ISM supply managers’ indexes show a continuing red-hot demand for goods and services.

Inflation worriers can worry less, as production speeds up. Manufacturing output alone is up 14.8 percent in the second quarter YoY (see FRED graph), reducing price pressures. Eventually resolving supply-chain issues of clogged ports and container shipments will cause supplies to catch up to the demand for goods.

Timothy R. Fiore, ISM Manufacturing Chair, said “Business Survey Committee panelists reported that their companies and suppliers continue to deal with an unprecedented number of hurdles to meet increasing demand. All segments of the manufacturing economy are impacted by record-long raw materials lead times, continued shortages of critical materials, rising commodities prices and difficulties in transporting products. Global pandemic-related issues — worker absenteeism, short-term shutdowns due to parts shortages, difficulties in filling open positions and overseas supply chain problems — continue to limit manufacturing growth potential.”

The ISM services index measuring economic activity in industries such as Retail Trade; Transportation & Warehousing; Real Estate, Rental & Leasing; Arts, Entertainment & Recreation; jumped to an all-time high of nearly 67 in October, the Institute for Supply Management said Wednesday. The Business Activity and New Orders indexes reached 69.8 percent.

This tells us again that retail sales making up some 50 percent of consumer spending will continue strong in the holiday shopping season.

“In October, strong growth continued for the services sector, which has expanded for all but two of the last 141 months,” said ISM chair Anthony Nieves in a statement. “However, ongoing challenges — including supply chain disruptions and shortages of labor and materials — are constraining capacity and impacting overall business conditions.”

Though the huge obstacles to supply are causing some uncertainty, any figure above the 50 percent ISM survey breakeven point shows expansion. This is a sign that businesses are just beginning the replacement cycle of plants and equipment, rather than any imminent slowdown of activity caused by the bottlenecks and labor shortages.

As a side note, the number of Americans who applied for unemployment benefits in late October fell to yet another pandemic low in the latest week, reflecting an urgent need by companies to hold onto to current employees and find new ones. New jobless benefit claims dropped by 14,000 to 269,000 in the seven days ended Oct. 30, the government said Thursday.

Some five million have not returned to work that were employed before the pandemic and there are 10 million job openings, so it’s not yet possible to know when and if the current labor shortage will continue to put a drag on growth.

But, in a way, this might cool demand enough that economic growth doesn’t overheat and bring on another asset bubble, and maybe tame the inflation tiger as well.

Harlan Green © 2021

Follow Harlan Green on Twitter: https://twitter.com/HarlanGreen

Tuesday, July 7, 2020

Why So Much Inequality?

Financial FAQs
ISM NonMfg bus act v comp

Nobel Laureate and NYTimes columnist Paul Krugman has said it would probably take something on the scale of an alien invasion to create the emergency programs and policies that would benefit all Americans, such as another New Deal that brought US out of the Great Depression.

Well, it looks like we have an alien invasion with the new coronavirus pandemic infecting and killing so many. But can we unite to revive a new, New Deal spirit that government is the solution, and this alien coronavirus the problem?

We need such government programs and leadership similar to that which enabled us to survive the Great Depression and win WWII. That is the only way we can not only stop the spread of COVID-19, but revive the American economy. This means in part to establish policies that counter the massive transfer of wealth from workers to the owners of capital since the 1970s that now total $1Trillion annually, per an excellent NY Times article in the Sunday Review section.

Other countries are already enacting variations of New Deal policies that either pay companies directly to retain their workers, or support unemployed workers with a much more generous social safety net.

The U.S. must first find a way to bridge the yawning income gap that exists between the workers and the owners of capital. It is the fact that 40 percent of working Americans most affected by the COVID-19 pandemic have really no savings for such emergencies as the pandemic, in part because they earn less than a living wage in jobs like meat packing or warehousing, in retail or leisure and hospitality.

And more than 30 states are seeing a resurgence of COVID-19 infection rates that probably means a reversing of the re-openings since May of facilities that cater to large public gatherings, such as restaurants and bars.

What is a living wage? A living wage earner anyone that earns at least $15 per hour. Just do the math for a 40-hour work week, and there are only a few states that even have a $15 per hour minimum wage target. It comes to earnings of $2,580 per month, and $30,960 per year.

Nearly one-third of American households, 29 percent, live in "lower class" households, the Pew Research Center found in a 2018 report. The median income of that group was $25,624 in 2016. That means many of the 40 percent workers are, or were, middle class per PEW’s classification.

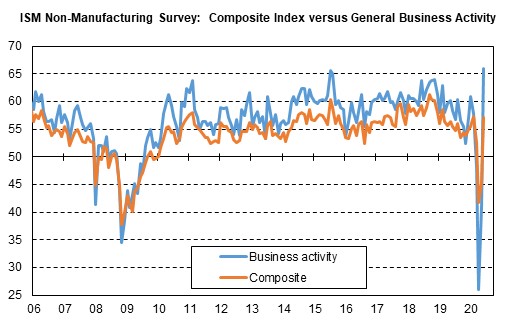
Some good news is that the Institute for Supply Management (ISM) reported its non-manufacturing index surged to it largest single-month percentage-point increase in the NMI® since its debut in 1997 (see the above graph). It’s telling us the service sector of the economy is growing again, but from a lower starting point.
“The NMI® registered 57.1 percent, 11.7 percentage points higher than the May reading of 45.4 percent,” said the report. This reading represents growth in the non-manufacturing sector after a two-month period of contraction preceded by 122 straight months of expansion.”
It is a sign the consumer sector is coming back to life that makes up two-thirds of economic activity, but how many consumers can take advantage of its services with some 15 million still out of work?

A University of Chicago-Beckman Institute survey also per the NY Times article found that 68 percent of the unemployed have unemployment insurance incomes with the $600 per month addition in the CARES Act (regardless of their previous income) that surpassed the take-home pay of their last job.

But those benefits expire by the end of July, and many of the 40 percent in the Leisure and Hospitality industries won’t be rehired until tourism and travel revive as well. That could take a long time with the novel coronavirus spreading again and regions such as the EU banning travel from countries with high infection rates, such as the U.S.

The bottom line is that at least 40 percent of working Americans will suffer even more from effects of the Coronavirus pandemic, unless government steps in to supplement their incomes in some way.

One big help is the suggestion by Baharat Ramamurti and Lindsay Owens of the Roosevelt Institute in another recent NY Times Op-ed that unemployment benefits be extended not only until they are able to find work again, but work that pays at least as much as their unemployment insurance.

And there is tremendous uncertainty among economists on when the current pandemic-caused recession will end. So it will take more than one-time programs such as the HEROES and CARES Acts to bring us back to sustainable economic growth for all Americans.

Let’s start by raising the national minimum wage above the current $7.25 per hour, last raised in 2009, and finally achieving universal health care for all Americans that almost all other countries in the world—developed and underdeveloped—already have.

This smacks of a new, New Deal, of course—a federal government that is required to serve all the people, which neo-conservatives and their special interests from the end of the Great Depression have lobbied against.

But that was 80 years ago, and now we have COVID-19 wreaking havoc on the economy as well as the physical health of too many Americans. Maybe this is the alien invasion that may finally unite us.

Harlan Green © 2020

Follow Harlan Green on Twitter: https://twitter.com/HarlanGreen

Wednesday, May 8, 2019

Where Are the Workers?

Popular Economics Weekly

The number of job openings rose to 7.5 million on the last business day of March, the U.S. Bureau of Labor Statistics reported today. Over the month, hires and separations were little changed at 5.7 million and 5.4 million, respectively.

But the miniscule change in hires and separations doesn’t tell us the real employment story. This Calculated Risk graph shows the huge separation between the yellow line (Job openings) and blue line (Hires). It’s now almost 2 million.


The actual difference was because job openings surged 4.8 percent in the month to 7.488 million at the same time that hires fell 0.6 percent to 5.660 million, according to Econoday. “The gap between the two stands at a new record of 1.828 million, signifying a huge demand for workers that isn’t being met.”

Year-on-year, openings are up 8.6 percent vs. only a 0.6 percent rise for hires. The gap between total openings in March relative to the 6.211 million unemployed actively looking for a job in the month was 1.277 million.

This tells us how complex is the hiring process, since it’s becoming ever more difficult to match those looking for work with the advertised job openings. How can we fix the problem from the mismatch?

One hint is we know from last week’s unemployment report almost 500,000 fewer workers were available for work in the Household Survey, shrinking the labor pool, even though job hirings were up in the seasonally adjusted Establishment Survey that reports actual payroll numbers.

I believe those either leaving the workforce, or still looking for work, are waiting for better job prospects. Most do not want Amazon warehouse or Walmart jobs that pay barely above minimum wages.

The largest hires in the April unemployment report were all in the services sector. Professional services, education and health services led, with Leisure/Hospitality and construction hiring next—all in the lower-paying service sector.

Only 4,000 manufacturing jobs were created, according to the BLS, with the utilities and mining sector losing jobs.

Both the Institute of Supply Management’s (ISM) manufacturing and service sector activity surveys also declined in March, with manufacturing activity the weakest in 2 years. It was mainly due to the decline in new orders, possibly due to the trade uncertainty.

The 3.2 percent increase in the initial Q1 GDP growth estimate was a pleasant surprise, as I said last week, but it was largely because spending by local governments picked up due to the partial federal government shutdown and a “turnaround in investment, most notably in construction of highways and streets,” said the BEA. 

Local and state governments may have been waiting to see if the Trump administration would chip in to boost needed infrastructure upgrades, and since that didn’t happen states decided to implement the needed projects.

The buildup in unsold inventories, and fewer imports also increased GDP numbers. That’s because import prices are rising as the recent tariff increases are being passed on to the consumer, contrary to what administration officials are saying.

And rising prices will put a cap on growth, as well as future hiring. So we are waiting to see if more are willing to work, or are still waiting for the right job so they can afford to pay for those higher prices.

Harlan Green © 2019

Follow Harlan Green on Twitter: https://twitter.com/HarlanGreen

Wednesday, March 6, 2019

Will Service Sector Boom Reduce Deficits?

Popular Economics Weekly


All 18 non-manufacturing industries reported growth in February, according to the ISM’s non-manufacturing index, which gives a monthly overview of service sector activity. This is huge and says the service sector that makes up two-thirds of US business activity will continue to power growth this year.

In fact, a growing US service sector is keeping the trade and budget deficits from worsening at a time when fiscal policy (the tax cuts) and trade policy (the tariffs) are slowing economic growth in 2019.

What is the service sector economy? It’s the financial services, trade, transportation, construction, education and health industries, for starters. It has become the dominant sector because most US consumers and businesses consume manufactured goods now made overseas. Hence the trade imbalance between imports and exports that Trump wants to ‘rebalance’ with his trade wars on allies and adversaries alike.

The trade wars are a dumb way to attempt to correct the imbalance of manufactured products, needless to say, because said ‘imbalance’ is offset by foreign investors eager to buy safe and secure US stocks and bonds. If the Trump administration and Republicans were really serious about rebalancing the trade imbalances, it would seek more trade alliances (such as the Trans-Pacific Partnership) and work to reduce the looming $1 trillion annual deficit, instead of passing the 2017 corporate tax cut.

The non-manufacturing sector’s growth rate rebounded after cooling off in January. Respondents said they are concerned about the uncertainty of tariffs, capacity constraints and employment resources; however, they remain mostly optimistic about overall business conditions and the economy.
“The NMI® registered 59.7 percent, which is 3 percentage points higher than the January reading of 56.7 percent,” said Anthony Nieves, Chair of the Institute for Supply Management Non-Manufacturing Business Survey Committee. “This represents continued growth in the non-manufacturing sector, at a faster rate. The Non-Manufacturing Business Activity Index increased to 64.7 percent, 5 percentage points higher than the January reading of 59.7 percent, reflecting growth for the 115th consecutive month, at a faster rate in February.”
Particularly robust was the New Orders Index that registered 65.2 percent, 7.5 percentage points higher than the reading of 57.7 percent in January. The Employment Index decreased 2.6 percentage points in February to 55.2 percent from the January reading of 57.8 percent.

What about the manufacturing sector that is made up of durable goods like machinery, computers and transportation; and non-durable goods such as furniture, chemicals and petroleum products? The ISM’s February manufacturing survey reported a 2.4-point drop to 54.2 in February that was above low estimates. There was also a 2.7-point drop in new orders, a 3.2-point drop for employment, and a 5.7-point slide for production.


The trade wars have to be part of the problem, since Trump has focused on tariffs for manufactured products only, whereas China is also stealing information technology. Hence the Hauwei networking ban that the US fears might have implanted Chinese spyware.
“Demand remains healthy at the beginning of 2019,” said one respondent. “However, growing concerns for what could be another round of tariffs in March are further escalating price increases of already constrained electronic components.”
The total US trade imbalance was minus $550B last year, with service sector trade showing a net trade surplus of around $250B, since we export much of our information technologies, and approximately $800B net deficit in manufactured goods that are more cheaply made overseas.
“So we can’t “win” a trade war,’ says Nobel economist Paul Krugman. “What we can do is start a cycle of tit-for-tat, and when it comes to trade, America — which accounts for 9 percent of world exports and 14 percent of world imports — is by no means a dominant superpower. A cycle of retaliation would shrink overall world trade, making the world as a whole, America very much included, poorer.”
Therefore it’s not such a good idea to expend too much of our energy in attempting to correct the manufacturing imbalance, when there are better ways to cure deficits that are of our own making.

Harlan Green © 2019
 
Follow Harlan Green on Twitter: https://twitter.com/HarlanGreen

Wednesday, August 8, 2018

Slower July Jobs Growth Worrisome

Popular Economics Weekly


Total nonfarm payroll employment rose by 157,000 in July, and the unemployment rate edged down to 3.9 percent, the U.S. Bureau of Labor Statistics reported today. Employment increased in professional and business services, in manufacturing, and in health care and social assistance.
A 157,000 rise in nonfarm payrolls for July is at the low end of Econoday's consensus range but is still healthy growth that is strong enough to absorb new entrants into the labor market. And revisions showed a net 59,000 gain with June revised up to 248,000 and May higher at 268,000 in what were two very strong months for job growth.

So the jury is out on when this fully employed economy will begin to slow down. The stock and bond markets are predicting another six months of growth, even with the trade war uncertainties. Trump seems to be holding off on bringing down the hammer of additional Chinese tariffs of $200B, and says he will work in concert with the EU on bringing China to the fair trade table.
The payroll increases were led by temporary help services which rose 28,000 in a very strong gain that indicates employers, stacked up with orders and backlogs, “are scrambling to meet demand,” says Econoday. “Construction payrolls also standout with a strong 19,000 gain in the latest indication of strength in this sector. Manufacturing payrolls rose 37,000 to more than double Econoday's consensus with trade & transportation, reflecting strong activity in the supply chain, up 15,000. Weakness in payrolls comes from mining, down 4,000 after a long series of gains, and also government payrolls which fell 13,000 to nearly reverse the prior month's 14,000 jump.”

Another caveat to continued growth is a slowing of activity in the service industries, at the lowest level in 11 months. ISM’s Non-manufacturing Composite Index reported both new orders, down more than 5 points to 57.0, and backlog orders, down 5 points to 51.5, show softening. Export orders in this report, at 58.0, remain very strong but are down 2.5 points.

Overall business activity also slowed, down nearly 7.5 points to 56.5 with delivery times showing less stress. Input prices remain highly elevated at 63.4, up nearly 3 points in the month, said the ISM.

But there is still the threat of higher auto tariffs, and Midwest farmers are being hurt by higher agricultural tariffs aimed at Trump country, so we can see that a sharp acceleration in inflation might unsettle both the job and financial markets.

Higher inflation and interest rates, in other words, should tell us whether the rising import and export prices will hurt jobs and company earnings in coming months.

Harlan Green © 2018


Follow Harlan Green on Twitter: https://twitter.com/HarlanGreen
Monday, February 5, 2018

Why the ‘Yuge’ Stock Market Selloff?

Popular Economics Weekly

Stock indexes had the largest one-day drop in history today; what happened? The quick answer is that too much money is chasing too few stocks, believe it or not. The record low interest rates—the 10-year treasury yield just dropped back to 2.75 percent from 2.85 percent before Friday’s selloff—is an indication of the huge cash hoard held by corporations and Wall Street from the successive Quantitative Easing programs by Central Banks that have kept interest rates at record lows.

This is while a Credit Suisse report released last March titled “The Incredible Shrinking Universe of U.S. Stocks,” says between 1996 and 2016, the number of publicly-listed stocks in the U.S. fell by roughly 50 percent — from more than 7,300 to fewer than 3,600 — while rising about 50 percent in other developed nations.

Why do corporations and their Republican lobbyists keep pushing for lower taxes, as I said in an earlier column? They say it will create more jobs. But, alas, that isn’t shown by the record. An excellent New York Times Op-ed by Sarah Anderson at the Institute for Policy Studies points out that many corporations create very few jobs with those profits.

She reported on 92 public-held American corporations between 2008-15 that pay less than 20 percent in taxes. They had a median job growth rate of 1 percent vs. 6 percent for all private sector corporations during that time. And 48 of those companies actually cut 438,000 jobs, while their chief executives’ pay last year averaged nearly $15 million, compared with the $13 million average for all S&P 500 companies.

This should tell us who doesn’t use their profits to increase productivity and growth of their markets; as well as where corporate profits are spent; on stock buybacks that have reduced the number of outstanding publicly listed shares to enhance stockholder returns and CEO paychecks.

It means huge swings in stock prices from too much money chasing too few stocks, should traders panic; which is what they did today and Friday. Yet the panic selling had no underlying reason. Factory orders and the service sector economy is growing even faster than last year while the unemployment rate is still stuck at 4.1 percent and maybe going lower as fewer unemployed workers are even available to fill jobs.

The year-on-year growth for durable orders in the factory sector which has been sloping higher, is now 11.5 percent in December from 8.7 percent in November. This a sign that manufacturing growth is still trending higher, while the ISM non-manufacturing index is at an almost all-time high of 59; which means 59 percent of those surveyed see increased growth in the service sector.


The ISM non-manufacturing sample is also reporting some of the very best conditions in the 20-year history of this series, reports Econoday and the ISM. New orders are arguably more important than any composite result and the reading, at 62.7, is back at last year's peak. Employment is a special standout, up more than 5 points to a very rare plus 60 score of 61.6 which is by the far the best of the post-2008 expansion.

So what to make of the 'yuge' selloff? Some traders are saying it was a series of electronic trading “glitches” that sent prices plunging for no economic reason, and stock prices fall below their intrinsic valuations. Algorithms were at fault on selling billions of shares on the click of a button that had been pre-programmed to sell when prices dropped to a certain level, while other algorithms were programmed not to buy while stocks continued to fall.

It meant computers were chasing each other’s tails; as if they had them. That’s what happens when algorithms rule over common sense, and traders lose their common sense.

Harlan Green © 2018

Follow Harlan Green on Twitter: https://twitter.com/HarlanGreen

Saturday, May 6, 2017

April Employment Up, Q1 Consumer Spending Weak

Financial FAQs

Total nonfarm payroll employment increased by 211,000 in April, and the unemployment rate fell to 4.4 percent from 4.5 percent in March, reported the U.S. Bureau of Labor Statistics today. Job gains occurred in leisure and hospitality, health care and social assistance, financial activities, Business and Professional Services, and government.

Both the unemployment rate, at 4.4 percent, and the number of unemployed persons, at 7.1 million, changed little in April, says the BLS. But over the year the unemployment rate has declined by 0.6 percentage point, and the number of unemployed has fallen by 854,000.


That is progress, and probably why the Federal Reserve will raise rates again in June. It said in its FOMC press release of this week’s meeting that it left a key borrowing rate unchanged and dismissed a weak first quarter GDP growth as temporary, meaning it is still on track to raise interest rates at a gradual pace.
“The [Federal Open Market Committee] views the slowing in growth during the first quarter as likely to be transitory,” the statement said. Job gains were described as “solid,” as were the fundamentals underpinning the continued growth in consumer spending. Business fixed investment “firmed,” the central bank noted.
The number of persons employed part time for economic reasons (sometimes referred to as involuntary part-time workers) declined by 281,000 to 5.3 million in April. These individuals, who would have preferred full-time employment, were working part time because their hours had been cut back or because they were unable to find full-time jobs. Over the past 12 months, the number of persons employed part time for economic reasons has decreased by 698,000, a good sign.

That may be due to very strong growth in both the service and manufacturing sectors. The 16 non-manufacturing (service) industries reporting growth in April include Construction, Retail, Healthcare, Real Estate, Finance & Insurance. The only industry reporting contraction in April is Agriculture, Forestry, Fishing & Hunting.

And in manufacturing 16 of the 18 industries reported growth in April. All parts of the survey registered above 50 percent, meaning most sectors were expanding, signaling continued growth. “The New Orders Index registered 57.5 percent, a decrease of 7 percentage points from the March reading of 64.5 percent,” said the ISM Manufacturing report “The Production Index registered 58.6 percent, 1 percentage point higher than the March reading of 57.6 percent. The Employment Index registered 52 percent, a decrease of 6.9 percentage points from the March reading of 58.9 percent.”
So, business activity is still growing in most of the U.S. economy. Then why doesn’t’ this translate to higher economic growth? Q1 GDP expanded at just 0.7 percent, while Q4 2016 GDP growth wasn’t much better at 2.0 percent. The culprit was lower consumer spending in Q1.

There was a drop in exports, and increase in imports. In other words, consumers bought more from overseas that it produced in the U.S. So, consumers are spending, but it doesn’t help domestic production, and hence GDP growth, so that consumer spending rose just 0.3 percent for the most embarrassing annualized pace since 2009, said Econoday.


Unemployment is unusually low and consumer confidence unusually high making the results difficult to explain. The effect of seasonal adjustments are exaggerated during the winter and may very well be holding back the results. Yet even for a first quarter, this one was slow.

Harlan Green © 2017

Follow Harlan Green on Twitter: https://twitter.com/HarlanGreen

Friday, February 3, 2017

Yuge Payroll Jobs Gain Today

Popular Economics Weekly

The U.S. created 227,000 new jobs in January to mark the largest gain in four months, revealing an economy that has plenty of stamina nearly eight years into a recovery that shows little sign of ending. Retailers, construction firms, financial companies and restaurants led the way in hiring in January, the government said Friday.


The unemployment rate rose slightly to 4.8 percent last month, mostly because more people were looking for work, but there is a skills gap with most of the unemployed blue collar workers needing job retraining, rather than additional coal and manufacturing jobs the Trump team has promised and is hoping to generate. This is with job openings ear their record high (5.5 million) and that’s drawing a larger share of Americans back into the labor force.

And a tighter labor market is also forcing firms to pay more to workers, an emerging trend that’s likely to further underpin the recovery. In January, hourly wages rose 0.1 percent to $26 an hour. Over the past 12 months wages have climbed 2.5 percent—faster than the less than 2 percent annual gains that prevailed through most of the recovery.

What does this mean? Maybe some of those unfilled 5.5 million job openings will be filled. But only if the courts lift the immigration ban that will discourage the influx of skilled workers to fill those jobs, as the Trump administration seems caught in the grips of white nationalist wall-builders, at the moment (such as Breitbart’s Steven Bannon), who are very unskilled at writing Executive Orders, it seems.

One example is the chaos reigning over the immigration ban at the moment. The global confusion that has since erupted is the story of a White House that rushed to enact, with little regard for basic governing, a core campaign promise that Mr. Trump made to his most fervent supporters, reports the New York Times.

In his first week in office, Mr. Trump signed other executive actions with little or no legal review, but his order barring refugees has had the most explosive implications. Passengers were barred from flights to the United States, customs and border control officials got instructions at 3 a.m. Saturday and some arrived at their posts later that morning still not knowing how to carry out the president’s orders.

In the jobs report, there was a huge surge in retail payrolls (46,000), professional services (39,000), and construction jobs (36,000), signaling blue collar jobs are strong, with interest rates still near their record lows.


More big news was that the service sector is booming, though it dropped slightly in January. The ISM non-manufacturing, or service sector index "The NMI® registered 56.5 percent which is 0.1 percentage point lower than the seasonally adjusted December reading of 56.6.

Both prices and employment jumped 2.9 and 2.0 percent, respectively, again signaling a tighter labor market. The sector that includes Health Care & Social Assistance; Finance & Insurance; Public Administration; Accommodation & Food Services; Retail Trade; Construction; still reflects strong growth.
“This represents continued growth in the non-manufacturing sector at a slightly slower rate,” said Anthony Nieves, chair of the Institute for Supply Management® (ISM®) Non-Manufacturing Business Survey Committee. “Respondents' comments are mixed indicating both optimism and a degree of uncertainty in the business outlook as a result of the change in government administration."
So this uncertainty is another reason to cancel or modify Trump’s immigration ban, as it hurts more than the seven Muslim countries. Scientists worldwide are now cancelling their participation in US scientific conferences in protest.

Harlan Green © 2017

Follow Harlan Green on Twitter: https://twitter.com/HarlanGreen

Friday, January 6, 2017

156,000 Payroll Jobs, 4.7% Employment

Popular Economics Weekly


The highlight of the December unemployment report was that wages rose 2.9 percent annually. And nonfarm payrolls rose a lower-than-expected 156,000 in December but added a net 19,000 to the two prior months (November now at 204,000 and October at 135,000) in revisions, said the U.S. Bureau of Labor Statistics.

The unemployment rate rose slightly to 4.7 percent from 4.6 percent because 184,000 more jobseekers entered the workforce. The biggest job gains were in Education and health services (70,000), followed by Leisure and hospitality (24,000), and Manufacturing (17,000), which was a big surprise, according to consensus predictions.


But manufacturing’s employment surge shouldn’t be a surprise, as both the service and industrial sectors showed strong growth in December. The ISM manufacturing composite index hit 54.7, up a sharp 1.5 points from November for the best score in 2 years.

New orders were the clear highlight of the report, at 60.2 for another 2 year high and up 7.2 points which is the sharpest monthly jump of the entire cycle. The good news continues with production up 4.3 points to 60.3, employment up 8 tenths to 53.1, and export orders at 56.0 which is a 2-1/2 year high. The strength, like it was in the manufacturing PMI posted earlier on Tuesday, is being reflected in prices with input costs up 11.0 points to 65.5 which is a 5-1/2 year high.

Hiring in the December ISM non-manufacturing survey also showed that new orders are unusually strong where the index, at 57.2, matches November as 2016's best. New orders are up 4.6 points to 61.6 to signal the strongest rate of monthly growth since the middle of last year. Business activity is also very strong, at 61.4.

But the rise in interest rates may slow down growth in 2017, as Econoday reports the rise in the dollar is affecting export prices and a consequent slowdown in exports. The worst economic news of late comes from the international trade in goods report where the deficit widened sharply in November to $65.3 billion from October's $61.9 billion, reports Econoday. Goods exports fell 1.0 percent in the month to $121.7 billion as tracked in the blue columns of the graph. Food exports have been especially soft as have vehicle exports, and capital goods exports fell very sharply in a reminder that the lack of business investment is a global issue.


But business investment may rise, when and if tax reform happens for the $ trillons held overseas by U.S. corporations. The monies for the proposed $1 trillion in infrastructure improvements have to come from somewhere, and corporations may be induced to invest some of those profits domestically.

Harlan Green © 2016
Follow Harlan Green on Twitter: https://twitter.com/HarlanGreen

Friday, October 7, 2016

Motor Vehicle Sales Boost Retail, Manufacturing

Financial FAQs

One of the first hard indications on the September economy is strongly positive as overall unit vehicle sales surged 4.7 percent to a 17.7 million annualized rate. This will boost the vehicle component of the September retail sales report and also will give a lift to third-quarter GDP estimates, which are currently in the mid-two percent range.


Strength is centered in North American-made models where the rate rose 6.0 percent to 14.2 million for domestic sales. The strength ultimately reflects the health of the jobs market and will likely raise talk of strength in Friday's employment report.

And initial weekly jobless claims keep moving lower in what is definitive evidence of labor market strength. Initial claims in the October 1 week fell 5,000 to 249,000, breaking the 250,000 barrier for the second time this year, though the unemployment rate rose slightly to 5.0 percent and 156,000 new payroll jobs were created in September, according to the Labor Dept.

The 4-week average, 2,500 lower at 253,500, is down for a very convincing 7th week in a row, says Calculated Risk. Continuing claims are likewise moving lower, down 6,000 to 2.058 million in lagging data for the September 24 week. There are no special factors in today's report, one where all readings are at or near historic lows.

Both U.S. manufacturing and non-manufacturing activity picked up as well. largely due to the strength in vehicle sales, which means retail sales overall are healthy. ISM's manufacturing September index bounced more than 2 points higher to a much better-than-expected 51.5. New orders are the most important of all readings and they lead the September report, rising 6 points to a very solid 55.1.

 Export orders are also respectable and steady at 52.0 while the draw in total backlog orders slowed, with this index up 4 points and nearly hitting breakeven 50 at 49.5. Production also improved in the month, up 1.4 points to 52.8, as did employment which, at 49.7, is also nearly at 50. This is a positive report, pointing to rising though no more than moderate strength for the nation's factory sector.


 The ISM non-manufacturing composite index shot up to 57.1 from August's recovery low of 51.4 which now looks like a very odd outlier for this report which otherwise has been consistently strong this year. And new orders are especially strong, up nearly 9 points to 60.0 which points to brisk activity for other readings in the months ahead. Employment is also a very solid plus in the report, up 6.5 points to 57.2 which is the strongest rate of growth since September last year.

This is while the third estimate of Q2 Gross Domestic Product inched up to 1.4 percent from the prior 1.2 percent estimate, but Q3 should begin to show some strength, after 7 consecutive quarters of subpar growth.

Could it reach 3 percent?  Only if the Fed won't raise interest rates at all this year, as it will crimp manufacturing, which relies on lower export prices, which relies on a cheaper US dollar, which relies on the current interest rate low.

Harlan Green © 2016

Follow Harlan Green on Twitter: https://twitter.com/HarlanGreen

Wednesday, September 7, 2016

A Record In Job Openings

Financial FAQs

Not only are Nonfarm payrolls averaging some 200,000 jobs per month this year, but the Labor Department’s job openings and labor turnover survey showed 5.87 million openings, an all-time high, while hires increased to 5.23 million from 5.17 million in June. Businesses are creating jobs at a much faster rate than they can be filled, in other words.

The number of job openings are up 1 percent year-over-year. Quits are up 9 percent year-over-year. Quits are voluntary separations, which usually means workers must have found better paying jobs.


The number of people quitting jobs voluntarily was flat at 2.98 million, but that’s still up substantially from the depths of the recession, which signals more worker confidence in the ability to find another job, as I said.

Less heartening was yesterday’s ISM’s Non-Manufacturing (i.e., service sector) survey for July, down 4 points to 51.4. This is the lowest rate of composite growth for this sample of the whole cycle since February 2010. But that may be a fluke, as new orders in past months were as high as 60 percent. It could be a catch-up month, in other words, as businesses sell off past months’ inventories.

Graph: Econoday

This should also keep the Fed from raising interest rates until at least December, since the jobs report of last week was a letdown, as well. The composite score is no fluke, says Econoday, with new orders for service sector products falling nearly 9 points to 51.4 for their lowest score since December 2013. New export orders are a particular disappointment, also down a steep 9 points and in contraction at 46.5 which is also the lowest score since December 2013. And backlog orders are also in contraction, down 1-1/2 points to 49.5.

Moody’s Investors Service, the bond rating firm, doesn’t see this lull as more than a blip, at least. The U.S.’s Aaa credit rating is safe no matter who wins the presidential election, according to Moody’s in a new report on Wednesday.
“The outcome of the forthcoming presidential election will not impact the Aaa stable credit rating of the United States, regardless whether Donald Trump or Hillary Clinton is elected,” the report says. “This is because the U.S.’s rating reflects the country’s very high degree of economic, institutional and government financial strength and its very low susceptibility to event risk,” says Moody’s, naming the four factors in its sovereign bond rating methodology.
What to make of the current weakness? It could be a summer lull, as businesses wait for the results of Brexit negotiations, the Presidential election, and maybe even China’s growth to resume.

Harlan Green © 2016

Follow Harlan Green on Twitter: https://twitter.com/HarlanGreen

Friday, August 5, 2016

255,000 Payroll Jobs, Economy Still Growing

Financial FAQs

Total nonfarm payroll employment rose by 255,000 in July, and the unemployment rate was unchanged at 4.9 percent, said the U.S. Bureau of Labor Statistics today. This confirms earlier reports from the manufacturing and service sectors that economic activity is strong.


It was a big surprise, as the change in total nonfarm payroll employment for May was revised from +11,000 to +24,000, and the change for June was revised from +287,000 to +292,000. Over the past 3 months, job gains have now averaged 190,000 per month.

So the US economy is much stronger than previously thought, in spite of the Brexit vote and European disunity over immigration. More than 400,000 additional workers entered the workforce, which kept the unemployment rate at 4.9 percent. Even governments added 38,000, in a sign that government spending is healthy again.

Job gains also occurred in professional and business services, health care, and financial activities. Energy was the only sector where employment continued to decline.  For instance, professional and business services added 70,000 jobs in July and has added 550,000 jobs over the past 12 months, said the report.

This is while the just reported ISM's non-manufacturing (i.e., service sector) composite index did slip 1.0 point to 55.5 but new orders rose in July, up 4 tenths to 60.3 for the best showing since October last year.


The ISM’s Manufacturing survey was also strong, though employment fell slightly as did delays in delivery times (which means less congestion, hence traffic). The July ISM index dropped to 52.6 vs June's 53.2. But the important news is once again, the new orders index, at 56.9 and pointing to future strength for employment.

Both reports showed continued growth, especially in new orders. So why the just reported weak GDP growth estimate in the second quarter of 1.2 percent, after even weaker 0.9 and 0.8 percent upticks in the last 2 quarters?
JP Morgan Chase President Jamie Dimon points to lack of public works spending, and timid private sector investing. “Dimon said the U.S. needs to focus more on long-term economic prospects, namely in the areas of immigration reform; proper infrastructure spending on roads, schools, and airports; and focusing on corporate tax reform as well as expanding the earned-income tax credit,” in a recent CNBC interview.
In fact, he believes GDP growth could increase to 4 percent, if such projects were funded. The energy slump is also a major reason, with oil prices back down to $40 per barrel. But this has boosted consumer spending and kept inflation low, as consumers account for some 70 percent of economic activity.

Factory orders aren’t yet reflecting this surge in new orders, as orders fell a sizable 1.5 percent in June following a downward revised 1.2 percent decline in May. Core capital goods (nondefense ex-aircraft) have been especially weak though orders did rise 0.4 percent in June. Shipments for this category, however, slipped 0.2 percent following a downward revised 0.7 percent decline in June in readings that will not boost revision estimates for second-quarter GDP.

So these results point to stronger GDP growth in the fall, and maybe into next year and a new President. Let us hope so, as both candidates have promised more public works projects, which should push the private sector to spend some of their huge and unspent profits for productive purposes, as well.

Harlan Green © 2016

Follow Harlan Green on Twitter: https://twitter.com/HarlanGreen