Showing posts with label durable goods orders. Show all posts

Tuesday, November 8, 2022

We Have A Soft Landing (if the Fed is listening)

 Financial FAQs

FREDdurablegoods

After four consecutive 0.75 percent rate hikes, the Fed should slow down its rate increases, say at least three Federal Reserve Governors. That is good news as we try to assess the likelihood of another recession.

It’s good news because there are already signs of a possible soft landing in 2003, if the Fed will take their foot off the economic brakes until there is more certainty of its tightening efforts down the road.

Reuters quotes the Chicago Fed’s Charles Evens (San Francisco and Richmond Fed Presidents also advocate slowing) that it is time for the Federal Reserve to shift to smaller interest rate hikes to avoid tightening monetary policy more than needed and slow the pace further once risks become more "two-sided," (i.e., a possible recession) Chicago Fed President Charles Evans said on Friday.

"From here on out, I don't think it's front-loading anymore, I think it's looking for the right level of restrictiveness," Evans told Reuters in an interview, referring to the U.S. central bank's string of supersized rate hikes.

If the Fed did nothing more this year, we could have a ‘soft landing’ since growth is already slowing in both the manufacturing and service sectors of our economy.

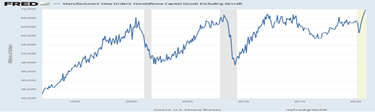
New orders for factory goods are down, for instance (see top line in above FRED graph from 2/92) and holding at a lower level of activity. Orders for manufactured goods rose 0.3 percent in September, the Commerce Department said last Thursday, and orders have risen eleven months of the past year. The factory sector led the economy’s recovery from the pandemic because of huge pent-up demand for things like automobiles and other durable goods after the pandemic.

The ISM’s manufacturing index is now close to breakeven. The S&P global U.S. manufacturing PMI inched up to 50.4 in its “final” reading in October from the “flash” reading of 49.9. This is down from a reading of 52 in September.

“The U.S. manufacturing sector continues to expand,” said ISM Chair Timothy Fiore, “but at the lowest rate since the coronavirus pandemic recovery began. With panelists reporting softening new order rates over the previous five months, the October index reading reflects companies’ preparing for potential future lower demand.”

The Institute for Supply Management (ISM) serviced sector (non-manufacturing) Index that measures conditions at companies such as retailers and restaurants fell to 54.4 percent in October and touched the lowest level since the U.S. lockdowns in 2020, pointing to a slowing U.S. economy. A number above 50 signals expansion; but settling in a more normal range typical of a slower growing economy.

Granted this is before the Fed’s latest rate hikes take hold that could reduce the demand for goods and services even further, Consumer borrowing that is reported by the Fed is a better indicator of consumer wherewithal, since they wouldn’t be shopping as much as they have been if they fear an imminent recession.

Consumercredit

Consumer credit has been declining slowly, but again it is back to more normal pre-pandemic levels (see above Fed chart from 1/04). Revolving credit, like credit cards, rose 8.7 percent in September, less than half of the 18.1 percent gain in the prior month. Nonrevolving credit, typically auto and student loans, rose 5.7 percent, up from a 4.5 percent growth rate in the prior month. This category of credit is much less volatile.

The growing danger is to continue to tighten while there are still shortages of food and energy supplies, while demand is already shrinking in the rest of the world.

China’s economic woes are one example. Reuters reports “China's exports and imports unexpectedly contracted in October, the first simultaneous slump since May 2020, as a perfect storm of COVID curbs at home and global recession risks dented demand and further darkened the outlook for a struggling economy.”

The San Francisco Fed has also flagged the danger with its own published research that suggests we have already tightened too much. U.S. monetary policy is tighter than the Federal Reserve's policy rate suggests, according to research published Monday by the San Francisco Fed, with financial conditions by September 2022 reflecting the equivalent of a 5.25 percent policy rate, which it the top boundary of Chairman Powell’s own prediction.

"Accounting for the broader stance of policy and comparing the proxy rate to simple rules suggests U.S. monetary policy tightened sooner and more sharply than has been generally recognized," the Letter said.

Given what could be a brutal economic winter for much of the world, and demand maybe reaching parity with supply so that risks become more "two-sided" in Chicago Fed President Charles Evans words, we may now see a more benevolent Federal Reserve and enjoy the possibility of a soft landing.

Harlan Green © 2022

Follow Harlan Green on Twitter: https://twitter.com/HarlanGreen

Wednesday, February 3, 2021

Q4 GDP Growth Weakens

 Popular Economics Weekly

Calculated Risk

This Real Gross Domestic Product graph dating from 1959 shows that the US economy in 2020 had its worst contraction since the end of World War II. No surprise given we have the worst COVID-19 infection rates and death totals in the world.

But that doesn’t dim predictions of economists for a ‘Roaring '20's’ recovery this year that matches the recovery from the Spanish flu pandemic of 1918-19, if we get the economic aid that harks back to a more progressive, New Deal, era when government was the solution.

It has taken the coronavirus pandemic to end 40 years of trickledown economics, a Gilded Age that benefited corporate owners rather than their workers. Raising the minimum wage, childcare payments, and aid to state and local governments will benefit those lower-paid, essential workers that are not in the surging stock and bond markets.

The advance estimate of real fourth quarter GDP was 4 percent when adjusted for inflation after the record Q3 jump of 33 percent. But overall GDP still shrank by 3.5 percent last year due to the pandemic shutdowns, which gives an inkling of the task ahead for President Biden in crafting a recovery plan from the worst pandemic in 100 years.

Economist James K. Galbraith said recently in Project-Syndicate, “Biden has correctly billed his plan an “American Rescue Plan,” rather than as a “recovery” or “stimulus” program. If successful, the package will stem the pandemic, stave off a variety of social calamities, and prevent the collapse of state and local government services. Economic reconstruction is important; but it is a separate objective that can be advanced in a second package.”

Biden is asking for $1.9 trillion just to rescue the American economy. If Democrats can pass it without too many cuts, as well as an infrastructure bill that will create millions of new jobs, economic forecasters are predicting even higher GDP growth this year—upwards of 5 to 6 percent.

The New York Fed’s Nowcast predicts a 6.5 percent jump in 2021 Q1 growth. Most of it the prediction comes from an increase in manufacturers’ production and inventories of durable goods, which have been building as nondefense capital goods orders are on a tear, reports the US Census Bureau.

FREDdurablegoods

Businesses are ramping up investments in capital goods that will ensure future growth. Business orders for durable goods such as tools, appliances and new cars rose in December for the eighth month in a row, which should mean a stronger U.S. economic rebound this year.

Why the optimism when Republicans resisted new spending on anything but tax cuts, border walls and defense over the past four years? The COVID-19 pandemic has brought this Gilded Age to a crashing halt, as I said.

The party of Roosevelt won the election with the massive support of younger generations that want what citizens of the other developed countries enjoy—universal health care, a higher minimum wage, better social services, public education, paid vacations—the list goes on and on.

It might even reduce the social unrest and red vs. blue state polarization that has endangered American democracy!

Harlan Green © 2020

Follow Harlan Green on Twitter: https://twitter.com/HarlanGreen

Sunday, April 7, 2019

March Job Creation Still Exceeds Population Growth

Popular Economics Weekly

Stanford economist and Former Chief Economic Advisor Ed Lezear said last week on CNBC that job creation still exceeds population growth, which is a sign the US economy continues to expand, but at a slower rate, as shown in the BLS March unemployment report on Friday.
“Total nonfarm payroll employment increased by 196,000 in March, and the unemployment rate was unchanged at 3.8 percent, the U.S. Bureau of Labor Statistics reported today. Notable job gains occurred in health care and in professional and technical services.”
February was revised slightly up to 33,000 instead of the 20,000 initial nonfarm payroll total, also an encouraging gain that hints growth in the economy might be picking up again. Hiring increased in most major segments of the economy, most notably health care and white-collar firms. The flush of new jobs kept the unemployment rate near a 50-year low, the Labor Department said.


Health-care and Educational Service providers led the way again, adding 70,000 jobs. Health-care has boosted hiring by almost 400,000 in the past year. Professional and technical firms hired 34,000 workers, restaurants increased staff by 27,000 and construction companies took on 16,000 new workers. A month earlier, builders cut employment by the most in a year and a half during a spell of severe cold and heavy snowfall.

But manufacturers trimmed 6,000 jobs after barely any gain in February. And retailers eliminated 12,000 jobs. The manufacturing losses seem to be coming from uncertainty over the prolonged trade negotiations with multiple countries. Manufacturers are complaining about the rising price of imported parts from tariffs that make their finished products more expensive.


Another sign of a manufacturing activity slowdown was the decline in February Durable Goods Orders reported earlier this week. There was a cooling for aircraft orders, so that durable goods orders fell -1.6 percent with the ex-transportation reading very low at just a 0.1 percent gain.

Orders for core capital goods also fell -0.1 percent (ex-aircraft and autos), which are factory-produced tools, buildings, vehicles, machinery and equipment that increase future growth and productivity. The fact that orders have dropped below 5 percent annually when maintaining more than 6 percent annual growth the past 2 years is a definite sign of slowing activity.

But the 3-month 180,000 payroll hiring average is more than needed to employ the lower number of working-age adults entering the workforce. The workforce participation rate of 60.6 percent is also healthy, and governments have helped by adding 19,000 jobs since January.
MarketWatch reports another plus for economic growth. “Motor vehicle sales reached a seasonally adjusted annual rate of 17.45 million in March, up from 16.57 million in February, according to data from Autodata. That’s the highest reading in three months and represents a recovery from a downbeat start to the year. The MarketWatch-compiled consensus expectation was for a 16.8 million rate.”
What’s not to like about the unemployment report? Employers are paying more, and even willing to retrain workers to fill the skilled-worker void. The housing market has also picked up with record-low interest rates holding. The Mortgage Bankers Association reports refinance applications jumped 39 percent last week.

Harlan Green © 2019

Follow Harlan Green on Twitter: https://twitter.com/HarlanGreen

Wednesday, October 25, 2017

Boom Times for Manufacturing

Popular Economics Weekly

A measure used by economists to track investment, known as core capital orders (minus defense and aircraft), rose 4 percent in the 12 months ended in September. It has risen 1.3 percent for three consecutive months, according to the Commerce Department.

Core orders are spent domestically for the most part, so this is happening just when it’s needed—to rebuild the hurricane and wildfire damaged states of Florida, Texas, California, as well as U.S. Territories of Puerto Rico and the Virgin Islands.

Graph: FRED

It will also boost economic growth, since it boosts labor productivity, one of the two components that determine GDP growth. The other component is population growth, but the U.S. population is barely growing, as is immigration that supplies the majority of new workers.

The main beneficiary of higher capex spending will be manufacturing, which is already showing improvement with a cheaper dollar exchange rate that has boosted exports.


And today we have durable-goods orders that rose 2.2 percent in September, beating forecasts. Durable goods are all goods that last three or more years—including auto vehicles, defense and aircraft. These orders have climbed 7.8 percent in the past year, the fastest pace since early 2012.
“Strength in the manufacturing sample is centered in new orders and employment,” says Econoday. “Of special note are unusual delivery delays, which help lift the composite indexes and are the result of lingering disruptions and stretched workloads following Hurricanes Harvey and Irma.”
So we are seeing effects of the hurricanes in boosting economic activity. The role of capital expenditures is especially important, as it means the replacement of much of our aging infrastructure as well.

And don’t forget at least 1 million motor vehicles were destroyed by the hurricanes that will need to be replaced. But buyers shopping for used replacement vehicles should be aware of the pitfalls of those storm-damaged cars that are put back on the market.

Consumers should take precautions like getting a history of repairs and checking the VIN number in the National Insurance Crime Bureau and National Motor Vehicle Title Information System databases, reports Fortune Magazine. Even without a database, strange stains and smells can be a red flag that a car has weathered a flood. Consumers buy a used car should check for signs of water damage — mineral deposits, mildew and the smell of mold or overpowering scents of cleaning supplies that may be trying to mask it.

Harlan Green © 2017


Follow Harlan Green on Twitter: https://twitter.com/HarlanGreen
Thursday, March 2, 2017

2017 Manufacturing Off To Good Start


Popular Economics Weekly

What is happening with manufacturing? The ISM manufacturing index jumped 1.7 points in February to a 57.7 level that beats the consensus by 1.3 points. This is the strongest rate of monthly growth in composite activity since August 2014. So does it mean Trump can keep his promise of bringing back those blue collar jobs lost to the likes of China?

It’s in spite of higher dollar exchange rates that have boosted consumer spending because of cheaper import prices, which dropped GDP growth in Q4 and the year, to 1.9 percent. (Import sales subtract from GDP growth.) So what gives? Is it the Trump euphoria over his promise to cut taxes and regulations?

The report in fact is filled with superlatives led by a 4.7 point jump in new orders to 65.1. This rate of monthly growth was last matched in December 2013 and last exceeded in August 2009. Backlog orders jumped 7.5 points to 57.5 in a reading last exceeded in March 2014. Production is also very strong, up 1.5 points to a 62.9 level that is the best since March 2011.This is while consumer confidence index continues to make new post-election highs and new cycle highs at a 114.8 February level, which beats consensus estimates and makes for a strong 3.2 point gain from January.

But beware, says Econoday, “This report perhaps is the greatest expression yet of post-election strength in anecdotal surveys, strength that has yet however to find its way to actual government data on the factory sector which have been consistently soft.”

The data includes just released auto sales, softer at 17.5 million units. Wrightson ICAP had estimated a seasonally adjusted annualized sales pace of 17.7 million.  That would still be a little below the December/January average of 17.9 million, but would represent an increase of roughly 1 percent in both month-to-month and YOY terms.  And it would be about 1.4 percent above the actual 2016 total of 17.46 million, which was a record high.


Then there is the January durable goods report for items that last 3 or more years. It shows the usual volatility behind which are sagging numbers for key readings, said Econoday. Aircraft, both domestic and defense, skewed durable goods orders sharply higher in January, up 1.8 percent to hit the consensus. Not hitting the consensus, however, are orders that exclude aircraft as well as all other transportation equipment. This reading fell 0.2 percent to come in well below Econoday's low estimate for a 0.2 percent gain.

The worst news in the report is a 0.4 percent decline in orders for core capital goods (nondefense ex-aircraft). This ends 3 months of strength for this reading and pulls the rug out from expectations for a first-quarter business investment boom as indicated by business confidence readings.

And longer term investments happen when core capital expenditures are on the increase. So will the manufacturing boom continue?

Harlan Green © 2017


Follow Harlan Green on Twitter: https://twitter.com/HarlanGreen

Monday, January 30, 2017

Q4 GDP Slightly Lower—How About 2017?

Financial FAQs

Fourth quarter Gross Domestic Product growth slowed, mostly because of the strong dollar and weak foreign demand. But consumers held up their end with higher consumer sentiments, and businesses also began to invest in new plants and equipment again.

One reason for the weakness is surging domestic demand for imported goods, because consumers are buying lots of goods and services. So all-in-all, the U.S. economy is doing very well, with interest rates still low and domestic demand still strong.


Gross domestic product, the official score card for the economy, expanded at a 1.9 percent annual clip from October to December, the Commerce Department said. That’s a marked drop from a 3.5 percent growth rate in the third quarter and below the 2.2 percent consensus of Bloomberg. The drop was mainly because of lower exports (strong dollar) and higher imports, which are a subtraction in the calculation of GDP, increased.

Still, the increase in real GDP in the fourth quarter reflected positive contributions from personal consumption expenditures (PCE), private inventory investment, residential fixed investment, nonresidential fixed investment, and state and local government spending.

And we have soaring consumer sentiment, as the University of Michigan Consumer Sentiment survey is now at 98.5 in January, at the cycle highs where it's been since the November election. Prospects for future income are the highest in a decade, though the sample is split between optimism among Republicans offsetting pessimism among Democrats. One fifth of the sample says it's a good idea to borrow in advance of possible rate increases, a 20-year high for this reading.


But the real hero of the week was durable goods orders for goods lasting more than 3 years, such as auto, appliances and aircraft. Even though December orders, pulled down by a swing lower in defense aircraft, slipped 0.4 percent, core capital goods orders rose 0.8 percent which is on top of an upward revised 1.5 percent gain in November.


This is the sign of the increase in sorely needed business investment in plants and equipment that will be needed to increase productivity and so economic growth in 2017. Year-on-year core capital goods orders (nondefense ex-aircraft) moved into the plus column for the first time since October 2015, at 2.8 percent to exceed total orders at 1.2 percent.

The graph tracks monthly dollar levels of core capital goods (at $64.5 billion in December) against all other durable goods (at $162.5 billion). This swing higher for capital goods has contributed to three straight quarters of gains, though small ones, for nonresidential investment in the GDP report. But progess is progess, says Econoday.

So we can only hope that President Trump doesn’t start too many trade wars, such as with Mexico, our third largest trading partner, if GDP growth is to improve from the past decade. For most of our exports and core capital goods depend on parts made elsewhere. We have a worldwide interconnected economy in other words that a trade war could harm greatly.

Harlan Green © 2017

Follow Harlan Green on Twitter: https://twitter.com/HarlanGreen

Friday, June 3, 2016

Should the Fed Raise Rates?

Financial FAQs

It’s incredible that Janet Yellen’s Fed should even be talking about raising interest rates in June, or July. The Fed predicts no more than 2.5 percent GDP growth in Q2, after Q1’s 0.8 percent growth rate. And the May unemployment report was the worst since 2010 with just 38,000 nonfarm payroll jobs created.
“It’s appropriate -- and I’ve said this in the past -- for the Fed to gradually and cautiously increase our overnight interest rate over time,” Yellen said last Friday during remarks at Harvard University in Cambridge, Massachusetts. “Probably in the coming months such a move would be appropriate.”

 
Really? Most industries cut jobs last month, the first time that’s happened in several years. The increase in hiring was also the smallest since the fall of 2010. Economists polled by MarketWatch had predicted an increase of 155,000 nonfarm jobs.

This is though the unemployment rate fell to 4.7 percent from 5 percent to mark the lowest level since the month before the Great Recession began in December 2007. But the decline owed almost entirely to 458,000 people leaving the labor force.

Adults over 25 without a high-school diploma accounted for about two-thirds of the drop in the labor force, about 10 times the impact they should have had given their share of the population. More than half of those who dropped out were people over 55 years old. Most of them were white and likely Trump supporters.

What is the Fed and Yellen thinking? Inflation expectations are way down, as well as consumer sentiment; one of their red flags for incipient, future inflation that Fed hawks love to cite in their push to raise interest rates (read the banking lobby).


Graph: Econoday

The expectations component for future business looks better, up 7.3 points from April to 84.9, and that ultimately reflects confidence in the jobs outlook. But the 1-year inflation outlook fell another 1 tenth at month's end to 2.4 percent for a major decline of 4 tenths from April. Like the decline underway in business investment, the decline in inflation expectations could also derail chances for a June hike.

The real problem is the severe drop in capex, or capital expenditures, due in large part to declining oil production. Without business investment, jobs cannot continue to grow and full employment should be the primary goal of Fed policy, rather than fighting non-existent inflation.

A historical rule of thumb is that 2 percent inflation rate means 2 percent growth, whereas 3 percent inflation usually means 3 percent plus growth, and we should be shooting for a 3 percent plus growth rate, as in past decades.

This is while new orders for core capital goods, a reading that excludes defense goods and commercial aircraft, fell a very sharp 0.8 percent in data for the month of April. It is the third straight decline and the fifth out of the last six months in a string that has taken this reading to a five-year low. Year-on-year, orders are squarely in the negative column at minus 5 percent and are down 12 percent from their cycle peak in September 2014.

We need to encourage a bit more inflation, in other words, which in turn should improve profits and so encourage more job creation.

Harlan Green © 2016

Follow Harlan Green on Twitter: https://twitter.com/HarlanGreen

Tuesday, March 1, 2016

Higher Wages, Consumer Spending, Mean Higher Growth


Q4 GDP growth was just revised upward to 1.0 percent, from the 0.7 percent first estimate.  This, January’s personal income figures and durable goods orders show consumers and even parts of the manufacturing sector are still expanding, which is a good start for 2016 growth, vs. last January, when the severe winter stopped almost all growth in Q1.

           
Median annual household income rose 0.7 Percent in November, or $57,173, according to a just released Sentier Research report. It was in November that incomes finally surpassed the $56,698 median seen at the onset of the Great Recession. Why is this important?
“We have recaptured all of the income losses that have occurred since the beginning of the last recession in December 2007,” said Sentier’s Gordon Green, a former U.S. Census Bureau official.  And incomes are now up 0.4 percent from where they stood in January 2000—the month that Sentier Research began tracking this data.
Personal income jumped 0.5 percent in January as did consumer spending, both readings higher than expected. Also higher than expected are the report's inflation readings especially the core PCE which rose 0.3 percent for a year-on-year plus 1.7 percent.  Rising inflation is also a sign of higher profits, hence higher growth.
And the factory sector bounced back strongly in January, indicated first by last week's industrial production report and now by durable goods orders which are up a very strong 4.9 percent. Aircraft did add to the gain but when excluding transportation equipment, durable orders still rose 1.8 percent. And core capital goods orders, which had been weakening, bounced back strongly with a 3.9 percent gain.

 
Machinery posted big gains in the month especially for new orders as did computers and fabricated metals. Motor vehicles showed strength in both orders and shipments.  Total shipments jumped 1.9 percent in the month, though shipments of core capital goods, held down by prior weakness in orders, fell 0.4 percent to open the first quarter on a down note, says Econoday.
But a positive in the report is a 0.1 percent dip in inventories which, together with the rise in shipments, pulls down the inventory-to-shipments ratio to a leaner 1.64 from 1.67. And unfilled orders, after contracting sharply in December, inched 0.1 percent ahead in January.
Wages and salaries are now rising at 4.5 percent year-over-year.  It is the most important number to look at in the personal income statistics, because it is the major reason consumers are spending more after a year of saving from lower gas prices.  These salary earners make up 80 percent of our workforce, which is sure to boost GDP growth above 3 percent this year, as we have been saying.

Harlan Green © 2016

Follow Harlan Green on Twitter: https://twitter.com/HarlanGreen

Tuesday, May 5, 2015

More Jobs On the Way

Popular Economics Weekly

It looks like the April unemployment report out on Friday could be gangbusters. Not only because U.S. winters have been so severe of late, and job formation abnormally low. But because manufacturing jobs in particular are returning to US.

Sixty thousand manufacturing jobs were added in the U.S. in 2014, versus 12,000 in 2003, reports Marketwatch, either through so-called reshoring, in which American companies bring jobs back to the U.S., or foreign direct investment, in which foreign companies move production to the U.S., according to a study from the Reshoring Initiative. In contrast, as many as 50,000 jobs were “offshored” last year, a decline from about 150,000 in 2003.

One reason is our increased cost competitiveness, with lower oil and gas prices reducing energy costs, and wages rising in Asia as their consumers move into the middle class. Also our booming service sector—April’s ISM non-manufacturing index just rose to 57.8 from 56.5 percent—has increased our demand for goods and services. These are service sector products and services that can only be consumed domestically, and so durable goods made for them would be cheaper if produced closer to home, with the aforementioned factors.

image

Graph: Econoday

New Orders are very strong, at 59.2, as are backlog orders, at 54.5 which is unusually strong for this reading. Strong orders point to future hiring which is already very strong, at 56.7. The percentages are a measure of optimism or pessimism. When more than 50 percent of respondents report positive results in all these areas, then service sector is expanding.

Among the world’s top 10 export economies, the U.S. last year ranked No. 2 — behind only China — for cost competitiveness, according to the Boston Consulting Group, with real estate and natural gas and other energy prices tending to apply downward cost pressure in the U.S.

CEO Jeff Immelt of GE has said the U.S., on a relative basis, has never been more competitive. For instance, he’s said it takes three hours or less to make a refrigerator, so the total cost can be lower to have it made domestically versus in China or Mexico when factoring in other costs including transportation.

Secondly, the Labor Department’s latest JOLTS report showed the highest number of job openings since January 2001. The latest Job Openings and Labor Turnover Survey reported 5.13 million job openings in February,

image

Graph: Calculated Risk

The number of job openings (yellow) is up 23 percent year-over-year compared to February 2014. Quits are up 10 percent year-over-year. These are voluntary separations. (see light blue columns at bottom of graph for trend for "quits"). It means an improving jobs market, since workers are increasingly willing to leave their current jobs for better jobs elsewhere.

The employment picture is also better with small business that creates a majority of domestic jobs, as the NFIB, National Federation of Independent Businesses, have reported steadily increased employment in 2014, though 2015 is showing a slight drop in business optimism, probably due again to winter.

The net percent of owners reporting an increase in employment fell 5 percentage points to a net negative 1 percent of owners, said the NFIB, down substantially from the recent high of 9 percent in December 2014. Fifty percent reported hiring or trying to hire (down 3 points), but 42 percent reported few or no qualified applicants for the positions they were trying to fill. 

Ten percent reported using temporary workers, down 2 points. Twenty-four percent of all owners reported job openings they could not fill in the current period, down 5 points from February which was the highest reading since March, 2006. A net 10 percent planning to create new jobs, down 2 points but a solid reading.

Overall the economy will keep moving forward, but more like a turtle than a hare. Bad weather was certainly depressing and Washington politics remains focused on issues that have little bearing on the current economy,said Bill Dunkelberg, NFIB Chief Economist

The bottom line is there are more available job openings than ever, and wages and salaries are beginning to grow above the inflation rate. This is a sure sign of a virtuous circle. Increased household incomes means more demand for products, which creates more jobs, which in turn creates even more demand. This is how economies growth.

Harlan Green © 2015

Follow Harlan Green on Twitter: https://twitter.com/HarlanGreen

Thursday, June 30, 2011

Consumers On the Rebound

Popular Economics Weekly

Maybe it’s Spring? Consumers must be feeling better, since they are able to pay down their debt load, while spending more. Personal consumption and even pending real estate sales are up in May-June, while mortgage delinquencies continue to fall.

Mortgage delinquency rates peaked at 10.97 percent in December 2009, and have been falling steadily since, though foreclosures have not been declining. That’s because lenders are every so slowly working through their backlog of seriously delinquent mortgages—those more than 6 months in arrears. Both delinquencies and foreclosure levels are still far above the historical rates of 4 percent and 1 percent of all mortgages, respectively.

clip_image002

According to Lenders Processing Services (LPS), 7.96 percent of mortgages were delinquent in May, down slightly from 7.97 percent in April. LPS also reports that 4.11 percent of mortgages were in the foreclosure process, down from 4.14 percent in April. This gives a total of 12.07 percent that are delinquent or in foreclosure.

The Pending Home Sales Index put out by the National Association of Realtors, a forward-looking indicator based on contract signings, rose 8.2 percent to 88.8 in May and is 13.4 percent higher than in May 2010. The data reflects contracts but not closings, which normally occur with a lag time of one or two months.

“Absorption of inventory is the key to price improvement, and this solid gain in contract signings implies that home values in many localities are or will soon be stabilizing as inventories get absorbed at a faster pace,” said NAR chief economist Lawrence Yun. “Some markets have made a rapid turnaround, going from soft activity to contract signings rising by more than 30 percent from a year ago, including areas such as Hartford, Conn.; Indianapolis; Minneapolis; Houston; and Seattle.”

Consumers also continue to shop. Retail sales on a year-ago basis in May came in at 7.7 percent, compared to 7.3 percent the month before.  Excluding motor vehicles, sales increased a huge 8.2 percent, up from 6.8 percent a year ago in April.

clip_image004

When will businesses begin to spend their cash hoard? Only when so-called effective demand picks up, and that won’t happen until more debt is paid down. All household debt including mortgages still totals more than 100 percent of household assets. That is why demand is still relatively weak across the board, whether for durable goods (that last more than 3 years), or services. This means incomes have to substantially increase as well.

clip_image006

The good news is that increases in durable goods orders for the latest month were broad-based by industry.  Transportation led the way with a monthly 5.8 percent jump, following a 9.4 percent drop in April.  The swing in both months was largely nondefense aircraft (Boeing) which surged 36.5 percent in May after a 29.0 percent fall the month before.  Defense aircraft rebounded 5.5 percent after a 0.4 percent dip.  However, the auto industry appears to still be suffering from supply shortages.  Motor vehicles edged up only 0.6 percent, following a 5.3 percent fall in April.

Household net worth, the best measure of financial health, is also improving, as we said last week. It is at 370 percent, above the long term average of 350 percent, according to the Federal Reserve’s latest Flow of Funds report, while the personal savings rate is hovering around 5 percent, meaning that consumers are saving enough to continue to pay down their debts.

The Federal Reserve Bank of San Francisco also believes that corporations won’t open their pocketbooks until household debt levels decline further. “If the main problems facing businesses relate to depressed consumer demand due to a household sector weighed down by debt, investment tax subsidies and lower interest rates may have a limited effect on business investment and employment growth,” said a recent SFFRB report. “The evidence is more consistent with the view that problems related to household balance sheets and house prices are the primary culprits of the weak economic recovery.”

clip_image008

One would think higher corporate profits should mean corporations will eventually have to hire more workers, if they want to stimulate future demand for their products and services. Higher profits also mean a lower price-to-earnings ratio for stock values (earnings being the denominator in the P/E ratio), which has been hovering around 15:1 for the S&P 500 largest corporations of late. And a P/E ratio below 15:1 has historically boosted stock prices. So this new report should give a boost to stock prices for the rest of the year, but what will corporations do with the proceeds, other than using it for stock buybacks and cash bonuses to its executives? Creating more jobs is another story.

Harlan Green © 2011