Wednesday, July 24, 2013

New Home Sales Surging—First-timers Being Priced Out?

Financial FAQs

New-home sales are surging, reports the U.S. Census Bureau. But who is buying them with interest rates up 1 percent since Chairman Bernanke made his infamous remark that QE3 bond buying could begin to slow in September? The damage has already been done for middle-income buyers with mortgage applications plunging, though interest rates have moderated. The conforming fixed rate is back to 4.25 percent with zero origination points cost in California. This has caused housing affordability to decline for many buyers, though still up for the year.

Sales of new single-family houses in June 2013 were at a seasonally adjusted annual rate of 497,000, according to estimates released jointly today by the U.S. Census Bureau and the Department of Housing and Urban Development. This is 8.3 percent above the revised May rate of 459,000 and is 38.1 percent above the June 2012 estimate of 360,000.

clip_image002

Graph: Calculated Risk

Months of supply is also shrinking, with the seasonally adjusted estimate of new houses for sale at the end of June just 161,000. This is a supply of 3.9 months at the current sales rate.

clip_image004

Graph: NAR

This is while mortgage applications have been falling, as we said, although purchase applications are up for the year. The culprit is that real incomes have not been rising enough to overcome higher mortgage rates. In fact, incomes have been rising at the slowest rate since World War II. Average household incomes have declined 10 percent just since 2000.

The National Association of Realtors, reports that affordability has declined 18 percent since January, hitting 172.7 in May, but is 17 percent above its average over the past decade. A reading of 100 means that a household with median income would have exactly enough income to qualify for buying a median-priced existing single-family home

NAR chief economist Lawrence Yun said many areas are experiencing a seller’s market.  “The supply/demand balance is clearly tilted toward sellers in a good portion of the country,” he said.  “Inventory conditions are expected to remain fairly constrained this year, so overall price increases should be well above the historic gain of one-to-two percentage points above the rate of inflation.  If home builders can continue to ramp up production, then home price growth is expected to moderate in 2014.”

So the question is will mortgage rates continue to climb, or has Chairman Bernanke realized his mistake in prematurely talking rates higher without any real evidence that the overall economy is indeed recovering?

Harlan Green © 2013

Follow Harlan Green on Twitter: www.twitter.com/HarlanGreen

Tuesday, July 23, 2013

Inflation Is Not The Problem

Popular Economics Weekly

All the talk that QE3 is about to end centers on when the Fed believes inflation will become a problem. Fed Chairman Bernanke doesn’t believe inflation will be a problem, as long as wages aren’t growing. And wages can’t even keep up with inflation at present, as he said in his latest congressional Q&A.

“There's a distinction between prices being high and prices rising...(cost of living) isn't going up, it's high, it's not going up. In other words, real wages are going down because even though inflation is very low wages have been growing slower than inflation.”

clip_image002

Graph: Econoday

This is substantially below the Fed’s target inflation rate of 2 to 2.5 percent, which is the level that shows sustained economic growth, according to the Fed. The reason for the spike in monthly CPI was energy prices, and the summer driving season. By major components outside the core, energy spiked 3.4 percent, following a partial rebound of 0.4 percent in May.  Gasoline surged 6.3 after no change in May.  The food component rebounded 0.2 percent, following a dip of 0.1 percent in May.

The Conference Board’s Index of Leading Economic Indicators (LEI) also mirrors the ongoing weak economic growth. The weak portions were in stagnant stock prices and building permits, while the positive contributors were higher long term interest rates (which predicts future growth), the leading credit index (more debt), lower average weekly initial claims for unemployment insurance, higher average consumer expectations for business conditions and manufacturers’ new orders for consumer goods and materials.  The factory workweek was a zero contribution.

clip_image004

Graph: Econoday

Right now, therefore, industrial production seems to be the main culprit, rather than the service sector, because of subdued exports. The Empire State and Philly Fed manufacturing surveys were slightly positive, but overall production has trended downward.

clip_image006

Graph: Econoday

So we can say that inflation should not be a problem for some time. Real inflation could even be years away, given that overall household incomes have shrunk 10 percent since 2000.  That means the decline in wages and salaries is the real problem holding back sustainable domestic growth.  Then the question becomes how to gain back some of that wealth?

Harlan Green © 2013

Follow Harlan Green on Twitter: www.twitter.com/HarlanGreen

Monday, July 22, 2013

Are Home Prices Rising Too Fast?

The Mortgage Corner

No, they are just catching up to 4 years of weak household formation and even weaker income growth. Home prices have been held down from a combination of government austerity policies and private sector hoarding since the Great Recession that has kept most homebuyers on the sidelines until this year.

Trulia chief economist Jeff Kolko estimates home prices are still 7 percent undervalued, as compared to pre-bubble levels.

“We estimate that national home prices are 7 percent undervalued in the second quarter of 2013 (2013 Q2),” said Kolko. “During last decade’s bubble, prices were as high as 39 percent overvalued in 2006 Q1, then during the bust, fell to 15 percent undervalued in 2011 Q4. Therefore, even with the recent price increases, home prices nationally remain undervalued relative to fundamentals and much lower than in the last bubble. That’s why today’s price gains are actually still a rebound, not a bubble.”

clip_image002

Graph: WSJ Marketwatch

But the real culprit is income growth. The combination of Bush tax cuts and 2 recessions resulting in the largest budget deficits since WWII have suppressed employee income growth to the lowest level since WWII.

clip_image004

Graph: WSJ Marketwatch

There has been a huge drop in household formation, so much so that the Cleveland Federal Reserve Bank reports compared to the previous 10 years, the growth rate in the number of households was cut by two-thirds between 2007 and 2010.

“This slowing in household formation reflects the overall weak economy,” says the Cleveland Fed, “but it has also negatively impacted the housing market, as lower household formation rates reduce housing demand.”

So 2013 is finally looking like a recovery year for housing. June existing-home sales are back above 5 million unit annually for only the second month since the 2009 first-time homebuyer tax break. Total existing-home sales, which are completed transactions that include single family, townhomes, condominiums and co-ops, dipped 1.2 percent to a seasonally adjusted annual rate of 5.08 million in June from a downwardly revised 5.14 million in May, but are 15.2 percent higher than the 4.41 million-unit level in June 2012.

clip_image006

Graph: Calculated Risk

And inventory levels are improving, which will slow down price rises in some areas. Total housing inventory at the end of June rose 1.9 percent to 2.19 million existing homes available for sale, which represents a 5.2-month supply at the current sales pace, up from 5.0 months in May. Listed inventory remains 7.6 percent below a year ago, when there was a 6.4-month supply.

An interesting sidelight is that the percentage of distressed California sales is down sharply, reports DataQuick, an RE research company. Of the existing homes sold last month, 10.0 percent were properties that had been foreclosed on during the past year – the lowest level since foreclosure resales were 9.4 percent of the resale market in August 2007. Last month’s figure was down from a revised 11.3 percent in May and 24.9 percent a year earlier. Foreclosure resales peaked at 58.8 percent in February 2009.

And Short sales - transactions where the sale price fell short of what was owed on the property - made up an estimated 16.0 percent of the homes that resold last month. That was down from an estimated 16.8 percent the month before and 24.3 percent a year earlier. The key is the percentage of distressed sales is down significantly – while the number of conventional sales are up about 40 percent year-over-year, per DataQuick

Harlan Green © 2013

Follow Harlan Green on Twitter: www.twitter.com/HarlanGreen

Tuesday, July 16, 2013

Builder Confidence Soaring

The Mortgage Corner

The National Association of Home Builders just announced that home builder confidence soared to the highest level since 2006, the height of the housing bubble.  This can only mean more new-home construction to fill the pent up demand for housing after 4 years of housing depression.

Builder confidence in the market for newly built, single-family homes rose six points to 57 on the Association of Home Builders/Wells Fargo Housing Market Index (HMI) for July, released today. This is the index’s third consecutive monthly gain and its strongest reading since January of 2006.

“Builders are seeing more motivated buyers coming through their doors as the inventory of existing homes for sale continues to tighten,” noted NAHB Chief Economist David Crowe. “Meanwhile, as the infrastructure that supplies home building returns, some previously skyrocketing building material costs have begun to soften.”

clip_image002

Graph: Calculated Risk

That brings up the subject of inflation, as building material prices are bound to rise with the increase in demand for new homes. And the Consumer Price Index is rising, but it also means housing prices are rising, a good thing. Housing prices tend to rise with inflation—in fact, are a sign of rising inflation—as do interest rates. So it will be a race for homeowners to get in on any bargains left with Bernanke’s Federal Reserve determined to slow down QE3 purchases this year.

clip_image004

Graph: Calculated Risk

Year-on-year, overall CPI inflation jumped to 1.8 percent from 1.4 percent in May (seasonally adjusted). The core rate posted at 1.6 percent, compared to 1.7 percent. By major components outside the core, most of the rise was in energy, up 3.4 percent. Gasoline surged 6.3 after no change in May. Advances for shelter, medical care, and apparel accounted for most of the rise in the core measure, with increases in the indexes for new vehicles and household furnishings and operations also contributing.

A major reason for the surge in builder confidence is also the lean inventory of existing home sales. The home resale market is surging, up 4.2 percent to an annual sales rate of 5.18 million which is the highest since the home stimulus credits of late 2009. The gain is centered in the key single-family home category which is up 5.0 percent in the May report.

This is while the median price is up 8.4 percent in May alone, to a recovery best $208,000. The average price, at $255,300, is up 5.6 percent in the month. Year-on-year gains are 15.4 percent for the median price and 11.2 percent for the average.

Lack of supply is a key factor behind the price surge, as we said, and the reason for so much builder optimism. More supply did come into the market in May, totaling 2.22 million homes for sales vs 2.15 million in April, but declined relative to the surging sales rate. Supply measured against sales is at 5.1 months vs 5.2 months in April in a reading that points to further price strength for housing construction and new home sales, as well.

Harlan Green © 2013

Follow Harlan Green on Twitter: www.twitter.com/HarlanGreen

Friday, July 12, 2013

Shadow Inventory of Bad Loans Still Too High

Financial FAQs

The shadow inventory of troubled homes fell to about 2 million in April, down 18 percent from the same period in the prior year, and down 34 percent from a peak of 3 million in early 2010. But that is still too many homes in trouble for the Fed to begin to reduce its asset purchases.

Shadow home inventory includes properties with seriously delinquent mortgages, in foreclosure or held by mortgage servicers, but not yet listed, according to CoreLogic, an Irvine, Calif.-based analysis firm. Bad loans are working their way out of the system, and new mortgages for borrowers with better credit are taking their place. Also, rising home prices and low interest rates are helping troubled owners sell or refinance their homes, reducing the pipeline of foreclosures.

clip_image002

Graph: WSJ Marketwatch

This is when interest rates have risen to 2-year highs. A gauge of mortgage applications has contracted almost every week since mortgage rates started climbing more than two months ago, according to data released Wednesday. For the week that ended July 5, the Mortgage Bankers Association’s barometer of mortgage loan application volume fell 4 percent as rates hit the highest level in two years.

clip_image004
Graph: WSJ Marketwatch

Interest rates have risen some 1 percent since April, which means some consumers will have a tougher time affording monthly mortgage payments. With a $417,000 conforming loan, that 1 percent rise means either a borrower needs 8.6 percent more income, or a home worth 8.6 percent less. With 20 percent down and a $417,000 loan, that would mean a reduction of $41,000 in what a prospective buyer could afford.

This will not encourage middle class buyers who now have to earn some $74,664 per year to afford a home in that price range. This has to slow down housing activity to some extent, which is another reason for the Fed to stand pat at present.

Harlan Green © 2013

Follow Harlan Green on Twitter: www.twitter.com/HarlanGreen

No Tapering By Fed This Year

Popular Economics Weekly

Fed Chairman Bernanke once more ‘clarified’ his remarks, saying there is no way the Fed will even begin to raise their (short term) interest rates when the unemployment rate falls to 6.5 percent.

“There will not be an automatic increase in interest rates when unemployment hits 6.5 percent,” said Bernanke. “And, given the weak labor market and low inflation, “it may well be sometime after we hit 6.5 percent before rates reach any significant level,” the Fed chief added.

So there is also good reason to believe the Fed won’t begin to ‘taper’ purchases of QE3 securities this year, either. Why? The labor market is even weaker, and the real unemployment rate is much higher, than the current 7.6 percent.

Calculated Risk and many others have noted a significant portion of the decline in the unemployment rate from 10.0 percent in October 2009 to 7.6 percent in June 2013 was related to a decline in the employment-to-participation rate from 65.0 percent in Oct 2009 to 63.5 percent in June 2013.  If the participation rate had held steady, the unemployment rate would be 9.7 percent (assuming an increase in the participation rate with the same employment level).

clip_image002

Graph: Calculated Risk

Some 2 million discouraged workers have been sitting on the sidelines for more than 6 months and the labor participation rate was as high as 67 percent until the Great Recession, which tells us why this recession was so deep. Most of the unemployed are now the 24 to 55 year-olds of prime working age, which is a tremendous loss of the most productive workers.

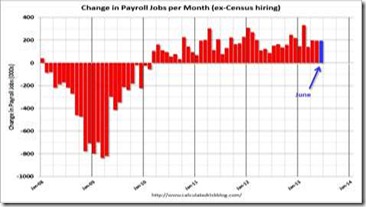
The June 195,000 non-farm payroll increase was a good number, though not the 300,000 per month that prevails during a healthy economy. The change in total nonfarm payroll employment for April was revised from +149,000 to +199,000, and the change for May was revised from +175,000 to +195,000. With these revisions, employment gains in April and May combined were 70,000 higher than previously reported.

clip_image004

Graph: Calculated Risk

Another reason QE3 may not end soon is the downgrading of GDP growth estimates. The IMF just downgraded its prediction of U.S. GDP growth to 1.8 percent in 2013. The Fed now has the most optimistic growth projection of 2.3 to 2.6 percent in 2013.

So who do we believe? It looks like the Fed wants have its cake and eat it, too, as they say. It wants to tell the markets that the outright purchase of $85 billion per month in securities has to end eventually, because economic growth will pick up. But when? It is in effect trying to boost what is called the yield curve of longer term interest rates, without any signs that growth is increasing.

So once again the Fed is playing the expectations game. But that can be a two-edged sword, as we’ve said in the past, because right now the markets are betting that higher rates mean slower growth ahead.

Harlan Green © 2013

Follow Harlan Green on Twitter: www.twitter.com/HarlanGreen

Tuesday, July 9, 2013

Mortgage Delinquencies Continue Decline

The Mortgage Corner

Mortgage delinquencies and foreclosures continue to decline. According to Lender Processing Services (LPS), 6.08 percent of mortgages were delinquent in May, down from 6.21 percent in April, while 3.05 percent of mortgages were in the foreclosure process, down from 4.12 percent in May 2012.

This was the largest drop in delinquencies in 11 years, and gives a total of 9.13 percent delinquent or in foreclosure. It breaks down as:
• 1,708,000 properties that are 30 or more days, and less than 90 days past due, but not in foreclosure.
• 1,335,000 properties that are 90 or more days delinquent, but not in foreclosure.
• 1,525,000 loans in foreclosure process.

clip_image002
Graph: Calculated Risk

Delinquencies are down more than 15 percent since the end of December 2012, coming in at 6.08 percent for the month. As LPS Applied Analytics Senior Vice President Herb Blecher explained, much of this improvement is supported by the fact that new problem loan are approaching the pre-crisis average.

“Though they are still approximately 1.4 times what they were, on average, during the 1995 to 2005 period, delinquencies have come down significantly from their January 2010 peak,” Blecher said. “In large part, this is due to the continuing decline in new problem loans -- as fewer problem loans are coming into the system, the existing inventories are working their way through the pipeline. New problem loan rates are now at just 0.73 percent, which is right about on par with the annual averages during 2005 preceding.

It has to be why consumer spending is in effect soaring. Consumers were out in force in May as consumer credit rose a huge $19.6 billion. Revolving credit jumped $6.6 billion for the largest gain since May last year and the second largest of the recovery. The gain points to a jump in credit card use which, if extended, would be a big plus for retailers. It hasn’t increased at all for most of the year, until now.

clip_image004

Graph: Econoday

Non-revolving credit also jumped in the month, up $13.0 billion for yet another outsized gain that reflects both strong car sales but also gains in the student loan component that are tied in part to ongoing government acquisitions of student loans from private lenders, acquisitions that do not necessary reflect current student borrowing.

So the wealth effect from more jobs and rising housing prices seems to be taking hold. That is why delinquencies have been declining, in the main. This is while the Labor Department’s Job Openings and Labor Turnover Survey (JOLTS) showing some 3.828 million new job openings in June, and 4.4 million new jobs created.

clip_image006

Graph: Econoday

Both hires and separations are oscillating upward with hires running a little higher than separations. In May, there were 4.441 million hires versus 4.395 million the month before. There were 4.323 million total separations in the month of May-slightly up from 4.287 million in April. The separations rate was 3.2 percent. Total separations include quits, layoffs and discharges, and other separations.

Harlan Green © 2013

Follow Harlan Green on Twitter: www.twitter.com/HarlanGreen

Friday, July 5, 2013

QE3 Works, So Please Don’t Mess With It!

Financial FAQs

Dear Federal Reserve Governors; Please don’t mess with QE3 just yet! Not in September, or even December. There are still too many reasons not to begin to taper the $85 billion per month in purchases that have kept interest rates so low, though rates are already rising rapidly. You are doing your job in raising expectations for higher growth and higher inflation.

You are also doing your job in encouraging more workers to look for work with 177,000 more entering the workforce. But part time jobs have jumped 322,000 to 8.2 million employed, more than the 177,000 additional entering the workforce, so more fulltime workers may have become part timers.

You are doing your job in putting 1.1 million older workers back to work of the 1.6 million jobs created over the past year, but there were only 355,000 jobs added in the 25 to 55 year age group, who are our prime workers, says WSJ Marketwatch’s Rex Nutting.

Your QE3 program is also doing its job in boosting wages. The June report reported that hourly and weekly wages increased 0.4 percent in June, and hourly wages are now up 2.2 percent over the last year. But that means employers are working their employees harder with longer hours, rather than hiring many new workers.

clip_image002

Graph: Calculated Risk

This well-known graph shows it best. It reveals just how far the U.S. is from returning to normal employment, and how long this recovery has taken. The longest post WWII recession until the Great Recession lasted some 22 months under GW Bush.

But employment from the Great Recession is still -1.6 percent below peak employment 40 months later! This has to be an intolerable situation, and the reason the Fed began its $85 billion per month drive to keep interest rates so low last September.

And then there’s the Labor Department’s U-6 total of unemployed that jumped from 13.8 percent to 14.2 percent in June. It is defined as “all persons marginally attached to the labor force, plus total employed part time for economic reasons, as a percent of the civilian labor force plus all persons marginally attached to the labor force.”

This is not the America we should want to live in, so please Fed Governors and Chairman Bernanke, above all. Stick to your monetary guns! QE3 works, but the economy isn’t yet working well enough to put down those guns.

Harlan Green © 2013

Follow Harlan Green on Twitter: www.twitter.com/HarlanGreen

Tuesday, July 2, 2013

Managing Expectations—The Fed’s Two-Edged Sword

Popular Economics Weekly

It does look like the results of Fed Chairman Bernanke’s push for greater transparency in Federal Reserve policy deliberations are coming home to roost. Stock and bond prices have been whipsawed since Bernanke made the seemingly offhand remark that QE3 security purchases could be cut back by the end of the year.

Just what did Bernanke’s Fed expect, in their crusade to manage expectations for greater growth with the printing of so much money? Its seems to have backfired, at least for the moment. The market plunges that resulted from his remarks are testament to the fact that investors believed any hint of higher interest rates could slow down or even halt the recovery. The markets obviously believe the recovery isn’t yet strong enough to tolerate higher interest rates, contrary to the Fed’s own expectations for growth.

Paul Krugman said it best in a recent blog post: “What went wrong? The Fed grossly misunderstood the nature of the relationship between its statements and market expectations. It believed that the market was listening closely to the details of what it said. In fact, the market doesn’t — and probably shouldn’t…what the Fed conveyed with the tapering talk was a sense that its heart really isn’t in this stimulus thing.”

So Bernanke’s crusade for greater transparency can be a two-edged sword, in that the underlying reason for greater transparency was to test how well the Fed could manage expectations for greater growth—by pushing both short and long term interest rates to record lows—thus telling consumers and businesses they could borrow cheaply with overly optimistic projections for future growth.

But as former Fed Chairman Alan Greenspan once said; “Human nature being what it is, the vast majority of us are disinclined to offer half-thought-through, but potentially useful, policy notions only to have them embarrassingly dissected in front of a national television audience. When undertaken in such a medium, deliberations tend toward the less provocative and less useful…The undeniable, though regrettable, fact is that the most effective policymaking is done outside the immediate glare of the press.”

Fed Governor Jerome Powell was one such example, when he tried to mitigate Bernanke’s remarks. “The reaction of the forward and futures markets for short-term rates appears out of keeping with my assessment of the [Federal Open Market] Committee’s intentions, given its forecasts,” Mr. Powell said. “To the extent the market is pricing in an increase in the federal funds rate in 2014, that implies a stronger economic performance than is forecast either by most FOMC participants or by private forecasters.”

And that is what happened. The Fed Governors attempts at greater transparency have come out as conflicting statements and speeches—maybe well thought out, but nevertheless confusing.

Then came the revision of Q1 GDP growth downward from 2.4 percent to 1.8 percent, largely on downward revisions to consumer spending. So right away we see that Bernanke’s basis for his optimism was being cut away. Faster growth may not be with us, as least not in the foreseeable future. So maybe it’s not such a good idea to attempt to ‘manage’ expectations. Or maybe the Fed doesn’t have a good read on what those market expectations are, which can be a sword that cuts both ways!

Harlan Green © 2013

Follow Harlan Green on Twitter: www.twitter.com/HarlanGreen