Monday, September 22, 2014

Existing-Home Sales and Interest Rates

The Mortgage Corner

The National Association of Realtors reported after four consecutive months of gains, existing-home sales slipped in August, as all-cash paying investors retreated from the market. Sales increases in the Northeast and Midwest were outweighed by declines in the South and West. There are fewer bargains that appeal to investors, in other words—such as foreclosures and short sales available.

So it’s now up to genuine home buyers looking for a home to increase sales, and that will happen more frequently as rents continue to skyrocket and vacancies decline. Total existing-home sales, which are completed transactions that include single-family homes, townhomes, condominiums and co-ops, decreased 1.8 percent to a seasonally adjusted annual rate of 5.05 million in August from a slight downwardly-revised 5.14 million in July. Sales are at the second-highest pace of 2014, but remain 5.3 percent below the 5.33 million-unit level from last August, which was also the second-highest sales level of 2013.

sales

Graph: Calculated Risk

NAR chief economist Lawrence Yun says sales activity remains stronger than earlier in the year, but fell last month. "There was a marked decline in all-cash sales from investors,” he said. "On the positive side, first-time buyers have a better chance of purchasing a home now that bidding wars are receding and supply constraints have significantly eased in many parts of the country.” Yun adds, "As long as solid job growth continues, wages should eventually pick up to steadily improve purchasing power and help fully release the pent-up demand for buying.”

The major reason for less investor demand is the fall in foreclosures and delinquent mortgages, as we said. Fannie Mae reported that the Single-Family Serious Delinquency rate declined in July to 2.00 percent from 2.05 percent in June. The serious delinquency rate is down from 2.70 percent in July 2013, and this is the lowest level since October 2008.

Freddie Mac also reported that the Single-Family serious delinquency rate declined in July to 2.02 percent from 2.07 percent in June. Freddie's rate is down from 2.70 percent in July 2013, and is at the lowest level since January 2009. Freddie's serious delinquency rate peaked in February 2010 at 4.20 percent. We are therefore closer to the longer term default rates, as shown in the accompanying graph.

lates

Graph: Calculated Risk

And rental vacancies continue to fall, which means both rising prices, and less available rental units, another incentive for home seekers to buy. The best vacancy survey is by Reis, the apartment info data site. Vacancy was unchanged during the second quarter at 4.1 percent, said Reis, a slight worsening versus last quarter. But over the last twelve months the national vacancy rate has declined by 20 basis points, slightly below the pace of the last few quarters.

“We have been anticipating this slowdown in vacancy compression as demand moderates while supply growth accelerates,” said Reis, but that won’t deter those who study longer term trends from wanting to buy. The national vacancy rate now stands 390 basis points below the cyclical peak of 8.0 percent observed right after the recession concluded in late 2009.

reis

Graph: Calculated Risk

That’s because at 4.1 percent, the national vacancy rate remains low by historical standards. The only time vacancy in the US was lower was during the dot.com boom‐and‐bust days of 1999 and 2000. Asking and effective rents both grew by 0.8 percent during the second quarter. This is an increase from growth during the first quarter which now appears to be just a temporary slowdown, likely due to seasonal factors. Rent growth, though weak by historical standards given such a low vacancy rate, continues to accelerate.

So we seem to have returned to historical levels of mortgage delinquencies and foreclosures, as well as rental vacancies, which means housing sales should also return to more normal levels. The shortage in inventories is the major problem, at present. This also means lots of pent up demand for new housing, which housing construction and new-home sales must eventually fill.

Harlan Green © 2014

Follow Harlan Green on Twitter: https://twitter.com/HarlanGreen

Saturday, September 20, 2014

Yellen’s Fed is Full Speed Ahead

Financial FAQs

Is it possible? The Federal Reserve is now more interested in creating wealth for the many, rather than fighting inflation for the wealthiest worrying about their bond prices, as it has in the past? This may seem counterintuitive, since inflation hurts everyone. But when there’s so little inflation at present, it makes more sense to focus on building the assets of those who have the least.

pce

Graph: Econoday

The condition of lower-income families in America is “sobering” even as the economy recovers, Federal Reserve Chairwoman Janet Yellen said in a speech she prepared for delivery at a conference sponsored by the Corporation for Enterprise Development.

“We have come far from the worst moments of the crisis and the economy continues to improve, but the effects of the recession are still being felt by many families, particularly those that had very little in savings and other assets beforehand,“ said Yellen.

This followed one day after the release of FOMC minutes from the last meeting, which reiterated their decision to maintain low interest rates “for the forseeable future.”

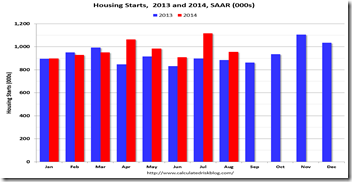
There is another reason for maintaining low interest rates. Housing sales need to pick up. There were 670 thousand total housing starts during the first eight months of 2014 (not seasonally adjusted), up 8.6 percent from the 617 thousand during the same period of 2013 (red column on graph).  Single family starts are up just 3 percent, and multi-family starts up 23 percent, because rental housing is in such demand. There are still too many households that cannot afford to buy in this market, especially new generation millennials and first-timers.

starts

Graph: Calculated Risk

But some good news is that the Federal Reserve just published its Q2 Flow of Funds report that showed total household net worth has surpassed pre-recession levels. Net worth previously peaked at $67.9 trillion in Q2 2007, and then fell to $55.0 trillion in Q1 2009 (a loss of $12.9 trillion). Household net worth was at $81.5 trillion in Q2 2014 (up $26.5 trillion from the trough in Q1 2009).

And even though the Fed estimated that the value of household real estate increased to $20.2 trillion in Q2 2014, the value of household real estate is still $2.3 trillion below the peak in early 2006.

So the Fed must continue its efforts to help Americans build assets, she said. The financial crisis showed that many American families are economically vulnerable, with few assets to fall back on in times of distress. Families with assets are able to deal with unexpected expenses as bumps in the road but “families without these assets can end up, very suddenly, off the road,” Yellen said.

For most Americans building up assets means building up equity in their homes, so with $2.3 trillion in value to make up, it will take more patience by the Fed in holding down interest rates.

Harlan Green © 2014

Follow Harlan Green on Twitter: https://twitter.com/HarlanGreen

Friday, September 19, 2014

Who Are the Real Takers?

Popular Economics Weekly

We have been there before. The Census Bureau reported that the poverty rate fell in 2013, the first drop since 2006. It fell to 14.5 percent, down from 15 percent in 2013, but 45.3 million people are still living at or below the poverty line, which for a family of four was $23,834.

Then who are the real "takers" that have held up economic growth and more jobs? It's can’t be the 47 percent that conservative polemicists and many of the 2012 presidential candidates maintained didn't pay federal income taxes. Three-quarters of entitlement benefits written into law in the United States go toward the elderly or disabled. That's according to the Center on Budget and Policy Priorities.

And it’s more than 90 percent of entitlement benefits when working households are included. Only about 9 percent of all entitlement benefits go toward non-elderly, non-disabled households without jobs (and much of that involves health care and unemployment insurance)

We should really be looking at those whose incomes have soared due to their success in slashing their own tax bills during difficult economic times, while blocking government job creation that would employ more of the 47 percent. The top 1 percent has taken 97 percent of income growth since the end of the Great Recession.

This is the first statistically significant decline in poverty since 2006 (and only the second since 2000). But the rate remained well above its 12.5 percent level in 2007 and even further above its 2000 level of 11.3 percent. At last year's rate of improvement, we would need to wait until 2018 for it to fall to or below the 2007 pre-recession level, and until 2020 to fall below the 2000 level, according to the Center For Budget and Policy Priorities.

Why do we have such a high poverty rate 5 years after the end of the Greatest Recession since the Great Recession? Who are the real takers that have not only created the greatest income and wealth inequality since the Great Depression that has created such dire poverty, but weakened our economy and power to maintain democratic values in the world?

FDR in his second inauguration speech said, “The test of our progress is not whether we add more to the abundance of those who have much, it is whether we provide enough for those who have too little.”

For starters, the red states controlled by Republicans have fought to downsize almost all government funded programs such as Medicare, food stamps, and Obamacare, yet they receive the largest share of government benefits, says Wallet Hub, a consumer finance blog.

For instance, South Carolina receives $7.87 for every $1 it pays in taxes. Mississippi and New Mexico, two of the most Red states, are ranked 40 out of 50 states in receiving the most in federal benefits, yet consistently vote for conservative policies that seek to limit government spending and benefits. And that includes badly needed spending on education, deteriorating infrastructure, and environmental regulation, all of which would provide more jobs in the underemployed U.S. economy.

This is an issue of our time, as we come severely weakened out of the Greatest Recession since the Great Depression. The takers are those who want it all, and the evidence is there for all to see—a weakened economy and a government lacking the powers to “stop evil and do good”.

“Nearly all of us recognize that as intricacies of human relationships increase,” said FDR in 1936 at the height of the Great Depression, “so power to govern them also must increase—power to stop evil; power to do good. The essential democracy of our nation and the safety of our people depend not upon the absence of power, but upon lodging it with those whom the people can change or continue at stated intervals through an honest and free system of elections.”

And so the real takers are also those who support ALEC, the American Legislative Exchange Council, or the Koch Brothers’ Americans for Prosperity that boilerplate legislation that has restricted voters’ rights by passing voter ID laws, restricting voting hours and anti-union collective bargaining, which are fundamental rights in any democracy.

It is mainly those conservative polemicists and presidential candidates who damn government in order to better their own financial position. And they have succeeded in lowering the maximum marginal tax rates from 92 percent during the Eisenhower presidency to its current low of 39 percent.

They have been so successful in taking from the wealth created by the many that the richest 10 percent now control some 50 percent of U.S. wealth, and most of the incomes growth since the end of the Great Recession, as we said.

Thomas Piketty, in his best-seller, Capital in the Twenty-First Century, perhaps said it best in attempting to explain why income and wealth inequality has worsened so much, brought about by lower taxation of the wealthiest.

“…the spectacular decrease in the progressivity of the income tax in the United and States and Britain since 1980, even though both countries had been among the leaders in progressive taxation after World War II, probably explains much of the increase in the very highest earned incomes,” he said.

Why lower taxation? Piketty explains it thusly. “Our finding that skyrocketing executive pay is fairly explained by the bargaining model (lower marginal tax rates encourage executives to bargain harder for higher pay) and does not have much to do with higher marginal productivity.”

There are several ways such record inequality slows growth. Firstly, growth is powered by what is called aggregate demand, the demand for goods and services that consumers, government, and investment generates. And since consumers power some 70 percent of economic activity and governments another 20 percent, when their spending declines, so does economic growth.

top-1

It is this record inequality that was the main cause of both the Great Depression and Recession, as declining incomes and cutbacks in government spending drastically reduced the demand for those goods and services. The years 1929 and 2010 were the years of greatest income inequality and greatest economic instability, according to Piketty and research partner Emmanuel Saez.

And economic growth has been steadily declining over the past 3 decades. It has averaged just 2 percent since the end of the Great Recession in 2009. There are numerous studies, including by the International Monetary Fund and Nobelist Joseph Stiglitz among others, that affirm the negative effect on growth of such inequality.

In fact, a recent IMF report said that “inequality can undermine progress in health and education, cause investment-reducing political and economic instability…which tends to reduce the pace and durability of growth."

So if we want to preserve our democracy, and help other countries towards greater democracy (instead of breeding more terrorism), we can no longer afford to allow the real takers to continue to take it all. The world has become too dangerous.

Harlan Green © 2014

Follow Harlan Green on Twitter: https://twitter.com/HarlanGreen

Monday, September 15, 2014

Retail Sales Much Stronger?

Financial FAQs

The jump in retail sales was huge, plus upward revisions to past months that made more sense with other indicators of a growing economy. It seems the consumer can afford to spend more with lower debt levels and jobs more available. Much of it was back to schools purchases, though, so will it hold up during the holidays when sales are traditionally strongest?

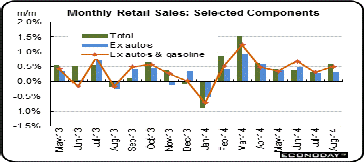
Retail sales jumped 0.6 percent in August after a rise of 0.3 percent the month before. Analysts projected 0.6 percent for August. The July upward revision was significant-previous estimate of zero.

retail

Graph: Econoday

Excluding autos, sales gained 0.3 percent in both August and July, matching expectations. Excluding both autos and gasoline sales were quite healthy, increasing 0.5 percent, following a rise of 0.3 percent in July. Expectations were for 0.4 percent.

autos

Graph: Econoday

Not surprisingly, motor vehicles increased 1.5 percent. Incentives helped feed a record 6.4 percent jump in car and light truck sales to an annual rate of 17.53 million vehicles. Next, building materials & garden equipment gained 1.4 percent-suggesting a large improvement in the housing sector. Food services & drinking places sales were up 0.6 percent, showing healthy improvement in discretionary spending. This is a good sign for the consumer sector, as I said.

construction

Graph: Econoday

And sure enough, housing construction also gained broadly in July. Construction spending rebounded 1.8 percent after a 0.9 percent dip in June. While all broad categories advanced, July's increase was led by the public sector—up 3.0 percent, following a 1.8 percent decrease in June.  This is a big thing as government spending has been a big drag on growth until now. Private nonresidential spending (i.e., commercial/industrial) rebounded 2.1 percent in July after slipping 0.8 percent the month before.  And private residential outlays gained 0.7 percent, following a 0.4 percent dip in June.

All-in-all, the revisions to retail sales and surge in construction and vehicle sales should confirm a 3 percent plus GDP growth rate for the rest of this year,and maybe into next year, in sharp contrast to Europe and Japan. Europe is slipping back into recession, in large part because of its austerity policies that cut government spending at a time of falling consumer and export demand.

Harlan Green © 2014

Follow Harlan Green on Twitter: https://twitter.com/HarlanGreen

Friday, September 12, 2014

Minimum Wages vs. Maximum Profits?

Financial FAQs

Corporate profits are at all-time highs, and workers compensation at all-time lows, as fast food workers continue to strike for higher minimum wages. Yet business interests still maintain maximum profits have to be a corporation’s primary consideration. In fact, it would be breaking their corporate charters to operate otherwise!

Actually, not so. Maximizing corporate profits at the expense of everything else—such as environmental pollution—is no longer allowed. And workers have some protections, such as safety regulations under OSHA, and limitations on the number of work hour’s minimum compensation. Then why has the glorification of profit maximization enriched stockholders and CEOs, but not their employees?

One answer is the resistance of businesses to raising the minimum wage. Some states have raised the minimum wage, such as California, and cities such as Seattle. But it’s still $7.25 per hour for most states. This is even though many studies show that higher wages create greater prosperity overall. For instance, Australia, where the minimum wage for adult, full-time workers is $16.87 per hour, currently has a 3.1 percent annual GDP growth rate, vs. 2.5 percent in the U.S.

Nobelist Joseph Stiglitz, an advocate of greater income equality has said, “Our current brand of capitalism is an ersatz capitalism. For proof of this...we have monopolies and oligopolies making persistently high profits. C.E.O.s enjoy incomes that are on average 295 times that of the typical worker, a much higher ratio than in the past, without any evidence of a proportionate increase in productivity.”

epi

Graph: EPI

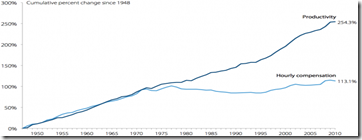
The hourly compensation of a typical worker grew in tandem with productivity from 1948–1973. But after 1973, productivity grew strongly, especially after 1995, while the typical worker’s compensation was relatively stagnant. This divergence of pay and productivity has meant that many workers were not benefitting from productivity growth—the economy could afford higher pay but it was not providing it.

A new survey of Harvard Business Alumni by the Harvard Business School entitled A Troubling Divergence in the U.S. Economy highlighted several of the reasons. Business leaders in America are reluctant to hire full-time workers. Instead, many prefer investing in technology to perform work, outsourcing to third parties, or hiring part-time workers. Only 27 percent of respondents reported that their firms engage with institutions like community colleges to prepare students with workforce skills.

And when it comes to updating the public infrastructure that would support greater productivity, forty-two percent of Business School respondents reported that the condition of infrastructure like airports, ports, and roads had declined over the past three years. For every respondent who thought infrastructure had improved, nearly five felt it had worsened.

In fact, private sector growth has been lacking in both job creation and investment in plants and equipment over the past 5 years since the official end of the Great Recession. Private sector capital stock, at 22 years of age, is the oldest it has been since 1958, said economist David Rosenberg, and is strongly suggestive of an upgrade cycle (not to mention the fact that America's spending on public infrastructure at a 20-year low!).

pubsector

Graph: Calculated Risk

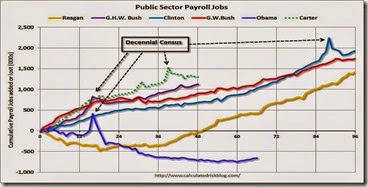
The Calculated Risk graph pictures public sector jobs of both the national and state governments. It grew during Mr. Carter's term (up 1,304,000), during Mr. Reagan's terms (up 1,414,000), during Mr. G.H.W. Bush's term (up 1,127,000), during Mr. Clinton's terms (up 1,934,000), and during Mr. G.W. Bush's terms (up 1,744,000 jobs).

However the public sector has declined significantly since Mr. Obama took office (down 682,000 jobs). These job losses have mostly been at the state and local level, but more recently at the Federal level.  Needless to say, this has been a significant drag on overall employment.

Is it all due to the Great Recession? We think not. The voices of wage and salary earners have been drowned out since then, and raising the minimum wage has not been made a priority by either party in Congress, or the White House to date. That is the tragedy, and the real solution to this continuing economic malaise.

The most recent protests are part of a two-year campaign to raise awareness of the plight of the fast-food worker, the latest having taken place in May. While the demonstrations haven’t led to an increase in the federal minimum wage, some states and localities have upped the minimum wage. Seattle raised the minimum wage to $15 an hour and Massachusetts residents will soon see an $11-an-hour minimum wage, according to NBC News. McDonald's Corp. is on record saying it supports a federal minimum wage increase, but not to $15 an hour, as demanded by its workers.

Harlan Green © 2014

Follow Harlan Green on Twitter: https://twitter.com/HarlanGreen

Wednesday, September 10, 2014

Government Wasn’t the Problem

Popular Economics Weekly

If the latest unemployment report tells us anything, it is that government isn’t the problem that has caused the weak U.S. recovery, but a private sector that is focused solely on maximizing profits for their investors and CEOs, rather than creating more jobs. And private sector corporations have succeeded in maximizing their record profits, as a percentage of GDP.

Friday’s Labor Department report showed just 142,000 net nonfarm payroll jobs created, far below the estimates, while the unemployment rate barely fell to 6.15 percent. There were 134 private payroll jobs (vs. 213 private sector jobs in July) and just 8,000 government jobs added. But stay tuned for revisions when seasonal corrections are made, as we said.

profits

Graph: Econoday

Nor was government the problem that caused the Great Recession and housing bubble in the first place; but the lack of it—of government legislation and regulations that could rein in the excesses of a shadow banking system that hid so much debt.

In fact, growth did surge just as the Great Recession officially ended in June 2009, because of the $835B 2009 American Recovery and Reinvestment Act (ARRA), but it wasn’t enough, and the economy soon reverted back to its ‘new normal, 2 percent GDP growth rate.

growth

Graph: Trading Economics

A majority of economists now agree ARRA did create jobs and prevented a Greater Recession, or even another Great Depression, which Europe is currently going through for a third time since 2008.

The Initiative on Global Markets at the University of Chicago — hardly a hotbed of liberal or Keynesian thought — regularly surveys a number of the leading American economists about a variety of policy issues. And the results from their 2014 survey, as reported by economist Justin Wolfers, overwhelmingly conclude that government ARRA stimulus spending was beneficial to both growth (benefits exceeded its costs) and jobs (more jobs were created or saved).

In fact, it is private sector growth that has been lacking in both job creation and investment in plants and equipment over the past 5 years since the official end of the Great Recession. Private sector capital stock, at 22 years of age, is the oldest it has been since 1958, said economist David Rosenberg, and is strongly suggestive of an upgrade cycle (not to mention the fact that America's spending on public infrastructure at a 20-year low!).

But will that happen? It seems the private sector would rather create jobs overseas than in the USA that has caused the weak recovery. The so-called ‘underemployment rate’ of part timers and those who quit looking for work dropped to 12 percent from12.2 percent in the August report—big deal.

u-6

Graph: Econoday

There is much evidence of the out sourcing of jobs. U.S. multinationals shifted millions of jobs overseas in the 2000s, says data from the U.S. Department of Commerce. “U.S. multinational corporations, the big brand-name companies that employ a fifth of all American workers… cut their work forces in the U.S. by 2.9 million during the 2000s while increasing employment overseas by 2.4 million,” said a recent report by the Center for American Progress.

That is why ARRA worked, and similar government stimulus programs would work. The bottom line is there are certain times, as well as sectors that only governments can fund and so create jobs.

Harlan Green © 2014

Follow Harlan Green on Twitter: https://twitter.com/HarlanGreen
Friday, September 5, 2014

Labor’s Day Not Celebrated?

Financial FAQs

It looked like August’s unemployment report would celebrate this year’s Labor Day in a big way. We know it because most employment indicators point to many more jobs this year that also pay more. Starting with the August ADP survey, the estimate for private payroll growth is 204,000, whereas predictions for the Labor Department’s report was 230,000 nonfarm payroll jobs, with most of those jobs in the higher paying Professional Services category (up 160,000 in August, according to ADP).

But, alas, today’s Labor Department report showed just 142,000 net nonfarm payroll jobs created, far below the estimates, while the unemployment rate barely fell to 6.15 percent. But stay tuned for revisions, as the seasonal adjustments were draconian (payrolls rose 327,000 July-August before seasonal adjustment), so the ADP report may turn out to be a more accurate portrayal of August employment. And monthly payrolls have increased to 215,000 in 2014, vs. 194,000 in 2013 on average.

Graph: Calculated Risk

Then there is the best predictor of employment. The ISM Purchasing Manager’s service industry report registered 59.6 percent in August, 0.9 percentage point higher than the July reading of 58.7 percent. This represents continued growth in the Non-Manufacturing sector, which is the largest business sector. The August reading of 59.6 percent is the highest for the composite index since its inception in January 2008. The Non-Manufacturing Business Activity Index increased to 65 percent, which is 2.6 percentage points higher than the July reading of 62.4 percent, reflecting growth for the 61st consecutive month at a faster rate. This is the highest reading for the index since December of 2004 when the index also registered 65 percent.

ism

Graph: Calculated Risk

The New Orders Index registered 63.8 percent, 1.1 percentage points lower than the reading of 64.9 percent registered in July. The Employment Index increased 1.1 percentage points to 57.1 percent from the July reading of 56 percent and indicates growth for the sixth consecutive month.

And manufacturing growth is very strong based on the ISM manufacturing index where the composite index jumped to 59.0 from 57.1 in July, which also means more job creation. New orders headline August's strength, rising to an exceptional 66.7 vs an already very strong 63.4 in July. Production is at 64.5, vs July 61.2, with employment steady and strong at 58.1 vs 58.2.

jolts

Graph: Calculated Risk

Lastly, the Labor Department’s latest JOLTS report of job Quits and Hirings is telling us the number of job openings continues to grow. Jobs openings (yellow line in graph) increased in June to 4.671 million from 4.577 million in May and are up 18 percent year-over-year compared to June 2013. The number of Hires (blue line) rose to 4.8 million from 4.7 million, the highest since 2006.

We therefore see a falling unemployment rate for the rest of this year. It could be as low as 5.5 percent come December, as more return to the workforce. This is turn will continue to boost incomes and so economic growth, as consumers are able to spend more. This is a terrific way to celebrate this year’s Labor Day. .

Harlan Green © 2014

Follow Harlan Green on Twitter: https://twitter.com/HarlanGreen

Tuesday, September 2, 2014

Pending Sales Up, Mortgage Delinquencies Down

The Mortgage Corner

U.S. home buyers signed more contracts to buy existing homes in July, rebounding from a drop in June. This is in line with declining delinquency and foreclosure rates that portend a healthy real estate market for the rest of this year, and maybe into next year, if interest rates hold at their current lows. Today’s 30-year fixed conforming rate has fallen to 3.75 percent for 1 origination point in California.

The National Association of Realtors' monthly Pending Home Sales index rose 3.3 percent in July over June but is still 2.1 percent below its level in July 2013. It’s rising again because both consumer confidence measures have been rising of late, buoyed by rising incomes and low inflation.

pending

Graph: Econoday

"Interest rates are lower than they were a year ago, price growth continues to moderate and total housing inventory is at its highest level since August 2012," said Lawrence Yun, NAR's chief economist. "The increase in the number of new and existing homes for sale is creating less competition and is giving prospective buyers more time to review their options before submitting an offer."

michigan

Graph: Calculated Risk

And consumer sentiment is up in the final August reading, to 82.5 vs 79.2 at mid-month, along with the Conference Board’s Confidence index, the second reading of consumer optimism that is rising this week. The gain is centered in current conditions as it was in Tuesday's consumer confidence report, and underscores the improvement this month in unemployment claims, which once again fell below 300,000 for the second consecutive week. The current conditions component in this report is at 99.8 vs 99.6 at mid-month and 97.4 in final July. A rise in current conditions points to general month-to-month strength for consumer activity.

foreclosures

Graph: Calculated Risk

Lastly, home prices continue to rise and delinquencies to fall. A total of ​​3,785,000 loans were delinquent or in foreclosure in July. This is down from 4,599,000 in July 2013. Calculated Risk reports Black Knight Financial Services (BKFS) released their Mortgage Monitor report for July today. According to BKFS, 5.64 percent of mortgages were delinquent in July, down from 5.70 percent in June. More importantly BKFS reports that 1.85 percent of mortgages were in the foreclosure process, down from 2.82 percent in July 2013.

Both delinquencies and foreclosures are finally approaching historical levels, which means that housing sales—including new-home sales will do the same. The rate of monthly new problem loans has now fallen to 2005-06 levels, reports BKFS. Many foreclosure sales were held up by lengthy court proceedings in many of the eastern and Midwestern state that did judicial sales, rather than the western states with Trust Deed liens that could be auctioned off on courthouse steps.

Harlan Green © 2014

Follow Harlan Green on Twitter: https://twitter.com/HarlanGreen