Sunday, March 31, 2013

The Decline of the West

Popular Economics Weekly

Berkeley Prof Brad Delong has posted a very sobering essay on his website. Because the deficit hawks and austerity advocates now hold sway in both Europe and North America, we could be in for a very prolonged “Lesser Depression”, as he calls it.

“I had always thought that policy makers well understood the basic principle of macroeconomic management,” said this Economics Professor. “It was that the government's proper role was…to tweak asset supplies so that there were sufficient liquid assets, enough safe assets, and enough financial savings vehicles that the economy as a whole did not feel under pressure to deleverage, and so push production below potential output.”


“This principle has gone out the window. The working majority of the Federal Reserve believes it has extended its aggressive expansionary policies to if not beyond the bounds of prudence. The working majority in the U.S. Congress is taking its cues from the Saturday Night Live character "Theodoric of York, Medieval Barber". It believes that what the economic patient needs is another good bleeding of rigorous austerity, and that is putting further downward pressure on employment and production.”

Why do not policymakers in the West understand that it is in our best interests to prod economic activity enough to create robust growth, until enough revenues are generated to pay for keeping up with the rest of the world? Who are the deficit hawks that choose not to understand basic economics? Paul Krugman has called them out countless times.

“And why are we shortchanging the future so dramatically and inexcusably? Blame the deficit scolds,” said Krugman, “…whose constant inveighing against the risks of government borrowing, by undercutting political support for public investment and job creation, has done far more to cheat our children than deficits ever did.”

The scolds are mostly Republicans, in this case, who have become the protectors of the wealthiest among US, as they siphon ever more public funds away from public investments to their own profits.

Professor Krugman continues, “Fiscal policy is, indeed, a moral issue, and we should be ashamed of what we’re doing to the next generation’s economic prospects. But our sin involves investing too little, not borrowing too much — and the deficit scolds, for all their claims to have our children’s interests at heart, are actually the bad guys in this story.”

How do we escape the political gridlock that has trapped US between the past the the future? Part of the answer can lie in history. We had a similar situation at the beginning of the 20th century, when robber barons ruled, and we needed a JP Morgan to finance World War I.

Teddy Roosevelt came along with an answer, which he called the “New Nationalism”. He made sure more wealth flowed to the less wealthy by busting monopolies that ruled the new industries of that day, and advocated laws and institutions to regulate them.

We are now at the beginning of the Digital Revolution, where technology is replacing workers making the necessities of life at an ever accelerating rate. So more Americans will have more leisure time to pursue their own interests. And more importantly, the ever increasing productivity of those machines will be able to lift all boats—that is, provide more necessities, as well as amenities to improve lives—rather than go only to the profit makers.

That is to say, more Americans will be able to live off the fruits of technology, if policymakers will listen to our smartest economists. Much of the Great Recession and slow recovery is due to widespread ignorance of economic fundamentals that actually depend on social welfare, as Professor Delong says. For no economy can prosper if educational and environmental standards are ignored, which enable greater social mobility and good health. It is also an ignorance of what is in our national interest. Raising educational and environmental standards, restoring our aging infrastructure, and creating a truly universal health care system make us more competitive globally.

Don’t take my word for it. Lord John Maynard Keynes saw the consequences of increasing abundance in his famous 1930 essay, Economic Possibilities for our Grandchildren: “Thus for the first time since his creation man will be faced with his real, his permanent problem – how to use his freedom from pressing economic cares, how to occupy the leisure, which science and compound interest will have won for him, to live wisely and agreeably and well. The strenuous purposeful money-makers may carry all of us along with them into the lap of economic abundance. But it will be those peoples, who can keep alive, and cultivate into a fuller perfection, the art of life itself and do not sell themselves for the means of life, who will be able to enjoy the abundance when it comes.”

Professor Robert Shiller also discusses its consequences in his recent book, “The New Financial Order, Risk in the 21st Century”, in which he lays out what our new information technologies will be able to do. In it, “Shiller describes six fundamental ideas for using modern information technology and advanced financial theory to temper basic risks that have been ignored by risk management institutions--risks to the value of our jobs and our homes, to the vitality of our communities, and to the very stability of national economies”, says the publisher, Princeton University Press.

clip_image001

It will do all this by leveling the playing field in order to create a greater transparency of markets, as financial information in particular will be available to all. Therefore much of the risk in one’s profession, or housing value, or even health, will be able to be insured against unexpected events, such as recessions, or loss of career, or debilitating illnesses because of the new information technologies.

So the Digital, ‘Big Data’ Revolution that is upon us gives no reason to be ignorant of how the modern world works. It will become more difficult for those who profit from such ignorance to accumulate excessive wealth. Or, as Teddy Roosevelt knew, we will continue to repeat the mistakes of past centuries.

Harlan Green © 2013

Follow Harlan Green on Twitter: www.twitter.com/HarlanGreen

Tuesday, March 26, 2013

2013 Home Prices Soaring

The Mortgage Corner

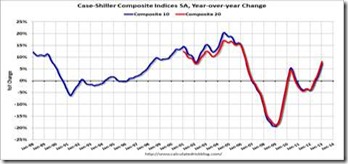
Housing prices are soaring, with both the S&P Case-Shiller Home Price Index 3-month average (for November, December and January) and FHFA conforming loan indexes accelerating. Mortgage delinquencies also continue to decline, which should help depleted inventories.

The S&P/Case-Shiller Home Price Indices showed average home prices increased 7.3 percent for the 10-City Composite and 8.1 percent for the 20-City Composite in the 12 months ending in January 2013.

“The two headline composites posted their highest year-over-year increases since summer 2006,” says David M. Blitzer, Chairman of the Index Committee at S&P Dow Jones Indices. “This marks the highest increase since the housing bubble burst."

In January 2013, nine cities -- Atlanta, Charlotte, Las Vegas, Los Angeles, Miami, New York, Phoenix, San Francisco and Tampa -- and both Composites posted positive monthly returns. Dallas was the only Metro Area where the level remained flat.

clip_image002

Graph: Calculated Risk

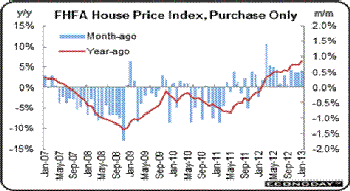
The FHFA price index for January increased 0.6 percent, following a rise of 0.5 percent the prior month.  The January gain was led by the Pacific region, increasing 1.6 cent.  The weakest region was New England, down 0.7 percent for the month. But the index is up 6.5 percent year-over-year.

clip_image004

Graph: Econoday

More good news was the continuing decline in mortgage delinquencies, according to LPS lenders’s services, as reported by Calculated Risk. LPS reported the U.S. mortgage delinquency rate (loans 30 or more days past due, but not in foreclosure) decreased to 6.80 percent from 7.03 percent in January. The percent of loans in the foreclosure process declined to 3.38 percent in February in January. 

Both numbers are still high, with 4.25 percent being the long term delinquency rate and 1 to 2 percent the historical foreclosure rate. This decline is already showing up in increasing for sale inventories, with Calculated Risk also reporting that through March 25th - inventory is increasing faster than in 2011 and 2012. But Housing Tracker reports inventory is down -21.2 percent compared to the same week in 2012—still a rapid year-over-year decline (2013 is red line in graph).

clip_image006

Graph: Calculated Risk

What does all this mean? As delinquency/foreclosure rates continue to decline, inventory should continue to increase, which means more housing sales. Although new-home sales declined slightly in February, sales are still 12.3 percent higher than February 2012.

And February existing home sales rose 0.8 percent to an annualized pace of 4.98 million units.  January was revised to up 0.8 percent from the initial estimate of 0.4 percent. Low supply had been holding down sales but that appears to be changing as higher prices are bringing more homes into the market.  Supply jumped 9.6 percent to 1.94 million units.  Months’ supply rose to 4.7 months from 4.3 months in January.

Harlan Green © 2013

Follow Harlan Green on Twitter: www.twitter.com/HarlanGreen

Friday, March 22, 2013

What Inflation?

Financial FAQs

We have seen this before during past budget battles. How much spending is necessary to create future economic growth and more jobs, without higher inflation? This is important because the amount of inflation will probably determine how long the Federal Reserve’s current easy credit policy can continue without creating too much future inflation.

So is inflation rising or falling? Is it a danger, or is inflation necessary for growth? This is what the whole deficit-debt debate is really about. How much inflation hurts economic growth by eroding spending power (and the value of debt), vs. how much inflation is needed for companies to raise their prices, hence profits.

clip_image002

Graph: WSJ Marketwatch

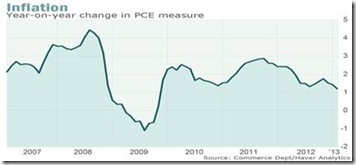
The Federal Reserve prefers the Personal Consumption Expenditure inflation index, because it measures the widest basket of goods and services purchased by consumers when the Commerce Department calculates the total amount of their personal expenditures.

And it has been less than 2 percent for more than one year. Why? Because consumers cannot afford to spend more when household incomes have barely kept up with inflation. Wages and salaries have become stagnant, in other words, as household earning power has eroded. And since consumers power 70 percent of economic activity, their spending power is the main determinate of overall prices.

clip_image004

Graph: Econoday

But what about raw material costs, such as for oil? Those costs are also dependent on the demand for the finished products they make, whether it is gasoline or animal feed, or plastics, hence also largely dependant on consumer demand.

The inflation debate is really about Federal Reserve policy for the moment. The Fed has said that as long as inflation remains moderate, then it can keep interest rates at record lows. It in turn increases the demand for loans, since cheap money encourages borrowing, and borrowing encourages both spending and investment.

This has boosted vehicle sales, in particular, and brought back Detroit’s Big Three. Motor vehicle sales have been very strong the last four months, above a 15 million annual unit rate compared to low 14 million rates through much of last year.

clip_image006

Graph: Econoday

So we don’t have to worry much about inflation, or the Fed tightening credit too soon at at the moment. This is why they have focused on the unemployment rate being 6.5 percent or lower before tightening begins. Another correlation of higher inflation has been with full employment, and historical unemployment fell to between 4 to 5 percent before that happened.

In fact, past administrations have tolerated up to 8 percent inflation rates in order to bring back full employment.  Today,  5-6 percent could probably be tolerated without much damage to consumers’ spending power.  And it should be tolerated, if that gets US back to full employment.

Harlan Green © 2013

Follow Harlan Green on Twitter: www.twitter.com/HarlanGreen
Wednesday, March 20, 2013

Spring Housing Inventories Too Low

The Mortgage Corner

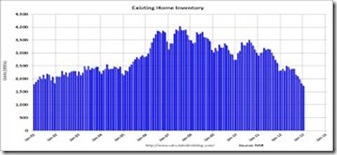
The spring home buying season is already here, reports Realtor.com. In February, the total number of single-family homes, condos, townhomes and co-ops for sale in the U.S. (1,494,218) increased by 1.15 percent month-over-month. On an annual basis, however, inventory was down by 15.97 percent.

"As we enter the busiest time of the year for home buyers and sellers, our latest housing trend data shows just how competitive the market is with a significant national housing recovery well underway," said Steve Berkowitz, chief executive officer of parent company Move, Inc. "Looking ahead, we can expect the amount of inventory to increase this spring along with higher list prices as sellers become more comfortable with the market conditions."

clip_image002

Graph: Calculated Risk

Nearly all of the markets with the largest year-over-year declines in February for sale inventories were in California, where declines averaged 48 percent. The list includes Sacramento, Stockton, Oakland, San Jose, Orange County, Los Angeles, Seattle, San Francisco, Riverside and Ventura. These markets also experienced a dramatic decline in the median age of inventory, falling to an average of just 31 days, or 53 percent lower than it was one year ago.

clip_image004

Graph: DataQuick

The result is sharply rising prices. Six-county Southern California saw the February median home price rise nearly 21 percent over the year, while remaining essentially flat compared with January, said real estate information provider DataQuick last week.

That is the main reason February housing construction soared. Privately-owned housing starts in February were at a seasonally adjusted annual rate of 917,000. This is 0.8 percent above the revised January estimate of 910,000 and is 27.7 percent above the February 2012 rate of 718,000, according to the National Association of Home Builders.

clip_image006

Graph: Calculated Risk

Single-family starts (blue) increased to 618,000 thousand in February and are at the highest level since June 2008. “Today’s report indicates that, despite some bumps in the road, overall housing production continues on the solid upward trend that we saw throughout 2012,” noted NAHB Chief Economist David Crowe. “Moreover, further gains in permit issuance are a positive sign that home construction will continue to drive economic and job growth in the coming months, albeit at a slower pace than would be possible without certain limiting factors.”

Gary Wood’s Santa Barbara MLS listings plunged 18.7 percent in February for South Coast, while the median price soared $100,000, from $842,490 to $935,000. The lower-priced inventories are disappearing, in other words. Year over year sales are up about 15 percent with the median sales price up at about the same rate to roughly $890,000.

The lack of lower-priced inventory is apparent with the average sales price way up, going from just over $1 million in 2012 to approximately $1.5 million in 2013. The numbers of escrows are also up about 15 percent with the median list price on those escrows up almost 20 percent. That is putting even more pressure on prices. Through the end of February sales and prices for both the Home Estate/PUD and Condo markets are up with about 35 percent of the homes going for over the asking price and about 15 percent of the condos also selling for over list prices.

Harlan Green © 2013

Follow Harlan Green on Twitter: www.twitter.com/HarlanGreen
Friday, March 15, 2013

Higher Retail Sales Point to Consumer Health

Popular Economics Weekly

Consumers are buying more, a reflection of improving incomes and the jobs market. The U.S. Census Bureau announced Wednesday that advance estimates of U.S. retail and food services sales for February, adjusted for seasonal variation and holiday and trading-day differences but not for price changes, were $421.4 billion, an increase of 1.1 percent from the previous month and 4.6 percent above February 2012

clip_image002

Graph: Calculated Risk

This is the best we can expect with less than full employment, when retail sales increased at 8 percent per annum. Strength was mainly motor vehicle sales, which rebounded a huge 1.1 percent following a 0.3 percent dip in January. Ex-auto sales in February increased 1.0 percent, following boost of 0.4 percent the month before (originally up 0.2 percent). Gasoline sales were also up significantly, but core strength was widely scattered with increases seen in building materials & garden equipment, food & beverage stores, clothing & apparel, general merchandise, miscellaneous store retailers, and nonstore retailers.

clip_image004

Graph: Econoday

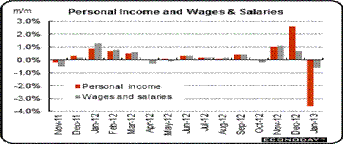
Though January personal income dropped a monthly 3.6 percent, following a 2.6 percent surge in December, December was boosted by attempts to avoid January income and payroll tax increases.  The wages & salaries component declined 0.6 percent in January after a 0.7 percent jump the month before.  But most of the weakness was led by a monthly 34.8 percent plunge in dividend income after a 32.8 percent spike in December to avoid the January tax hikes from the fiscal cliff agreement. We believe overall personal incomes will grow strongly this year, thanks in part to a tighter labor market.

clip_image006

Graph: Calculated Risk

This is why the latest weekly initial jobless claims are showing a growing jobs market that bolsters last week’s drop in unemployment. Initial jobless claims fell 10,000 in the March 9 week to 332,000. The week's total is the second lowest of the recovery.

The four-week average is now at its lowest level of the recovery, down 2,750 from the prior week to a 346,750 level that is a bit below the 350,000 trend of the month-ago comparison in what is an early positive indication for the March employment report, says Econoday.

You can’t ask for much more at this stage of the recovery, as we said. Both the Federal Reserve’s Chairman Bernanke and Vice-Chair (and probable future Chairwoman Janet Yellen, should Bernanke not continue) are in a strong position to maintain easy credit conditions through 2013 at least.

If they are able to maintain such conditions, in spite of inflation hawks, then the unemployment rate might reach their stated goal of 6.5 percent in 2014. And we might begin to see the possibility of full employment again, which historically has been 5 percent and below.

Harlan Green © 2013

Follow Harlan Green on Twitter: www.twitter.com/HarlanGreen

Wednesday, March 13, 2013

Ryan’s 19th Century Budget Plan

Financial FAQs

Republican Paul Ryan’s 2011 budget plan is being trotted out by House Republicans once again. In spite of the sequester cuts and a declining budget deficit, Ryan wants to create even more economic austerity. Representative Ryan and House Republicans have to still be living in 19th century rural America to believe this budget plan would work.

Its purpose is obvious—to cut government spending by abolishing Obamacare, or the Affordable Care Act, as well as downsizing Medicare to a private voucher program, and cutting taxes for the wealthiest even further by simplifying tax brackets to 10 and 25 percent. And he maintains this will balance the budget in 10 years!

Yet balancing the budget isn’t the problem, as many economists have pointed out, including Paul Krugman. The annual deficit that is the source of federal debt is in fact dropping too quickly, thanks to the sequester agreement, 2011 spending cuts, and the year-end income and payroll tax increases. Any further cuts will cost tens of thousands of public and private sector jobs that depend on government contracts. This will in turn strangle government revenues that would further increase the deficits and so overall debt.

clip_image002

Graph: CBPP

It is a vicious circle that those who still espouse 18th Century economics do not want to recognize. It is being tried in Europe and has precipitated a second, and third recession in the case of Great Britain. As so many, including the Center For Budget and Policy Priorities (CBPP) have pointed out, most of the debt was accumulated by wars and the Bush tax cuts. Just two policies dating from the Bush Administration — tax cuts and the wars in Iraq and Afghanistan — accounted for over $500 billion of the deficit in 2009 and will account for nearly $6 trillion in deficits in 2009 through 2019 (including associated debt-service costs of $1.4 trillion).  By 2019, CBPP estimates that these two policies will account for almost half — over $8 trillion — of the $17 trillion in debt that will be owed under current policies.

Rather the focus needs to be on creating more demand, and Ryan doesn’t give us a plan to do that. Instead he maintains that downsizing government at a time when the private sector has been holding back on job creation will magically cause the private sector to create more jobs.

clip_image004

Graph: Calculated Risk

The problem is really a lack of demand, due to fallen household incomes, as the graph makes clear. If the private sector saw a greater demand for its products and services, they would be hiring more. Most of the benefits of the huge increase in labor productivity since the 1970s has either gone to Wall Street, record high corporate profits, or its wealthiest executives.

Money has to be returned to those who produce it, not those who manage its profits if we want to create the demand that causes economic growth. The Ryan Plan sets us back to a 19th century regulatory environment, with its huge wealth disparities, dependence on fossil fuel use, and a less safe safety.

Harlan Green © 2013

Follow Harlan Green on Twitter: www.twitter.com/HarlanGreen
Tuesday, March 12, 2013

Consumers Key to Future Growth

Popular Economics Weekly

The February unemployment report gives a big boost to predictions for 2013 growth. The unemployment rate fell to 7.7 percent, and some 236,000 nonfarm payroll jobs were added to the workforce (246,000 private payroll jobs, less 10,000 government jobs lost). The next piece of the puzzle will be consumer spending. Will the increase in jobs be enough to offset the payroll tax increase? February retail sales, which account for one-third of consumer spending, comes out on Wednesday.

clip_image002

Graph: Calculated Risk

What makes the February report more hopeful was also the increase in incomes. Earnings have been oscillating monthly, but average hourly earnings increased 0.2 percent in February, following a gain of 0.1 percent January.   And the average workweek edged up to 34.5 hours in February from 34.4 hours the month before.

Turning to detail for the Household Survey that includes the self-employed, the decrease in the unemployment rate was from a 130,000 drop in the labor force, a 170,000 rise in household employment, and a 300,000 decrease in unemployed, a sign that more have stopped looking for work.

clip_image004

Graph: Econoday

Why are consumers the key to growth? Because they have been contributing to most of the Gross Domestic Product growth of late—1.5 percent in Fourth Quarter’s meager overall 0.1 percent rise in GDP activity, while government spending and inventories have been contracting.

clip_image006

Graph: Econoday

January’s retail sales fell slightly due to the tax increase but have still been averaging 4.8 percent since 2010, which matched the overall increase in jobs since then. Gains were scattered, led by general merchandise (up 1.1 percent), nonstore retailers (up 0.9 percent), and building materials & garden supplies (up 0.3 percent).  Weakness was in miscellaneous store retailers (down 2.6 percent), health & personal care (down 1.0 percent), and clothing & accessories (down 0.3 percent).

clip_image008

Graph: Econoday

The Conference Board’s January Index of Leading Economic Indicators also helps a bit when reading 2013 tea leaves. Interest rate and credit components were strong pluses for the outlook as is the rally in the stock market. Two very important components also on the plus side were lower unemployment claims and higher building permits. The claims point to strength in the jobs market and the permits to strength in housing. A negative is consumer expectations which could be low for a number of reasons--higher payroll taxes, uncertainty over future income, and higher gasoline prices, say analysts.

But we know consumer expectations are notoriously fickle, and can change direction suddenly. The latest Conference Board survey of consumer confidence shows a slight improvement, but it remains at the low end.

Why should consumers be more confident with so many still out of work and the White House fighting with Congress over budget deficits, rather than proposing more job creation programs? It should be clear by now that too much government austerity is the danger, as in Europe, while the private sector is using most of its profits in other ways—whether to create more jobs overseas, or for mergers and acquisitions, or more speculation on Wall Street.

Harlan Green © 2013

Follow Harlan Green on Twitter: www.twitter.com/HarlanGreen
Friday, March 8, 2013

Expanding Service Sector Will Boost Growth

Financial FAQs

Why are stock indexes breaking records? Part of it is because of record corporate profits (which affects price-to-earnings ratios), up 20 annually since the end of 2008, as well as good job news that is boosting investor optimism. The bulk of the nation's economy is growing strongly and looks to continue to grow strongly in 2013. The ISM's non-manufacturing (service sector) index rose nearly one point to a higher-than-expected level of 56.0. It means 56 percent of respondents reported a stronger pace of overall growth relative to what was already a strong rate in January.

clip_image002

Graph: Econoday

New orders are up a very sharp 3.8 points to 58.2 with backlogs posting a 5.5 point jump to a very strong 55.0. New orders coming in and old orders piling up is a good mix for the employment outlook. And non-manufacturers are already hiring, at 57.2 which may be down three tenths from January but is still an exceptionally strong rate of monthly employment growth.

Add to that the Labor Department’s 236,000 increase in payrolls and drop to 7.7 percent unemployment rate, and we see a more certain business environment, now that most of the budget battles have been resolved. It didn’t seem to matter who won, in other words. And 179,000 of the added jobs were in the service sector, vs. 67,000 in the goods-producing sector, which highlights why the service sector is the main engine of growth.

The ISM's manufacturing report also had very good news with accelerating monthly growth for general activity, reflected in a 1.1 point gain for the headline index to 54.2, and acceleration in new orders which jumped 4.5 points to a very strong 57.8. A plus in this report is strength in new orders for exports are also accelerating, to 53.5 for a 3-1/2 point gain. Total backlogs are especially strong in the ISM report, at 55.0 for a big 7-1/2 point gain, which means exports will be picking up again.

clip_image004

Graph: Econoday

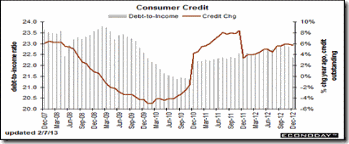
The only question mark is the consumer sector, which powers 70 percent of activity. The consumer continues to take on new debt at a steady and strong clip but whether it points to rising consumer demand is uncertain. Consumer credit rose $14.6 billion in December vs. a revised $15.9 billion in November, and $14.0 billion in October. But the revolving, credit-card side hasn’t been adding to the total. Revolving credit has been very flat, up a little bit one month and then down a little bit the next and is down $3.6 billion in the latest data. This could limit spending.

clip_image006

The service sector and manufacturing indexes are the best measure of overall economic activity, and so point to much better growth in 2013.

Harlan Green © 2013

Follow Harlan Green on Twitter: www.twitter.com/HarlanGreen

Thursday, March 7, 2013

January Housing Prices, Mortgages, Surging

The Mortgage Corner

CoreLogic reported that home prices nationwide, including distressed sales, increased on a year-over-year basis by 9.7 percent in January 2013 compared to January 2012. This change represents the biggest increase since April 2006 and the 11th consecutive monthly increase in home prices nationally.

Excluding distressed sales, home prices increased on a year-over-year basis by 9.0 percent in January 2013 compared to January 2012. On a month-over-month basis excluding distressed sales, home prices increased 1.8 percent in January 2013 compared to December 2012. The five states with the highest home price appreciation, including distressed sales, were: Arizona (+ 20.1 percent), Nevada (+17.4 percent), Idaho (+14.9 percent), California (+14.1 percent) and Hawaii (+14.0 percent).

clip_image002

Graph: Calculated Risk

This is a huge increase, and may mean borrowers and home buyers fear interest rates may rise later this year, as some Federal Reserve Governors are objecting to the sustained purchase of QE3 securities until the unemployment rate drops to 6.5 percent from its current 7.8 percent.

A major reason for the price increases is increased mortgage activity due to still low interest rates, even though stocks are rallying to record highs. The Mortgage Bankers Association reported both the Refinance and Purchase Indexes increased 15 percent from the previous week and were at the highest levels since mid-January to early February.

clip_image004

Graph: Calculated Risk

The 30-year fixed conforming rate is still at 3.50 percent for a 1 point origination fee in California, and the high-balance fixed rate is now 3.75 percent for 0 points origination.

Another reason for such rising prices is the decline in mortgage delinquency and foreclosure rates. These are homes that tend to sell under market prices, which bring down overall values. The delinquency rate for mortgage loans on one-to-four-unit residential properties fell to a seasonally adjusted rate of 7.09 percent of all loans outstanding at the end of the fourth quarter of 2012, the lowest level since 2008, according to the Mortgage Bankers Association’s (MBA) National Delinquency Survey.

The delinquency rate includes loans that are at least one payment past due but does not include loans in the process of foreclosure. The percentage of loans in the foreclosure process at the end of the fourth quarter was 3.74 percent, the lowest level since the fourth quarter of 2008, down 33 basis points from the third quarter and 64 basis points lower than one year ago.

And lastly, an increase in overall wealth has to be putting consumers in a buying mood. CNBC estimates that $1 trillion of the $4.8 Trillion increase in household wealth since the end of the Great Recession has been from rising housing values, and studies show homeowners tend to spend 10 percent of that increase, more than the additional wealth created by financial markets.

Harlan Green © 2013

Follow Harlan Green on Twitter: www.twitter.com/HarlanGreen
Wednesday, March 6, 2013

Let’s Bring Back American Jobs

Popular Economics Weekly

It’s well-known that American job formation isn’t keeping up with economic growth, but not why. It’s mostly because corporations have been retaining more of their profits and sharing less with their employees, so that household incomes have fallen to historic lows as a share of national income. That has to be reversed, if we are to get back to full employment, and employees are again paid a living wage.

It makes sense economically, since households consume some 70 percent of what is produced, diminished incomes have reduced the public’s demand for the very goods and services that would create more jobs.

So the why is not something we see in everyday headlines. WSJ Marketwatch has said that if 175,000 jobs are added in Friday’s Labor Department unemployment report, then the 135 million jobs total will just bring it back to mid-2008 levels during the Great Recession.

Why have corporations been able to rack up such profits? The conventional wisdom is because of strong global demand, cheap global labor, and low interest rates, while American workers muddle along, their significance to these companies greatly diminished by a worldwide market for goods and people.

But it’s more than that. American workers have not been able to share in that prosperity. Economist John Kenneth Galbraith pointed out as early as the 1960s in The Affluent Society, among other writings, that labor was no longer an equal partner in the Big Business, Government, Labor triumvirate. Thanks to business-friendly legislation—such as the deregulation of whole industries and Wall Street finance, corporations began to grow beyond government’s power to control their behavior.

Most American workers today are paid a barely living wage, as household incomes have declined steadily since the 1970s, while labor productivity has soared. This is while labor friendly laws were weakened that gave corporations more power to hire and fire. And Right to Work laws enabled states to inhibit or even prohibit collective bargaining, which prevented workers from negotiating for their own wages.

clip_image002

U.S. companies today give wage and salary earners the least amount of vacation and, health care coverage, while working the longest hours, of any developed country. The American employee has lost the ability to control their own destiny, in other words.

The New York Times highlighted the divergence of record corporate profits from the meager jobs formation, and income gains. Corporate profits have risen 20 percent annually since the end of 2008, while disposable (after tax) incomes have risen just 1.4 percent. This trend has in fact been happening since the 1970s, but especially since 2000 and the concerted push of Republicans to increase corporate and investment tax breaks, which pushed more of the tax burden on ordinary households.

clip_image004

Graph: The Atlantic

“We went almost a century where the labor share was pretty stable and we shared prosperity,” says Lawrence Katz, a labor economist at Harvard. “What we’re seeing now is very disquieting.” For the great bulk of workers, labor’s shrinking share is even worse than the statistics show, when one considers that a sizable — and growing — chunk of overall wages goes to the top 1 percent: senior corporate executives, Wall Street professionals, Hollywood stars, pop singers and professional athletes.

Corporate power in America is now becoming egregious, as corporations continue to consolidate power over everyday life. Corporate lobbying groups such as ALEC now write states’ legislation that limits voters’ rights and environmental regulation, as well as pushing for even less gun regulations that now endanger children.

ALEC, the American Legislative Exchange Council is the corporate-funded organization that allows global corporations like Wal-Mart and ideological special interests like the National Rifle Association (NRA) to give state legislators changes to the laws they desire. ALEC "model bills" have served as the template for voter ID laws that swept the country in 2011, for the "voucher" programs that privatize education, for anti-environmental deregulatory bills, and for the wave of anti-union legislation in Wisconsin, Ohio, and most recently, Michigan.

So it turns out taking away the voice of American employees is really taking away democracy for the majority of Americans, something that cannot be tolerated if America is to remain a prosperous democracy.

Harlan Green © 2013

Follow Harlan Green on Twitter: www.twitter.com/HarlanGreen

Friday, March 1, 2013

When Is Federal Debt Not a Burden?

Financial FAQs

The sequester advocates have gotten their way. The March 1 deadline has passed to reach an agreement to alter the across the board spending cuts and so governments will begin the draconian job cuts that will certainly slow economic growth this year—up to 750,000 jobs lost and as much as 0.6 percent off GDP growth if some compromise isn’t reached in coming weeks.

This all came about because of a lack of understanding of basic economic principles, propagated by those who should know better. One such economist and deficit hawk is Dallas Fed President Richard Fisher, who is calling for a gradual reduction in QE3 bond purchases this year, because of the ‘money Ritalin”, or artificial boost it is giving to economic growth.

"I think it's really time to taper this off," Fisher said recently on CNBC. "It doesn't mean stop it. We're not going from Wild Turkey to cold turkey. But I do think we've run up to the limits of the efficacy of what we're doing. It's a good time to do it."

He maintains the economy is improving but job creation isn't picking up fast enough. Really? That is precisely why QE3 is so important. Fed Chairman Bernanke recently said "We believe the monetary policies that we've conducted have helped get a stronger recovery and more jobs than we otherwise would have had," during his semiannual Congressional testimony.

What is it that Fisher and the deficit hawks don’t understand about Bernanke’s statement? Why doesn’t Fisher believe the facts; that Fed policies have helped a stronger recovery “than we otherwise would have had?”

They confuse overall debt with annual deficits, for one. The annual federal deficit is dropping the fastest in history—and in fact endangering this recovery. While history has shown the only way to reduce overall government debt is by increasing economic growth, which means stimulating job formation and so tax revenues. (Note that economic stimulus shouldn’t be a bad word in the context of creating more jobs, since it generates increased revenues to pay down the debt.)

clip_image002

Graph: Calculated Risk

Cutting taxes, which inordinately benefits the wealthiest 1 percent, hasn’t stimulated much growth—especially during the GW Bush administration which ran up the largest government debt since World War II, accompanying the slowest recovery since then, as well as helping to cause the Great Recession.

The answer to why such misconceptions then should be obvious. The so-called “debt burden” that economists such as Fisher and even Carmen Reinhardt and Kenneth Rogoff have said slow economic growth, is only a burden if programs aren’t in place to stimulate future growth. Cutting government spending for programs that create future jobs (in infrastructure, education, research and development) at a time of weak economic recovery, such as now, only further weakens the recovery.

It’s the chicken and the egg conundrum. Will just increasing the supply of money stimulate growth? Not unless it is spent wisely. Conservatives, such as deficit hawks believe that cutting taxes and so government spending puts more money into private pockets. But not when the private sector hoards the increased profits due to a lack of demand for their products, rather than investing it in future growth.

This is after all the definition of a recession—falling demand that leads to greater joblessness, due to falling prices or some outside event like the 1970’s oil embargos—that deficit hawks in particular don’t want to understand.

It is very basic economics 101. Just cutting spending doesn’t reduce debt without also investing in future growth. The sequester job cuts in particular will just diminish the revenues needed to bring down the federal government’s overall debt load.

Harlan Green © 2013

Follow Harlan Green on Twitter: www.twitter.com/HarlanGreen