Tuesday, August 30, 2016

US Consumers Happy Again

Popular Economics Weekly

US consumers are feeling good, with higher confidence and rising wages pushing demand for housing and consumer spending. The Conference Board’s Consumer Confidence Index rose a huge 4.4 points to 101.3 in August. It has been hovering in this range for more than one year, reflecting the strong jobs market.


“Consumer confidence improved in August to its highest level in nearly a year, after a marginal decline in July,” said Lynn Franco, Director of Economic Indicators at The Conference Board. “Consumers’ assessment of both current business and labor market conditions was considerably more favorable than last month. Short-term expectations regarding business and employment conditions, as well as personal income prospects, also improved, suggesting the possibility of a moderate pick-up in growth in the coming months.”
And consumer spending is reflecting that optimism. Consumer spending last month was lifted by a 1.6 percent surge in purchases of long-lasting manufactured goods such as automobiles. Spending on services rose 0.4 percent, but outlays on non-durable goods slipped 0.5 percent (such as food and clothing).

Personal income increased 0.4 percent in July after rising 0.3 percent in June. Wages and salaries advanced 0.5 percent. This is while savings rose to $794.7 billion from $776.2 billion in June, still a 5 percent savings rate, which means consumers are saving for the possibility of another rainy day.

Who can blame consumers for being cautious? But with housing markets taking off, it looks at long last that housing supplies are returning to normal. The Case-Shiller Home Price Index is now rising a more normal 5 percent per year, down from its recent 10 percent rise in 2013-14, as more housing comes on the market.


In boom cities like Portland and Seattle prices rose 12.6 and 11 percent, respectively, while Denver and Dallas were some 9 percent higher in June. Cities that suffered the most from the bust are also recovering in such areas as California’s Central Valley and San Francisco’s East Bay; cities such as Stockton and Vallejo that filed for bankruptcy because of the housing bust.

So what has been keeping economic growth in the 1 percent range of late, over the last 3 quarters? Most of it comes from a slowdown in labor productivity due to businesses’ refusal to invest in capital improvements. Labor productivity is at a historic post WWII low, increasing just 1.3 percent since the Great Recession, as I said last week. Normally, so-called cap-ex spending should also surge after such a downturn for production to catch up with depleted inventories, but it hasn’t this time.

Instead, corporations have been using their record profits to buy back stock, enhancing their own and stockholders incomes, a major cause also for the record income inequality. That has to change, needless to say, if voters have anything to say in the upcoming elections.

Harlan Green © 2016

Follow Harlan Green on Twitter: https://twitter.com/HarlanGreen

Friday, August 26, 2016

The Fed Can’t Really Grow US Economy

Popular Economics Weekly

Most eyes are watching Janet Yellen and the Fed’s Jackson Hole conference, where she hinted at a possible raise in short term rates this September. Higher rates are really not needed. Nothing she says in Jackson Hole can really affect longer term economic growth, which is the real problem. The record low interest rates engineered by the Fed have barely raised inflation since the Great Recession, and done almost nothing to increase investment and future growth.

Marketwatch economist Rex Nutting highlighted the low investment climate of today. We are still in an investment recession. The record low amount of investment (capital expenditure) spending by the private sector, local, and national governments as a percentage of GDP since the Great Recession has meant we are using up what we have invested to date in public and private productive capacity without replacing it.
The result is a record low productivity rate and low-paying jobs in the service sector that mostly cater to domestic demand. “Who’s preparing the United States for the 21st century?” writes Nutting. “Nobody, really. Not the 22 million private businesses, not the 118 million households, and not the 90,000 state, local or federal government agencies. Most troubling, there’s still very little investment in the buildings, equipment and intellectual property that we ought to be putting into place today as the foundation of our prosperity tomorrow.”
We see as evidence the lackluster growth in this morning’s second revision to Q2 GDP growth at only a plus 1.1 percent annualized rate following even softer rates in the prior two quarters of 0.8 and 0.9 percent. Yet consumer spending increased 4.2 percent in Q2. So what are consumers buying? Mostly imported foreign products produced overseas.

Much of that is due to the flight of manufacturing jobs overseas that Bernie Sanders and Donald Trump have been railing about. But the flood of cheaper imports is also because of our low productivity rate due to the obsolescence of things that increase productivity, which means better transportation, power transmission, education and R&D investments that would enable Americans to produce more efficiently, and so compete with cheaper foreign products.

 Labor productivity is at a historic post WWII low, increasing just 1.3 percent since the Great Recession. It is calculated at output per hour of work. In Q2 2016, for instance, output increased 1.2 percent while hours needed to produce that amount increased 1.8 percent. Normally, productivity should also surge after such a downturn for production to catch up with depleted inventories, but it hasn’t this time.

This is one area in which both Republicans and Democrats seem to be in agreement. Both advocate increased spending on public and other productivity enhancing projects, but not who should pay for them. It has to be taxpayer funded if private industry won’t step up. And Hillary, for one, is proposing to penalize those corporations that spend their profits on stock buybacks that enhance CEO incomes, rather that projects that would enhance their long term growth. Such ‘inducements’ seem to be the only way to keep US competitive in what is now a global economy.

Harlan Green © 2016

Follow Harlan Green on Twitter: https://twitter.com/HarlanGreen

Wednesday, August 24, 2016

National Home Sales Soar

The Mortgage Corner

It’s finally happened. Housing is now leading this 7-year recovery—finally. It’s taken a long time for those wanting to form new households to leave their parents, or school, or even pay down their education loans sufficiently to be able to buy a home. It is in large part to be due to historic low mortgage rates, since household incomes are still barely rising, as well as rapidly rising rents we have discussed in past columns.

New-home sales, a leading indicator of future growth, have reached a 9-year high, according to the US Census Bureau. New U.S. single-family home sales rose in July, as demand increased broadly, brightening the housing market outlook.

This is while total existing-home sales, which are completed transactions that include single-family homes, townhomes, condominiums and co-ops, fell 3.2 percent to a seasonally adjusted annual rate of 5.39 million in July from 5.57 million in June, said the National Association of Realtors. But that’s only the second time in the last 21 months, sales are now below (1.6 percent) a year ago (5.48 million).

New home sales surged 12.4 percent to a seasonally adjusted annual rate of 654,000 units last month, the highest level since October 2007. June's sales pace was revised down to 582,000 units from the previously reported 592,000 units.


Still, sales were up 31.3 percent from a year ago, said Reuters. Economists polled by Reuters had forecast single-family home sales, which account for about 9.6 percent of overall home sales, slipping to a rate of 580,000 units last month.

 “July’s positive report shows there is a need for new single-family homes, buoyed by increased household formation, job gains and attractive mortgage rates,” said NAHB Chief Economist Robert Dietz. “This uptick in demand should translate into increased housing production throughout 2016 and into next year.”

And it will give a boost to housing construction, among other sectors, as there is a mere 4.3-month supply of homes left on the market, something that will boost future construction. The inventory of new homes for sale was 233,000 in July, which is a 4.3-month supply at the current sales pace. The median sales price of new houses sold was $294,600.

This has to be why July housing construction also rose a strong 2.1 percent to a 1.211 million annualized rate which comes on top of June's 5.6 percent surge. Starts for single-family homes, the most important category in terms of economic growth, rose a very respectable 0.5 percent in July but were dwarfed by a 5.0 percent surge for multi-family homes. These results point to ongoing strength for construction, as well.
And Lawrence Yun, NAR chief economist, says existing sales fell off track only slightly in July after steadily climbing the last four months. “Severely restrained inventory and the tightening grip it’s putting on affordability is the primary culprit for the considerable sales slump throughout much of the country last month,” he said. “Realtors® are reporting diminished buyer traffic because of the scarce number of affordable homes on the market, and the lack of supply is stifling the efforts of many prospective buyers attempting to purchase while mortgage rates hover at historical lows.”
The dearth of supply is mainly in the lower prices ranges with lower profit margins, needless to say.  Dr. Yun adds, “Furthermore, with new condo construction barely budging and currently making up only a small sliver of multi-family construction, sales suffered last month as condo buyers faced even stiffer supply constraints than those looking to purchase a single-family home.”

The result is surging housing prices. The median existing-home price for all housing types in July was $244,100, up 5.3 percent from July 2015 ($231,800). July’s price increase marks the 53rd consecutive month of year-over-year gains. That is why the share of first-time buyers was 32 percent in July, which is below last month (33 percent) but up from 28 percent a year ago. That is sad, as entry level first-timers have made up 40 percent of buyers in better times. First-time buyers represented 30 percent of sales in all of 2015.

But if Janet Yellen and her Fed Governors give in to the cry by inflation hawks for higher interest rates just because Q3 and Q4 growth may be slightly higher than the horrid current GDP growth (how about 1.2 percent?), as we said last week, the housing rally (if you can call it that) would be nipped in the bud. It’s only because of those low interest rates that housing is becoming more affordable for those that can afford to buy—which is the diminished American middle class.

Harlan Green © 2016

Follow Harlan Green on Twitter: https://twitter.com/HarlanGreen

Monday, August 22, 2016

Much More Housing Needed

The Mortgage Corner

There’s an exception to the current low inflation prognostications echoed in my column on the San Francisco Fed John Williams. It’s in housing, which is struggling to meet the surging demand for both new homes and apartments that our newest millennial generation and immigrants need. The result is housing prices are rising faster than inflation, some 5 to 6 percent.

But if Janet Yellen and her Fed Governors give in to the cry by inflation hawks for higher interest rates just because Q3 and Q4 growth may be slightly higher than the horrid current GDP growth (how about 1.2 percent?), the housing rally (if you can call it that) would be nipped in the bud. It’s only because of the record low mortgage rates that housing is becoming more affordable for those that can afford to buy—which is the diminished American middle class. We will know more when both new and existing-home sales come out this week.

Millennials are the new baby boomers (as well as their offspring) in being the largest population group in history. And they are coming of age, all 80 million of them, of which the oldest now are 36 years of age and forming households.

 Graph: NAHB.org

This increased demand for housing is reflected in new home construction and higher builder optimism, reflected in the Wells Fargo Housing Market Index that measures home builders sentiment, and has been positive since January 2014.


 July housing starts rose a strong 2.1 percent to a 1.211 million annualized rate which comes on top of June's 5.6 percent surge. Starts for single-family homes, the most important category in terms of economic growth, rose a very respectable 0.5 percent in July but were dwarfed by a 5.0 percent surge for multi-family homes. These results point to ongoing strength for construction, as well.

Other signs point to faster growth, such as industrial production, which is finally expanding after contracting for more than one year? July production jumped 0.7 percent to give a big one half point lift to the capacity utilization rate which is at 75.9 percent, according to the Federal Reserve. And the Chicago Fed’s National Economic Activity Index that attempts to measure overall US growth rose to a 12-month high this week.


Manufacturing output rose 0.5 percent in the month which follows a downward revised but still very respectable 0.3 percent gain in June. Vehicle production was exceptionally strong in June and was also very solid in July though other manufacturing industries were also strong contributors to the latest month's gain.
Hi-tech was also strong in the month and a look at market groups shows 0.6 percent monthly gains for both consumer goods and business goods, the latter a plus given the persistent weakness in business investment.

The pundits are saying that Fed Governor Yellen will hint at a boost in the Fed’s short term rates from 0.5 percent, but that would be a mistake. There is no really affordable housing being built at present, which means rents and rental housing will have to carry the burden of new household formation.

And the result is that rents are now rising at record rates throughout the country. In fact, RealtyTrac, (www.realtytrac.com) “the nation’s leading source for comprehensive housing data,” released its 2016 Rental Affordability Analysis in January, which shows that buying is still more affordable than renting in 58 percent of U.S. housing markets despite home price appreciation outpacing rent growth in 55 percent of markets. The report also shows that the rise in rents is outpacing weekly wage growth in 57 percent of markets, per Realtytrac.

Harlan Green © 2016

Follow Harlan Green on Twitter: https://twitter.com/HarlanGreen

Thursday, August 18, 2016

No More Inflation?

Popular Economics Weekly

San Francisco Fed President John Williams has said something that most bankers won’t say. He believes the current low inflation, low growth economy could continue indefinitely, if something isn’t done differently.
He writes in the FRBSF’s latest Economic Letter, “In the post-financial crisis world, however, new realities pose significant challenges for the conduct of monetary policy. Foremost is the significant decline in the natural rate of interest, or r* (r-star), over the past quarter-century to historically low levels.”

Graph: SF Fed

In his words, “battling low inflation and stagnation via unconventional monetary policy actions like quantitative easing and near-zero or even negative interest rates” isn’t working any longer. Because central bank interest rates have already declined to negative rates in many EU countries. It means the savers have to pay to keep their money in central banks, rather than central banks paying the savers.

Worldwide interest rates have been falling since 1980, dropping to zero inflation in the US in 2015. It means economic stagnation, as savers would rather pay to keep from using their savings, instead of investing said savings. This is surely not a sustainable state of affairs.

What is the answer? The Fed should firstly stop focusing over excessively on inflation targets, something I’ve been advocating in past columns. Their target rate of 2 percent is too low, since any significant economic growth requires higher than 2 percent inflation—more like 3 to 4 percent. The Bill Clinton era had inflation rates of 4 percent plus, that helped to give US 4 years of budget surpluses. Even retro-Reagan Prez GW Bush had to have 3 percent plus inflation to grow enough to pay for his wars and tax cuts.

Why do we need higher inflation? There isn’t enough demand being generated for new products and services that would generate higher growth and job formation. Governments, as well as wealthy individuals are hoarding their cash, rather than taking the risk of making new investments. It’s in part a prolonged reaction to excessive risk-taking that brought on the Great Recession.
“The underlying determinants for these declines are related to the global supply and demand for funds, including shifting demographics, slower trend productivity and economic growth, emerging markets seeking large reserves of safe assets, and a more general global savings glut (Council of Economic Advisers 2015, International Monetary Fund 2014, Rachel and Smith 2015, Caballero, Farhi, and Gourinchas 2016),” says Fed President Williams. “The key takeaway from these global trends is that interest rates are going to stay lower than we’ve come to expect in the past.”
One of his prescriptions for remedying this malaise of low inflation and economic stagnation in order to create longer-run growth and prosperity is what leading macro economists like Paul Krugman and Larry Summers have been pounding the pavement over for years--greater long-term investments in education, public and private capital, and research and development.
“Despite growing skepticism and endless column inches questioning whether college is worth the cost, the return on investment in post-secondary education is as high as ever (Autor 2014, Daly and Cao 2015). Likewise, returns on infrastructure and research and development investment are very high on average (Jones and Williams 1998, 2000, Fernald 1999),” says Williams
It means also a return to a Keynesian mode of thought and policies. Ways have to be found to entice this hoarded wealth back into circulation, as the New Deal policies of FDR did in the 1930s, and that created the modern infrastructure and standard of living we Americans experience today.

Let us hope more Central Bankers and US Fed Governors think as does Dr. Williams.

Harlan Green © 2016

Follow Harlan Green on Twitter: https://twitter.com/HarlanGreen

Monday, August 15, 2016

A return to Goldilocks Growth?

Financial FAQs

We could be back in the ‘goldilocks’ economy that was talked about several years ago. Growth is not too hot or too cold as we near full employment with very little inflation. It means the U.S. economy isn’t yet close to over-heating. In fact, the reason there is such low inflation is because GDP growth hasn’t been able to break out of the 2 percent range. And what will happen if it does?

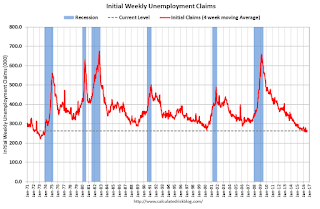
For starters, weekly initial jobless claims keep falling. “In the week ending August 6, the advance figure for seasonally adjusted initial claims was 266,000, a decrease of 1,000 from the previous week's revised level. The previous week's level was revised down by 2,000 from 269,000 to 267,000, according to the Labor Department.” There were no special factors impacting this week's initial claims. This marks 75 consecutive weeks of initial claims below 300,000, the longest streak since 1970, said the Labor Department.


And we are seeing almost no inflation. The retail Consumer Price Index is sticking to a 1 percent inflation rate of late and has been close to zero in the past year—which is scary. At any other time, it would be a sign of impending recession, but not in a economy close to full employment with more than 7 million still looking for full time work, and a BLS JOLTS report that says there are 5.6 million job openings.


Graph: Trading Economics

Why so little inflation with so many jobs being created? Low commodity prices, such as for oil, still at post-recession lows, are hurting the mining and energy sectors, which have laid off workers. The latest Producer Price Index for final demand has fallen to -0.2 percent year-over-year, and is up just 0.7 percent over the past year, even excluding food and energy prices.

Though most product costs come from labor costs, and the so-called Employment Cost Index has been barely rising. Compensation costs for civilian workers increased 2.3 percent for the 12-month period ending in June 2016, vs. 2.0 percent in June 2015, reports the Bureau of Labor Statistics. Wages and salaries increased 2.5 percent for the current 12-month period, vs. 2.1 percent for the 12-month period ending in June 2015.


Lastly, the so-called JOLTS report shows employment still expanding. The number of job openings was at 5.624 million on the last business day of June, up slightly from 5.514 million in May, the U.S. Bureau of Labor Statistics reported last week.

This is huge, with a total 5.1 million new jobs being created last month. The number of job openings is up 9 percent YoY, and the number of ‘Quits’ (those leaving their job voluntarily) is up 6 percent YoY, usually because they were able to find a better job, or are retiring.

So a goldlilocks-type economy is really a two-edged sword. Such low inflation means we aren’t able to return to the 3.2 percent average growth rate that has prevailed since WWII.

And we know why. Labor costs, which account for two-thirds of product costs, aren’t rising much above the inflation rate as most business profits are either saved or go to stockholders, rather than the employees who would spend it, thus putting the money back into circulation. It also means a large segment of the working population still lives at or below the poverty line.

Harlan Green © 2016

Follow Harlan Green on Twitter: https://twitter.com/HarlanGreen

Tuesday, August 9, 2016

The Clinton Growth Presidency

Popular Economics Weekly

It’s remarkable. Donald Trump chose Detroit to make his economic speech, where he accused the Clintons of causing Detroit’s employment problems with their trade policies.

Is he kidding? The Detroit Big Three automakers didn’t lose jobs because of trade pacts, but because of the Great Recession. They built the wrong size gas guzzling hogs at a time that consumers wanted smaller cars, so it was a government bailout that saved them. Trade pacts have hurt some workers, but benefited many more by bringing in new export-oriented, high tech jobs.

He is shooting at the wrong targets. He wants to bring back the old economy via a trade war with China, abolishing the minimum wage, suspending government regulations, and lowering tax rates; even the inheritance tax that only affects those with $5 million plus to pass on. But he says nothing about income inequality or the budget deficit, which can only be cured by concentrating on developing a new economy that brings in new jobs based on new technologies and a new environmental awareness.

It won’t do any good to accuse Obama of “failed economic policies” because those blue collar workers lost their jobs in the Midwest rust-belt states. Some 10,800,000 million jobs have been created during the Obama recovery years. President Obama is now in third place (purple line in graph) behind President Reagan in second (per yellow line) with 14,735,000 jobs created, and President Clinton (blue line) in first place with 21,000,000 jobs created during his 8 years.


Trump also proposed lowering the maximum corporate tax rate to 15 percent that he said would boost jobs and investments. Problem is, corporations have already hoarded some $4.5 trillion in cash and cash equivalent securities from their record profits they aren’t spending on anything but higher CEO salaries and stock buybacks that enrich corporate execs and their stockholders even more.

What about the slow economic recovery? It’s mostly due to poor economic conditions worldwide, such as caution due to Britain’s Brexit withdrawal, China’s slowdown, and plunging commodity prices that have hurt developing countries. But it’s also due to misplaced austerity policies that have restricted new investment in favor of cutting public spending in Europe and the U.S. because of the fear of ballooning budget deficits, when just the opposite is needed—investments that will increase jobs, and so tax revenues to pay down those deficits.

We really have only one model of successful deficit reduction since WWII—Bill Clinton’s. That is why Hillary has mentioned Bill’s record of record growth that created the most jobs of any presidency since WWII, and 4 years of actual budget surpluses. It was due primarily to defense spending cuts as the Soviet Union collapsed and a higher maximum tax rate (40 percent). The economy grew for 10 years—from 1991 to 2001, before the do-com bust and short recession that ended on November 2001, just 2 months after 9/11.

So Hillary proposes to equalize income inequality with a higher minimum tax rate of at least $12 per hour, and would support $15 per hour in higher priced regions, while raising taxes and closing tax loopholes of the wealthiest to pay for tuition-free public colleges, universal health care and paid maternity leave—something that the developed countries and most developing countries already have.

Hillary’s economic platform should enable US to catch up with what the rest of the world provides for their citizens, in other words.

Harlan Green © 2016

Follow Harlan Green on Twitter: https://twitter.com/HarlanGreen

Friday, August 5, 2016

255,000 Payroll Jobs, Economy Still Growing

Financial FAQs

Total nonfarm payroll employment rose by 255,000 in July, and the unemployment rate was unchanged at 4.9 percent, said the U.S. Bureau of Labor Statistics today. This confirms earlier reports from the manufacturing and service sectors that economic activity is strong.


It was a big surprise, as the change in total nonfarm payroll employment for May was revised from +11,000 to +24,000, and the change for June was revised from +287,000 to +292,000. Over the past 3 months, job gains have now averaged 190,000 per month.

So the US economy is much stronger than previously thought, in spite of the Brexit vote and European disunity over immigration. More than 400,000 additional workers entered the workforce, which kept the unemployment rate at 4.9 percent. Even governments added 38,000, in a sign that government spending is healthy again.

Job gains also occurred in professional and business services, health care, and financial activities. Energy was the only sector where employment continued to decline.  For instance, professional and business services added 70,000 jobs in July and has added 550,000 jobs over the past 12 months, said the report.

This is while the just reported ISM's non-manufacturing (i.e., service sector) composite index did slip 1.0 point to 55.5 but new orders rose in July, up 4 tenths to 60.3 for the best showing since October last year.


The ISM’s Manufacturing survey was also strong, though employment fell slightly as did delays in delivery times (which means less congestion, hence traffic). The July ISM index dropped to 52.6 vs June's 53.2. But the important news is once again, the new orders index, at 56.9 and pointing to future strength for employment.

Both reports showed continued growth, especially in new orders. So why the just reported weak GDP growth estimate in the second quarter of 1.2 percent, after even weaker 0.9 and 0.8 percent upticks in the last 2 quarters?
JP Morgan Chase President Jamie Dimon points to lack of public works spending, and timid private sector investing. “Dimon said the U.S. needs to focus more on long-term economic prospects, namely in the areas of immigration reform; proper infrastructure spending on roads, schools, and airports; and focusing on corporate tax reform as well as expanding the earned-income tax credit,” in a recent CNBC interview.
In fact, he believes GDP growth could increase to 4 percent, if such projects were funded. The energy slump is also a major reason, with oil prices back down to $40 per barrel. But this has boosted consumer spending and kept inflation low, as consumers account for some 70 percent of economic activity.

Factory orders aren’t yet reflecting this surge in new orders, as orders fell a sizable 1.5 percent in June following a downward revised 1.2 percent decline in May. Core capital goods (nondefense ex-aircraft) have been especially weak though orders did rise 0.4 percent in June. Shipments for this category, however, slipped 0.2 percent following a downward revised 0.7 percent decline in June in readings that will not boost revision estimates for second-quarter GDP.

So these results point to stronger GDP growth in the fall, and maybe into next year and a new President. Let us hope so, as both candidates have promised more public works projects, which should push the private sector to spend some of their huge and unspent profits for productive purposes, as well.

Harlan Green © 2016

Follow Harlan Green on Twitter: https://twitter.com/HarlanGreen

Tuesday, August 2, 2016

GDP Growth Still Below Average

Popular Economics Weekly

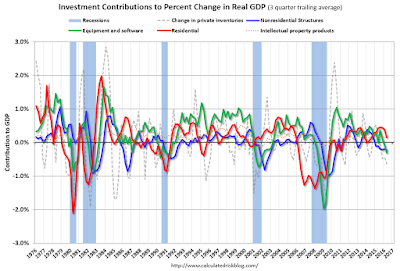
There is a reason second quarter Gross Domestic Product growth was so weak—up just 1.2 percent, after 0.9 and 0.8 percent upticks in the last 2 quarters. Pundits attributed it to the lack of capital expenditures, whereas consumer spending increased some 4.2 percent, which should mean a 3 percent annual growth rate, at least. But neither the private nor public sectors are investing much in future growth.
“The increase in real GDP in the second quarter reflected positive contributions from personal consumption expenditures (PCE) and exports that were partly offset by negative contributions from private inventory investment, nonresidential fixed investment, residential fixed investment, and state and local government spending. Imports, which are a subtraction in the calculation of GDP, decreased,” said the BEA announcement of last Friday.


Graph: Calculated Risk

Though Personal consumption expenditures (PCE) were up 4.2 percent vs. 1.6 percent in Q1, said the report, residential investment (RI) decreased at a 6.1 percent pace. Equipment investment also decreased at a 3.5 percent annualized rate, and investment in non-residential structures (i.e., commercial/industrial) decreased at a 7.9 percent pace due to the recent decline in oil prices.


It is also due to the lack of government spending. Public spending on such as infrastructure would employ millions and improve productivity, something both Presidential candidates say they want. Private sector growth should then follow, as even public works projects have to be built by private sector workers in private sector companies.

That is perhaps the major reason private sector corporations are investing less. There’s a lack of confidence in the future, what with Brexit maybe damaging future EU growth, and a certain Republican Presidential candidate threatening to blow up the US economy with massive tax cuts for the wealthiest, a trade war with the rest of the world, and no minimum wage increase.
Economist Dean Baker has said many times there is no secret to expanding employment and growth: “The point here is a simple one, we know how to get out a depression. It's called "spending money." We got out of the last Great Depression by spending lots of money on fighting World War II. But guess what, the economy doesn't care what we spend money on, it responds in the same way. So if we instead (of bailing out the banks with TARP) had spent 20 percent of GDP on building highways, housing, hospitals, and providing education and child care it also would have led to double-digit economic growth and below 3.0 percent unemployment.”
The consumer is healthy with the 4.2 percent spending increase, though consumers are saving much more these days, a result of growing incomes. Personal saving was $763.1 billion in the second quarter, compared with $847.8 billion in the first (revised). The personal saving rate -- personal saving as a percentage of disposable personal income -- was 5.5 percent in the second quarter, compared with 6.1 percent in the first, though it just dropped to 5.3 percent in this latest month.

Harlan Green © 2016

Follow Harlan Green on Twitter: https://twitter.com/HarlanGreen