Friday, February 23, 2018

Lower Inventory = Fewer Home Sales

The Mortgage Corner

WASHINGTON (February 21, 2018) — Existing-home sales slumped for the second consecutive month in January and experienced their largest decline on an annual basis in over three years, according to the National Association of Realtors. All major regions saw monthly and annual sales declines last month.

Total existing-home sales, which are completed transactions that include single-family homes, townhomes, condominiums and co-ops, sank 3.2 percent in January to a seasonally adjusted annual rate of 5.38 million from a downwardly revised 5.56 million in December 2017. After last month’s decline, sales are 4.8 percent below a year ago (largest annual decline since August 2014 at 5.5 percent) and at their slowest pace since last September (5.37 million).

Graph: Econoday
Lawrence Yun, NAR chief economist, says January’s retreat in closings highlights the housing market’s glaring inventory shortage to start 2018. “The utter lack of sufficient housing supply and its influence on higher home prices muted overall sales activity in much of the U.S. last month,” he said. “While the good news is that Realtors in most areas are saying buyer traffic is even stronger than the beginning of last year, sales failed to follow course and far lagged last January’s pace. It’s very clear that too many markets right now are becoming less affordable and desperately need more new listings to calm the speedy price growth.”
Total housing inventory at the end of January rose 4.1 percent to 1.52 million existing homes available for sale, but is still 9.5 percent lower than a year ago (1.68 million) and has fallen year-over-year for 32 consecutive months. Unsold inventory is at a 3.4-month supply at the current sales pace (3.6 months a year ago).

“Another month of solid price gains underlines this ongoing trend of strong demand and weak supply. The underproduction of single-family homes over the last decade has played a predominant role in the current inventory crisis that is weighing on affordability,” said Yun. “However, there’s hope that the tide is finally turning. There was a nice jump in new home construction in January and homebuilder confidence is high. These two factors will hopefully lay the foundation for the building industry to meaningfully ramp up production as this year progresses.”

First-time homebuyers are being squeezed because of the housing shortage, as just 29 percent were buyers, down from 32 percent last month.

The median existing-home price for all housing types in January was $240,500, up 5.8 percent from January 2017 ($227,300). January’s price increase marks the 71st straight month of year-over-year gains, according to the NAR.

New-home sales and construction are beginning to catch up with demand, but interest rates have to remain at their historic lows for this to continue. The 30-year fixed conforming rate is still 4.0 percent for 1 origination point, just 0.50 percent above its historic low. And several Federal Reserve Governors have said the Fed may not hike short term rates anytime soon, if inflation rates don’t move above the current 2 percent target rate.

Harlan Green © 2018

Follow Harlan Green on Twitter: https://twitter.com/HarlanGreen

Monday, February 19, 2018

Who Is Killing Our Children?

Popular Economics Weekly

The fact that the NRA contributed $30 million to Donald Trump’s campaign is all we need to know about who is responsible for deaths of 14 high school children and 3 adults in Florida, or the 58 killed and 851 wounded in Las Vegas.

What made the NRA the killing machine it has become, from the sporting association it once was? The NRA contributed a total of $55 million to 2016 presidential campaigns.

We can thank the Second Amendment of our Constitution that enshrined gun ownership as an unalienable right, and to Supreme Court Justice Antonin Scalia, who wrote the 2008 opinion in District of Columbia v. Heller that interpreted its original wording: “A well-regulated Militia, being necessary to the security of a free State, the right of the people to keep and bear Arms, shall not be infringed.” to mean every individual has the right to bear arms. But he added, that does not prevent the state from banning “dangerous and unusual weapons.”

We can also thank the gun manufacturers themselves that fund the lobbyists that keep Republican congressmen opposing all forms of gun control. We really should be talking about gun safety, rather than gun control, since gun owners aren’t required to have a license or training to own a gun, as is required for operators of other dangerous machines, like car owners.

We also know the carnage that guns can wreak. In 2016 alone there were more than 38,000 gun-related deaths, according to the Center for Disease Control. Just-released autopsy reports from the Las Vegas carnage show the damage done by military-style assault rifles at the Route 91 Harvest country music festival.

A military-style assault rifle bullet travels 3,000 feet per second—more than 3 times the speed of a pistol bullet because it is meant to kill instantaneously. It has such power that many bodies of the Las Vegas victims were literally torn apart by bullets that were probably tumbling by the time they reached the victims more than 500 yards away from Stephen Paddock, the Mandalay Bay Hotel’s 32nd story shooter.


Military-style assault rifles have been banned before; during the Tommy gun era of 1930’s gangster wars, and in 1994 after a series of similar mass shootings with semi-automatic weapons. But it had a ten-year sunset clause that was never renewed when Republicans again dominated Congress.

There have been 1600 mass shootings since the 2012 Sandy Hook massacre of elementary school children, according to Maureen Dowd.

When will American children again feel protected? When a Congress is elected that admits military-style, semi-automatic guns of all shapes and sizes are “dangerous and unusual weapons” needed only by those trained to use them—the police and members of our military.

Harlan Green © 2018

Follow Harlan Green on Twitter: https://twitter.com/HarlanGreen

Tuesday, February 13, 2018

2018 Housing Market To Stay Strong

The Mortgage Corner

Total existing-home sales, https://www.nar.realtor/existing-home-sales, which are completed transactions that include single-family homes, townhomes, condominiums and co-ops, increased 1.1 percent in 2017 to a 5.51 million sales pace and surpassed 2016 (5.45 million) as the highest since 2006 (6.48 million).

This is a sign that 2018 could be a record year for housing sales, in spite of the housing shortage that slowed sales in the fourth quarter, and builders hard put to find enough construction workers to ramp up housing construction.

The home ownership rate is back up to historical levels, for starters. Marketwatch’s Andrea Riquier reports the home ownership rate jumped in the fourth quarter of 2017 to 64.2 percent, the Census Bureau said Tuesday to a 3-month high, and in line with 1980 and 1990 averages, before rising into bubble territory in the 2000s.

There were 1.52 million more owner households compared to a year earlier, and 76,000 fewer renter households, according to Riquier. It hit an all-time high of 69.1 percent in 2004 as the housing bubble inflated. In the aftermath of the crisis, it skidded lower and lower, finally bottoming out at 62.9 Percent in 2016.


Lawrence Yun, NAR chief economist, says the housing market performed remarkably well for the U.S. economy in 2017, with substantial wealth gains for homeowners and historically low distressed property sales.
“Existing sales concluded the year on a softer note, but they were guided higher these last 12 months by a multi-year streak of exceptional job growth, which ignited buyer demand,” said Yun. “At the same time, market conditions were far from perfect. New listings struggled to keep up with what was sold very quickly, and buying became less affordable in a large swath of the country. These two factors ultimately muted what should have been a stronger sales pace.”


That’s in part because total housing inventory3 at the end of December dropped 11.4 percent to 1.48 million existing homes available for sale, and is now 10.3 percent lower than a year ago (1.65 million) and has fallen year-over-year for 31 consecutive months. Unsold inventory is at a 3.2-month supply at the current sales pace, which is down from 3.6 months a year ago and is the lowest level since NAR began tracking in 1999.

What about new-home construction? A surprising but perhaps one-time drop in single-family starts masks what is otherwise a very solid housing starts and permits report for December. Starts fell 8.2 percent to a 1.192 million annualized rate and reflect an 11.8 percent plunge in single-family starts to an 836,000 rate that far offsets a 1.4 percent gain in multi-family starts to 356,000. But it’s probably the cold weather and snows that reach all the down to Florida in January. Starts are affected by the winter weather which along with related adjustments are always factors for this reading.

But the backlog behind future starts continues to build as permits came in very strong, virtually steady at a 1.302 million rate and showing a noticeable 1.8 percent gain for single-family permits to 881,000. Lack of homes has been holding down new home sales though new supply did move into December's market, as completions for single-family homes jumped 4.3 percent to an 818,000 rate.

We mustn’t forget interest rates either, which are still low in spite of the stock market panic over the possibility of higher rates. Guess what? That’s not happening, especially with the Fed’s preferred PCE core index still at 1.5 percent, and mortgage rates for the 30-year fixed conforming rate still @ 4.0 percent, just 0.50 percent above its low.

Harlan Green © 2018

Follow Harlan Green on Twitter: https://twitter.com/HarlanGreen

Wednesday, February 7, 2018

What is a Common Sense Stock Market?

Financial FAQs

Pundits and stock traders seem to believe Friday and Monday’s stock “massacre” was caused by too-quick trigger fingers—in computers controlled by algorithms, not people.

Whereas, investors and traders using their common sense would have seen the ‘yuge’ drop in valuations made no sense for many of the S&P 500 stocks of the largest US corporations that were making record profits.  Then they might not have oversold their holdings, as happened to those with the trigger-finger algorithms.

For instance, Boeing’s common stock price dropped $20 in a day when news came out that its profits are increasing and there are predictions of large future cash flows from its booming airline and defense businesses. And corporations such as Boeing will be saving $billions in future taxes due to the lower corporate tax rate.

What about the rest of the economy? Stocks have historically been a prediction of future economic activity, since they are priced at a discount to future earnings. So the total annual return of capital gains plus dividends can be a prediction of a company’s financial health.

Nobel laureate economist Robert Shiller in his best-selling Irrational Exuberance, a historical analysis of stock and bond yields, says stocks have earned $7 per year on average in capital gains plus dividends, bonds 4 percent per year for the past 100 years

And Dr. Shiller said Price-to-earnings ratios, another measure of stock values, averaged 15 to 1 historically. Today, the S&P P/E ratio is 17, meaning 17 times earnings, which is high, but not that high. In fact, the stock P/E’s reached 26 times earnings just before the Great Depression, and an oxygen-deprived 44 times earnings in 2000 on the eve of the dot-com crash.

That was why Dr.Shiller and Fed Chairman Alan Greenspan sounded the alarm over the  irrational exuberance that was “infecting” investors at the time. Dr. Greenspan’s famous warning was given in 1996, four years before the 2000 crash, when he said: “But how do we know when irrational exuberance has unduly escalated asset values, which then become subject to unexpected and prolonged contractions as they have in Japan over the past decade?”

Japan has finally worked their way out of two decades of virtual deflation at a tremendous cost to growth, because of their spate of irrational exuberance. They now rank behind China and the European Union in the size of their economy.

Our stock market is in a similar circumstance today when too much money is chasing 50 percent fewer publicly listed stocks than in 1996, as I said in yesterday’s column. And there are already indications that corporations will be doing more of the same with the new tax savings.

But there is good news for employees. Friday’s unemployment report unveiled the largest pay increase in years. Average hourly earnings jumped to a year-on-year expansion best of 2.9 percent.  This is while the Fed’s core PCE inflation index is just 1.5 percent, way below its 2 percent stated target.

Graph: Econoday

Wages and salaries, the actual hourly incomes of normal working stiffs that excludes interest-bearing bank accounts, rental income, retirement benefits, stock dividends or annuities, actually rose year-on-year to 4.9 percent for its 5th straight climb and is now at its highest rate since November 2015.

And the just released JOLTS report of job hires and openings showed more workers quitting jobs voluntarily, which means they were finding better paying jobs. Job openings have slowed a bit, down 2.8 percent in December to 5.811 million, whereas Hires are steady, down fractionally in the month to 5.488 million. But that is keeping the spread between openings and hires also steady, at 323,000—which means 323,000 net job openings that haven’t been filled.

This might be why wages and salaries are finally increasing faster than the inflation rate, but it can also be that minimum wages in coastal states in particular are creeping toward $15 per hour by 2022, since 80 percent of the workforce depends on wages and salaries.

What should we make of the possibility of more irrational exuberance pushing stock valuations too high? Corporate profits will increase with the tax cuts, wages and salaries are soaring, and inflation is far away from the 2 percent target.

I believe investors should focus on price-to-earnings ratios, which also tell us whether stock prices have strayed too far from actual earnings.  Dr. Shiller warns irrational exuberance could infect investors again, if the S&P P/E ratio strays once more into the mid-twenties.

Harlan Green © 2018

Follow Harlan Green on Twitter: https://twitter.com/HarlanGreen

Monday, February 5, 2018

Why the ‘Yuge’ Stock Market Selloff?

Popular Economics Weekly

Stock indexes had the largest one-day drop in history today; what happened? The quick answer is that too much money is chasing too few stocks, believe it or not. The record low interest rates—the 10-year treasury yield just dropped back to 2.75 percent from 2.85 percent before Friday’s selloff—is an indication of the huge cash hoard held by corporations and Wall Street from the successive Quantitative Easing programs by Central Banks that have kept interest rates at record lows.

This is while a Credit Suisse report released last March titled “The Incredible Shrinking Universe of U.S. Stocks,” says between 1996 and 2016, the number of publicly-listed stocks in the U.S. fell by roughly 50 percent — from more than 7,300 to fewer than 3,600 — while rising about 50 percent in other developed nations.

Why do corporations and their Republican lobbyists keep pushing for lower taxes, as I said in an earlier column? They say it will create more jobs. But, alas, that isn’t shown by the record. An excellent New York Times Op-ed by Sarah Anderson at the Institute for Policy Studies points out that many corporations create very few jobs with those profits.

She reported on 92 public-held American corporations between 2008-15 that pay less than 20 percent in taxes. They had a median job growth rate of 1 percent vs. 6 percent for all private sector corporations during that time. And 48 of those companies actually cut 438,000 jobs, while their chief executives’ pay last year averaged nearly $15 million, compared with the $13 million average for all S&P 500 companies.

This should tell us who doesn’t use their profits to increase productivity and growth of their markets; as well as where corporate profits are spent; on stock buybacks that have reduced the number of outstanding publicly listed shares to enhance stockholder returns and CEO paychecks.

It means huge swings in stock prices from too much money chasing too few stocks, should traders panic; which is what they did today and Friday. Yet the panic selling had no underlying reason. Factory orders and the service sector economy is growing even faster than last year while the unemployment rate is still stuck at 4.1 percent and maybe going lower as fewer unemployed workers are even available to fill jobs.

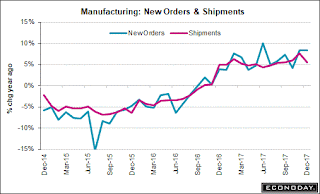
The year-on-year growth for durable orders in the factory sector which has been sloping higher, is now 11.5 percent in December from 8.7 percent in November. This a sign that manufacturing growth is still trending higher, while the ISM non-manufacturing index is at an almost all-time high of 59; which means 59 percent of those surveyed see increased growth in the service sector.


The ISM non-manufacturing sample is also reporting some of the very best conditions in the 20-year history of this series, reports Econoday and the ISM. New orders are arguably more important than any composite result and the reading, at 62.7, is back at last year's peak. Employment is a special standout, up more than 5 points to a very rare plus 60 score of 61.6 which is by the far the best of the post-2008 expansion.

So what to make of the 'yuge' selloff? Some traders are saying it was a series of electronic trading “glitches” that sent prices plunging for no economic reason, and stock prices fall below their intrinsic valuations. Algorithms were at fault on selling billions of shares on the click of a button that had been pre-programmed to sell when prices dropped to a certain level, while other algorithms were programmed not to buy while stocks continued to fall.

It meant computers were chasing each other’s tails; as if they had them. That’s what happens when algorithms rule over common sense, and traders lose their common sense.

Harlan Green © 2018

Follow Harlan Green on Twitter: https://twitter.com/HarlanGreen