Showing posts with label Case-Shiller housing price index. Show all posts

Wednesday, March 29, 2023

Homebuyers Already on the Move

 The Mortgage Corner

The home-buying season has begun earlier this year from a large rise in existing-home and new-home sales. It looks like families are already on the move, including retirees and seniors downsizing to more humble quarters.

Calculated Risk

Why? Housing pricing are finally declining in some regions in concert with lower mortgage rates (see above Case-Shiller graph). Homebuyers must be thinking interest rates have topped and the Fed rate hikes will end sometime this summer.

“I’m quite surprised,” Lawrence Yun, chief economist at the National Association of Realtors said. “The recovery is coming stronger, [but] maybe it will deflate again if the mortgage rates get too high… [and] mortgage rates have a very big influence.”

Baby boomers now make up 39 percent of home buyers (ages 58 to 76 years old) – the most of any generation – an increase from 29 percent last year, said the NAR, in its press release.

Maybe rising consumer confidence is another reason home sales are up. The Conference Board's consumer confidence index rose to 104.2 this month from a reading of 103.4 in February.

The cutoff date for the confidence survey was March 20, 10 days after California-based Silicon Valley Bank collapsed. New York-based Signature Bank failed on March 12, said the Conference Board, so the fact that jobs were plentiful seemed to outweigh banking worries.

And housing prices are stabilizing. “The MoM decrease in the seasonally adjusted Case-Shiller National Price Index was -0.25%. This was the seventh consecutive MoM decrease, and a slightly smaller decrease than in December,” said Bill McBride, quoting its press release.

The biggest surprise was that existing-home sales jumped 14.5 percent in February to a seasonally adjusted annual rate of 4.58 million, snapping a 12-month slide and representing the largest monthly percentage increase since July 2020 (+22.4 percent). Compared to one year ago, however, sales will still down 22.6 percent.

Calculated Risk

Downward price pressure also came from increasing inventories of for sale residences. The total existing-home inventory registered at the end of February grew to 980,000 units, identical to January and up 15.3 percent from one year ago (850,000). Unsold inventory sits at a 2.6-month supply at the current sales pace, up from 1.7 months in February 2022 when the price surge began.

Mortgage rates are also declining along with Treasury security yields, down approximately down -0.50 percent. I spotted a 6 percent rate on a 30-year conforming fixed rate mortgage with low origination points recently, down from 6.50 two weeks ago.

Not so surprising is that twenty-six percent of all buyers were first-time buyers, the lowest since NAR began tracking the data and a decrease from 34 percent last year.

Another sign that the selling season has begun was pending home sales that measure contracts signed but not closed, increased for the third month in a row.

“After nearly a year, the housing sector’s contraction is coming to an end,” said chief economist Yun. “Existing-home sales, pending contracts and new-home construction pending contracts have turned the corner and climbed for the past three months.”

So when will conditions improve for first-timers again? When the Fed reverses course and interest rates decline for real, which I’ve been calling for. New-home inventory is now matching existing-home inventory, which means builders are catching up, maybe in preparation for a more hopeful summer season.

Harlan Green © 2023

Follow Harlan Green on Twitter: https://twitter.com/HarlanGreen

Monday, November 28, 2022

Record Amount Housing Under Construction

 The Mortgage Corner

Calculated Risk

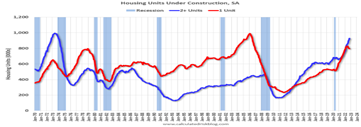
There are a record number of housing units under construction, in part because of pandemic delays in construction (e.g., material shortages), but also because home sales have fallen sharply since the Fed’s rate hikes.

This is causing housing prices to moderate, a leading sign that inflation will also begin to decline more steeply.

Calculated Risk’s Bill McBride says that last week, the National Association of Realtors® (NAR) reported that median house prices were up just 6.6% year-over-year (YoY) in October. This is down from the peak growth rate of 25.2% YoY in May 2021.

And, Case-Shiller reported that the National Index was up 13.0% YoY in August, down from a YoY peak of 20.8% in March 2022.

This hasn’t stopped builders, who seem to be anticipating higher home sales next year. This should also moderate housing prices that have been rising in double digits until recently.

Privately‐owned housing starts in October were at a seasonally adjusted annual rate of 1,425,000, according to the Census Bureau. This is 4.2 percent below the revised September estimate of 1,488,000 and is 8.8 percent below the October 2021 rate of 1,563,000. Single‐family housing starts in October were at a rate of 855,000; this is 6.1 percent below the revised September figure of 911,000. The October rate for units in buildings with five units or more was 556,000.

Apartment construction is out distancing single-family construction because so many cannot afford to purchase in this interest rate environment. The 30-year conforming fixed rate is still hovering around 6 percent and the 5-year fixed rate ARM at 5.5 percent making it slightly more affordable.

Existing-home sales faded for the ninth month in a row to a seasonally adjusted annual rate of 4.43 million, according to the NAR. Sales fell 5.9% from September and 28.4% from one year ago. Prices are moderating, with the median existing-home sales price up to $379,100, an increase of just 6.6% from the previous year, vs. double digits raises in the past year.

Another reason for the high construction inventory is that the inventory of unsold existing homes is still low historically. It slipped for the third consecutive month to 1.22 million at the end of October, or the equivalent of 3.3 months' supply at the current monthly sales pace, when it is 4-6 months during normal times.

"Inventory levels are still tight, which is why some homes for sale are still receiving multiple offers," Yun added. "In October, 24% of homes received over the asking price. Conversely, homes sitting on the market for more than 120 days saw prices reduced by an average of 15.8%."

Much also will depend on the Fed’s actions. It’s a tossup just where interest rates will be next year. The Fed’s latest minutes telegraphed smaller rate hikes looming as inflation subsides and Nobelist Paul Krugman has been saying that he doesn’t see interest rates remaining high over the longer term as producers continue to ramp up production to meet the supply shortages.

Neither do home builders, apparently. There is still a tremendous pent-up demand for housing, whether it’s rentals or owner-occupied, as builders are also playing catchup from the supply shortages caused by the busted housing bubble.

This should make any recession caused by the Fed’s rate hikes short and mild.

Harlan Green © 2021

Follow Harlan Green on Twitter: https://twitter.com/HarlanGreen

Thursday, January 6, 2022

Are Home Prices Moderating?

 The Mortgage Corner

There are small signs of a slowdown in the rise of housing prices. Core Logic, a real estate data provider, sees some moderation in this New Year.

“As we close 2021, housing market indicators, including S&P CoreLogic Case-Shiller Index, suggest that the housing market will have another strong year in 2022. While the expected slowing of home price growth suggests overall annual appreciation in 2022 will fall shorter than that of 2021, the annual average of 7% is still higher than the average 5% seen between 2010 and 2020.”

CensusBureau-CalculatedRisk

Housing’s annual price appreciation is slowing in part because new construction is making up some of the housing shortage.

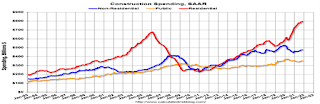
Calculated Risk reports that on a year-over-year basis, private residential construction spending is up 16.3% (red line in graph). Non-residential spending is up 6.7% year-over-year. Public spending is down 0.8% year-over-year.

This is resulting in single‐family housing starts in November to jump 11.3 percent above the revised October figure of 1,054,000.

But inventories are still at rock bottom, with unsold inventory at a 2.1-month supply in November, the lowest since January. That’s even lower than 2.3 months in the same month last year, and a 4-to-6-month supply of homes for sale during more normal times.

That is making NAR chief economist Lawrence Yun cautious about affordability in the New Year:

"Buyer competition alone is unrelenting, but home seekers have also had to contend with the negative impacts of supply chain disruptions and labor shortages this year," he said. "These aspects, along with the exorbitant prices and a lack of available homes, have created a much tougher buying season."

How long could it take for the supply of homes available to purchase catch up the demand? It depends on when more working age adults return to the workforce and suppply chains become unchained.

The labor shortages may improve this New Year. As a predictor of Friday’s unemployment report private payrolls rose by 807,000 in December, according to the ADP National Employment Report released Wednesday. That’s the strongest gain since May.

Service sector providers added 669,000 jobs in December. Leisure and hospitality added 246,000 workers. Meanwhile, goods producers added 138,000 jobs, the strongest gain of the year. Manufacturing added 74,000 jobs.

This could begin to improve the housing supply.

Then we must wait for the supply-chains to recover as countries ramp up production and the various trade tariffs are reduced that have driven up the cost of building materials, with lumber prices still higher than in pre-pandemic times.

Harlan Green © 2022

Follow Harlan Green on Twitter: https://twitter.com/HarlanGreen
Tuesday, August 30, 2016

US Consumers Happy Again

Popular Economics Weekly

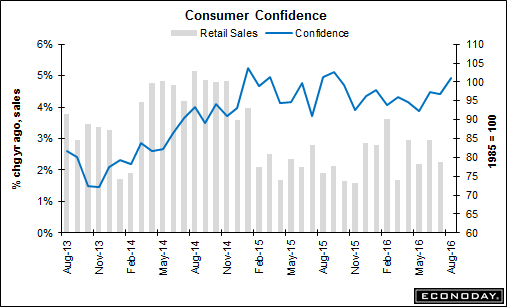
US consumers are feeling good, with higher confidence and rising wages pushing demand for housing and consumer spending. The Conference Board’s Consumer Confidence Index rose a huge 4.4 points to 101.3 in August. It has been hovering in this range for more than one year, reflecting the strong jobs market.


“Consumer confidence improved in August to its highest level in nearly a year, after a marginal decline in July,” said Lynn Franco, Director of Economic Indicators at The Conference Board. “Consumers’ assessment of both current business and labor market conditions was considerably more favorable than last month. Short-term expectations regarding business and employment conditions, as well as personal income prospects, also improved, suggesting the possibility of a moderate pick-up in growth in the coming months.”
And consumer spending is reflecting that optimism. Consumer spending last month was lifted by a 1.6 percent surge in purchases of long-lasting manufactured goods such as automobiles. Spending on services rose 0.4 percent, but outlays on non-durable goods slipped 0.5 percent (such as food and clothing).

Personal income increased 0.4 percent in July after rising 0.3 percent in June. Wages and salaries advanced 0.5 percent. This is while savings rose to $794.7 billion from $776.2 billion in June, still a 5 percent savings rate, which means consumers are saving for the possibility of another rainy day.

Who can blame consumers for being cautious? But with housing markets taking off, it looks at long last that housing supplies are returning to normal. The Case-Shiller Home Price Index is now rising a more normal 5 percent per year, down from its recent 10 percent rise in 2013-14, as more housing comes on the market.


In boom cities like Portland and Seattle prices rose 12.6 and 11 percent, respectively, while Denver and Dallas were some 9 percent higher in June. Cities that suffered the most from the bust are also recovering in such areas as California’s Central Valley and San Francisco’s East Bay; cities such as Stockton and Vallejo that filed for bankruptcy because of the housing bust.

So what has been keeping economic growth in the 1 percent range of late, over the last 3 quarters? Most of it comes from a slowdown in labor productivity due to businesses’ refusal to invest in capital improvements. Labor productivity is at a historic post WWII low, increasing just 1.3 percent since the Great Recession, as I said last week. Normally, so-called cap-ex spending should also surge after such a downturn for production to catch up with depleted inventories, but it hasn’t this time.

Instead, corporations have been using their record profits to buy back stock, enhancing their own and stockholders incomes, a major cause also for the record income inequality. That has to change, needless to say, if voters have anything to say in the upcoming elections.

Harlan Green © 2016

Follow Harlan Green on Twitter: https://twitter.com/HarlanGreen
Thursday, January 28, 2016

More Jobs = Higher Consumer Optimism = More Housing


Twenty Five states had lower unemployment, reports the Bureau of Labor Statistics, as the economic recovery continues.  That is probably why consumers continue to be optimistic and housing prices continues to soar—as high as 11 percent in Portland, San Francisco, and Denver, reports the latest S&P Case Shiller Housing Price Index.


Graph: Calculated Risk

            Only 8 states, from New Mexico to Louisiana, now have more than 6 percent unemployment.  Even energy-dependent states like Oklahoma and Texas are at less than 5 percent unemployment.
            The S&P/Case-Shiller U.S. National Home Price Index, covering all nine U.S. census divisions, recorded a slightly higher year-over-year gain with a 5.3 percent annual increase in November 2015 versus a 5.1 percent increase in October 2015. The 10-City Composite increased 5.3 percent in the year to November compared to 5.0 percent previously. The 20-City Composite’s year-over-year gain was 5.8 percent, up from 5.5 percent reported in October.


This hardly puts housing prices in bubble territory.  They rose more than 10 percent in 2014, before dipping back to the current increases.  And it is putting pressure on the housing inventory, now down to a 3 months’ supply for new housing.  So look for a continued surge in housing construction this year, which gives another boost to overall growth.


            Builders broke ground on 1.11 million homes in 2015, more than at any point since 2007, according to a recent UBS study. That was an 11 percent gain compared to 2014. The consensus view of 1.25 million that UBS cites would represent a 13 percent gain in 2016. Their own forecast is for 1.31 million starts, an 18 percent jump.
            The result is more new home sales, as sales ran at an annual pace of 544,000, the highest since February, the Commerce Department said Wednesday. November’s previously-reported 490,000 pace was revised up to 491,000.  In all, some 501,000 new homes were sold during 2015, Commerce said, a 14.5% increase over 2014’s tally.
            Consumer spending may not be that strong but consumer confidence is solid, at 98.1 in January, says The Conference Board. “Consumer confidence improved slightly in January, following an increase in December,” said Lynn Franco, Director of Economic Indicators at The Conference Board. “Consumers’ assessment of current conditions held steady, while their expectations for the next six months improved moderately. For now, consumers do not foresee the volatility in financial markets as having a negative impact on the economy.”
            Is this a good sign for future employment?  That depends if consumers continue to spend.  Retail sales have dipped below 4 percent annually in 2015, and the stock market is particularly volatile due to the uncertainty over energy prices.  But this has not affected the mood of consumers, yet. 

Harlan Green © 2016

Follow Harlan Green on Twitter: https://twitter.com/HarlanGreen
Tuesday, August 25, 2015

Record Post-Recession Home Sales, Construction, Case-Shiller Prices in July

The Mortgage Corner

With all the bad news coming from the stock market, it’s good to know that this hasn’t affected the housing market. In fact, it’s pushing interest rates lower, so that a conforming 30-year fixed mortgage rate has dropped to 3.50 percent in California. And that will continue to boost home sales (and prices, of course). That’s why Case-Shiller shows two cities already above their bubble highs, and the Conference Board’s Index of Leading Economic Indicators (LEI) shows continued strong growth ahead.

Total existing-home sales, which are completed transactions that include single-family homes, townhomes, condominiums and co-ops, increased a whopping 2 percent to a seasonally adjusted annual rate of 5.59 million in July from a downwardly revised 5.48 million in June. Sales in July remained at the highest pace since February 2007 (5.79 million), have now increased year-over-year for ten consecutive months and are 10.3 percent above a year ago.

image

Graph: Econoday

Lawrence Yun, NAR chief economist, says the increase in sales in July solidifies what has been an impressive growth in activity during this year's peak buying season. "The creation of jobs added at a steady clip and the prospect of higher mortgage rates and home prices down the road is encouraging more households to buy now," he said. "As a result, current homeowners are using their increasing housing equity towards the downpayment on their next purchase."

And demand is well ahead of thin supply, at 4.8 months at the current sales rate vs 4.9 and 5.1 in the two prior months and 5.6 months in July last year. Sales are up 10.3 percent year-on-year, well ahead of the median price which, at $234,000, is up 5.6 percent.

The S&P/Case-Shiller U.S. National Home Price Index recorded a higher year-over-year gain with a 4.5 percent annual increase in June 2015 versus a 4.4 percent increase in May 2015. The smaller 10-City Composite had marginally lower year-over-year gains, with an increase of 4.6 percent year-over-year. Denver and Dallas are the two cities now above their 2007 bubble highs, while Denver (+10.2%), San Francisco (+9.5%) and Dallas (+8.2%) had the biggest year over year increases.

image

Graph: Calculated Risk

This mismatch of supply vs. demand means even higher existing-home prices ahead. Especially since housing construction is just beginning to play catch up after years of low growth—no coincidence, given the rising demand for housing of any kind—rental as well as for prospective homeowners. Led by a strong jump in single-family production, nationwide housing starts inched up 0.2 percent to a seasonally adjusted annual rate of 1.206 million units in July, according to newly released data from the U.S. Department of Housing and Urban Development and the Commerce Department. This is the highest level since October 2007.

It’s also why the Conference Board’s Index of Leading Economic Indicators (LEI) continues to show moderate growth for the next 6 months, and is up 1.7 points from January to July. “The U.S. LEI fell slightly in July, after four months of strong gains. Despite a sharp drop in housing permits, the U.S. LEI is still pointing to moderate economic growth through the remainder of the year,” said Ataman Ozyildirim, Director of Business Cycles and Growth Research at The Conference Board.

Swings in housing permits have been distorting recent LEI readings including for July. Permits, which fell 16 percent in Tuesday's housing starts report, more than offset what are a run of mostly neutral readings among other components. Given the uncertainties of measuring housing data (readings with plus or minus 11 percent variations are common) the index could have added another 0.54 points to the July indicator, instead of subtracting that amount, for a much stronger reading.

The strongest component is the rate spread which reflects the Fed's ongoing accommodative policy. Also pointing to strength are initial jobless claims, which are at rock bottom lows, and the report's credit index which points to a rise ahead for lending.

So what’s happening in China and the so-called emerging markets (including the Petro states, and Russia) will help to keep interest rates low, housing strong, and maybe the Fed from raising their short-term rates for some time to come.

Harlan Green © 2015

Follow Harlan Green on Twitter: https://twitter.com/HarlanGreen

Tuesday, May 26, 2015

New-Home Sales, Case Shiller Index On the Rise

The Mortgage Corner--II

As if to confirm U.S. housing starts and building permits’ jump to their highest levels in nearly 7-1/2 years, the sales rate of new single-family houses in April 2015 rose even higher at a seasonally adjusted annual rate of 517,000, according to estimates released jointly today by the U.S. Census Bureau and the Department of Housing and Urban Development. “This is 6.8 percent above the revised March rate of 484,000 and is 26.1 percent above the April 2014 estimate of 410,000,” per the Census Bureau.

image

Graph: Calculated Risk

It means home construction is returning to pre-recession levels, as is the demand for more housing, which will spur more housing construction. The sales rate is rising fast enough to drop housing inventories to 4.6 months, at the low end of inventories.

The south was the biggest gainer, with construction up 5.8 percent. Also, the median price rose to $297,300 for a strong 8.3 percent year-on-year gain. So sales have finally reached the long term trend line, which should signal a longer term recovery as buyer’s enthusiasm tends to feed on itself, according to Behavioral Economist and Nobelist Dr. Robert Shiller.

image

Graph: Calculated Risk

As if to confirm the rising enthusiasm of buyers, the S&P Case-Shiller Home Price Index continued its climb to post-recession highs, with San Francisco now up 10.31 percent year over year, Denver and Dallas up 10 percent and 9.3 percent, respectively. Denver and Dallas housing prices have almost doubled since the Great Recession, per the above graph. San Francisco’s prices are just now approaching their bubble high.

“Home prices have enjoyed year-over-year gains for 35 consecutive months,” says David M. Blitzer, Managing Director & Chairman of the Index Committee for S&P Dow Jones Indices. “The pattern of consistent gains is national and seen across all 20 cities covered by the S&P/Case-Shiller Home Price Indices…”

Of course lower interest rates were also a factor, as I’ve said, with housing affordability increasing this year, according to the National Association of Home Builders/Wells Fargo Housing Opportunity Index (HOI).

In all, 66.5 percent of new and existing homes sold between the beginning of January and end of March were affordable to families earning the U.S. median income of $65,800, said the report. “This is up from the 62.8 percent of homes sold that were affordable to median-income earners in the fourth quarter.”

What is another catalyst? Housing formation is recovering, which is largely due to Millennials moving out of their parents’ homes, or higher education venues. Based on unusually low household formation numbers of past several years, "there's a ton of people living in basements," Fundstrat Global Advisors' Tom Lee said in a recent interview with CNBC's "Trading Nation." "Two quarters of pretty decent household formation isn't getting everybody out of the basement. I think this means we have multiple years where household formations are well over 1.3 million, 1.4 million."


Household formation will be the key to future housing growth, as the millenials’ population size has now reached that of the baby boomers, their parents. And many have yet to reach home-buying age. Household formation had dipped as low as 360,000 per annum in recent years, due to the housing bust. So this is yet another sign of a growing pool of homebuyers.

Harlan Green © 2015

Follow Harlan Green on Twitter: https://twitter.com/HarlanGreen

Thursday, April 2, 2015

Housing In Recovery-Pending Home Sales Soar

The Mortgage Corner

February Pending Home Sales Index, a forward-looking indicator based on contract signings, rose 3.1 percent to 106.9 in February from a slight downward revision of 103.7 in January and is now 12.0 percent above February 2014 (95.4). The index is at its highest level since June 2013 (109.4), has increased year-over-year for six consecutive months and is above 100 – considered an average level of activity – for the 10th consecutive month.

This is while new U.S. homes sold at an annual rate of 539,000 in February to mark the best month of sales in seven years, the government reported Tuesday. The pace of sales for January was also revised up sharply to 500,000. It's the first time annualized sales have hit 500,000 or more for two straight months since early 2008, as we said last week.

NAR chief economist Lawrence Yun, says demand appears to be strengthening as we head into the spring buying season. “Pending sales showed solid gains last month, driven by a steadily-improving labor market, mortgage rates hovering around 4 percent and the likelihood of more renters looking to hedge against increasing rents,” he said. “These factors bode well for the prospect of an uptick in sales in coming months. However, the underlying obstacle – especially for first-time buyers – continues to be the depressed level of homes available for sale.”

In fact, the 30-year conforming fixed rate is in the mid-3 percent range today in California, and hovering near its all-time low.  Even better news is, according to NAR’s monthly Realtors® Confidence Index, the percent share of first-time buyers increased slightly for the first time in February since November 2014, up to 29 percent from 28 percent in January. But such good news may not last, as the depressed level of inventories is continuing to boost home prices, making homes less affordable for those first-timers.

image

Graph: Calculated Risk

The Case-Shiller Home Price Index reports that home prices are firming as the Case-Shiller composite-20 index rose 0.9 percent in January following a 0.9 percent gain in December and a 0.8 percent rise in November. This is the strongest streak for this report since late 2013, and gives us more evidence of the need for more inventory. Year-on-year, however, prices are still on the soft side, up only 4.6 in January and only fractionally higher than the prior two months.

The increase in mortgage applications is another sign that home sales may be increasing this selling season, probably due to the low interest rates. The seasonally adjusted Purchase Index increased 6 percent from one week earlier. ... The unadjusted Purchase Index ... was 8 percent higher than the same week one year ago.

image

Graph: Calculated Risk

“There was a broad based increase in mortgage applications last week relative to the week prior. The increase in purchase volume was led by a nearly 6 percent increase in both conventional and government markets, perhaps signaling that households are finally ready to begin the home-buying season,” said Lynn Fisher, MBA’s Vice President of Research and Economics.

The rise in the share of first time home buyers is not a huge change but may predict more millennials of the Generation Y cohort aged 18-36 years, entering the housing market that have been renting until now. “Several markets remain highly-competitive due to supply pressures, and Realtors are reporting severe shortages of move-in ready and available properties in lower price ranges,” adds Yun. “The return of first-time buyers this year will depend on how quickly inventory shows up in the market.”

So still record low interest rates have to be a major reason both refinance and purchase loan activity has picked up. Conforming 30-year fixed rates are as low as 3.375 percent in California for 1 origination point. This is the rate that prevailed during the Fed’s QE purchase program more than one year ago. It has to be thanks to Fed Chairwoman Janet Yellen who has been unrelenting in her opposition to any interest rate increases until she sees sustainable growth and rising wages.

Harlan Green © 2015

Follow Harlan Green on Twitter: https://twitter.com/HarlanGreen

Wednesday, January 7, 2015

Good Pending Sales, Home Prices in 2015

The Mortgage Corner

Pending home sales are rising again. Sales picked up steam in November, to 104.8 from a revised 104.0 in October for a better-than-expected gain of 0.8 percent. It is a sign, along with the Case-Shiller Home Price Index, that the housing market will pick up in 2015.

image

Graph: Econoday

Pending sales had been declining since last September, and only began to rise again this January. But they are still below post-recession highs. Rising prices may be the culprit, as the Case-Shiller Home Price Index rose 13.5 percent in 2014, but has now settled back to moderate 4.5 percent annual increases in recent months.

"The consistent economic growth and steady hiring we've seen the second half of this year is giving buyers enough assurance to consider purchasing a home before year's end," said NAR chief economist Lawrence Yun. "With rents now rising at a seven-year high, historically low rates and moderating price growth are likely to entice more buyers to enter the market in upcoming months."

image

Graph: Econoday

Where are those new buyers coming from? The main reason could be fresh data that show those 18 to 25 year-olds are finally leaving home, or school, when the lack of first-time homebuyers has kept existing-home sales from breaking out of a narrow range since 2009 and the end of the Great Recession. This is while housing prices have moderated their double-digit climb in 2014, making housing more affordable to those now able to find jobs.

Case-Shiller's 20 city year-on-year index for October (both adjusted and unadjusted) came in soft, at plus 4.5 percent, says Econoday, down 3 tenths from September. This is the lowest rate since October 2012 and follows a full year of low double digit gains through much of 2013 and into April this year.

So ‘the times they are a changin’. Household formation is increasing again, and history says at least 50 percent of those new householders will purchase a home. Fortune Magazine has just cited Neil Dutta, head of economics at Renaissance Macro Research, who pointed out in a note to clients that household formation in 2014 through September is already at its highest rate since 2005.

image

Graph: Fortune.com

The employment rate for folks aged 25 to 34 has grown 2.8 percent over the past year, about 29 percent faster than the overall employment rate, and they make up the largest generation ready to enter the housing market, larger than their baby boomer parents.

And don’t forget those record low interest rates, now back to last year’s pre-April rates, before Fed Chair Bernanke announcement that QE3 would end. The 30-year fixed conforming rate is now down to 3.50 percent with 0 origination points in California, for those with the best credit scores.

Harlan Green © 2014

Follow Harlan Green on Twitter: https://twitter.com/HarlanGreen

Wednesday, December 31, 2014

What Will 2015 Bring?

Popular Economics Weekly

We already have an idea of what will happen in 2015. Firstly, job creation should continue to exceed 300,000 payroll jobs per month. Nobelist Paul Krugman is especially optimistic about economic growth, given that we have escaped much of the austerity budget cuts taken by the Eurozone and Japan.

“What about the prospects looking forward? As I’ve pointed out before, business investment has been relatively strong throughout. Residential investment, however, has been very low since 2006, suggesting that there’s a backlog of pent-up demand, which should come into play in an improving job market. So that’s one source of strength. Also, low oil prices are going to be mostly positive, although with some adverse regional effects; more on that in a later post.”

image

Graph: Trading Economics

We would also posit that current economic growth will remain high in 2015, following consecutive 4.6 and 5 percent growth rates in Q2 and Q3. This is because government hiring will continue to pick up as effects of the Great Recession wear off, which has been the main drag on growth, as Professor Krugman says.

"Since Obama took office, we’ve gained 6.7 million private-sector jobs, compared with just 3.1 million at the same point under Bush. But under Bush we’d added 1.2 million public sector jobs, while under Obama we’ve cut 600,000. The point is that relatively good private sector performance has been masked by public-sector cutbacks; this is the opposite of what you usually hear, but that’s no surprise.”

And Fed Chair Janet Yellen is determined to keep interest rates low until wage and salaries climb above the 2 percent inflation rate, which might happen in 2015 with continuing strong job growth.

The weak growth link remains the housing market, and any improvement will be closely watched by economists. The key will be adequate population growth (with more new household formation), especially from the millennials, children of the baby boomers as we have been saying.

Several housing specialists, including the NAR’s Realtor.com, Jed Kolko of Trulia.com, and even Robert Shiller of the Case-Shiller Housing Price Index see a better housing market in 2015. But increased household formation of those millennials that have been living with their parents, or renting, are the key. And 2015 looks to be the year when they begin to buy homes, according to Fortune Magazine’s Fortune.com. Historical household formation has been some 1 million new households per year, but has been less than half the historical average since the end of the housing bubble.

image

Graph: Fortune

Why? Millennials job growth, for one: “In 2014, it’s been a banner year for employment but parsed by age groups those under 35 have been gaining jobs at a 60 percent faster rate than rest – one of the best years for employment was even better for millennials,” said Realtor.com economist Jonathan Smoke in his recent release of the 2015 housing forecast.

And the oldest cohort of 25-34 puts the majority of millennials out of school and getting married. That’s combined with birth rates putting 2014 in the running for highest volume of births in years, as millennials outnumber their baby boomer parents by as much as 10 percent (as much as 88 million vs. 77 million baby boomers).

We will see what else 2015 brings, of course. More new, entry-level homes will have to be built, of course, so builders have to get the message that millennials won’t be able to afford the homes and higher prices tolerated by their parents.

There are indications that home builders are already doing this. For example, CNBC’s Diana Olick reports homebuilder D.R. Horton has a new brand, Express Homes that offers properties at $120,000 to $150,000 in lower priced states such as Texas and Georgia, well below the national median price of a new home, which in March came in at a record $290,000, according to the U.S. Census.

In other words, if and when housing returns to normal growth levels, we should see more sustained overall economic growth for 2015 and beyond.

Harlan Green © 2014

Follow Harlan Green on Twitter: https://twitter.com/HarlanGreen

Wednesday, October 29, 2014

Consumer Confidence Soaring, Case-Shiller Home Prices Unchanged

Popular Economics Weekly

Why are stock prices rallying?  Maybe it’s because though housing price increases have slowed, consumer confidence is soaring for the holidays.  The prospect for future job and income growth looks good, in other words

Home prices contracted for a 4th straight month in August in Case-Shiller 20-city data, down 0.1 percent vs expectations for a gain of 0.1 percent. This is while consumer confidence rose to a post-recession high, a good sign for increased holiday spending.

Month-to-month prices declined in just 3 of the 20 cities, monthly—Charlotte, NC, San Diego, and San Francisco—with San Francisco, Las Vegas and Miami prices up the most year-over-year.

So though the 20-city monthly average fell sharply, annual year-on-year overall prices are still a plus 5.6 percent from plus 6.7 and 8.0 percent in the two prior months for the 20-city index. The 5.6 percent rate is the lowest since November, says Econoday.

image

Graph: Econoday

This is while the Conference Board’s Consumer Confidence Index for October is at a new recovery high of 94.5, up from an upwardly revised 89.0 in September and surpassing the previous recovery high of 93.4 in August. The last time the index reached this level was in October 2007, right at the beginning of the Great Recession.

image

Graph: Econoday

October's gain is concentrated almost entirely in the expectations component, which jumped 8.6 points to 95.0 in a reading that is close to February 2011's 97.5. The strength in expectations reflects optimism in the outlook for both jobs and income, both of which show convincing gains in this month's report.

Despite improved housing conditions and low interest rates (as low as 3.625 percent for the conforming 30-yr fixed rate today), tight credit conditions continue to be a barrier for some buyers, as we have said in past columns. Of the reasons for not closing a sale, about 15 percent of Realtors in September reported having clients who could not obtain financing, reports the NAR.

image

Graph: Calculated Risk

Lastly, the so-called price-to-rent ratio tells us that prices are again rising faster than rents, and are above the long term ratio of 1:1. This means that housing prices are growing faster than rents again. Ergo, prices cannot continue this trend for long, since rent increases mirror actual income increases, whereas prices rise or fall for a number of reasons. This includes the perception that housing prices will continue to rise (due to irrational exuberance, which is an early sign of housing inflation) and perhaps ultra-low interest rates, which must eventually rise to more normal levels.

On a price-to-rent basis, the Case-Shiller National index is back to February 2003 levels, the Composite 20 index is back to September 2002 levels, and the CoreLogic index is back to July 2003, reports Calculated Risk.

So are we at the beginning of another housing bubble? Probably not, because the main cause of the current price increases is inadequate new home construction to meet the demand for housing (which is rental housing, at the moment), rather than oversupply of new homes that caused the housing bubble.

Harlan Green © 2014

Follow Harlan Green on Twitter: https://twitter.com/HarlanGreen

Friday, June 6, 2014

Home Sizes Ballooning Again

The Mortgage Corner

Housing sizes are ballooning, after a slight pause due to the Great Recession, reports the U.S. Census Bureau and Marketwatch. In 2013 the median floor area of new single-family homes sold in the U.S. rose 4 percent to hit almost 2,500 square feet, according to recently released data from the U.S. Census Bureau.

That compares to the median 1,800-square-foot size of a single detached home, as reported in the 2011 American Housing Survey, when 40 percent of homes were 1-2,000 square feet in size.

largehomes

Graph: WSJ Marketwatch

The biggest new single-family homes of all were sold in the South, hitting a median of 2,534 square feet in 2013, up 1 percent from the prior year. Homes in the Northeast reached 2,456 square feet, up 3 percent. Homes in the Midwest measured 2,405 square feet, up 9 percent from 2012, and homes in the West hit 2,394 square feet, up 5 percent.

And prices continue to rise. The Case-Shiller Home Price Index of same-home sales has risen 12.4 percent in a year, and buyers are paying more for these larger homes. The median sales price of new single-family homes rose to $268,900 last year, up 10 percent from 2012.

What does that say? Those with the money are moving the various markets. The fastest growing segment are homes from 3,000 to 3,999 square feet, says the Census Bureau. Last year 9 percent of new single-family homes sold in the U.S. were at least 4,000 square feet, up from 8 percent in 2012. Meanwhile, the share of homes under 1,800 square feet fell to 17 percent in 2013, down from 22 percent in 2012 and 33 percent a decade earlier.

Existing-home sales are following the same trend. April’s sales of existing homes that cost at least $1 million grew more than 5 percent from a year earlier, while sales of homes under $250,000 fell more than 5 percent, according to the National Association of Realtors.

What will bring more buyers into the housing market? Even lower mortgage rates, it seems. Purchase mortgage applications are still declining since January, even though mortgage rates have plunged on late, with the 30-year conforming fixed rate falling to 3.875 percent, and Hi-Balance conforming fixed rates at 4.00 percent for 1 origination point.

mortgages

Graph: WSJ Marketwatch

So the big question remains whether middle class families will be able to afford those middle class homes anymore? That has as much to do with households starting up, or new household formation. And with so many of the 25 to 55 year-olds out of work, it may take years for households formation to pick up to the 1.2m per year average that prevailed before the Great Recession, from the current 600,000 new annual households being formed.

workers

Graph: Zero Hedge

For instance, in the April unemployment report, one of the most important age group for jobs, those workers aged 25-54 which represent the bulk of the US labor force and are also the best and most productive group, the total number of jobs tumbled from 95,360K to 95,151K, a drop of 209K, reports Zero Hedge.

Seniors were the winners. According to the establishment survey, the only beneficiary of whatever this jobs "recovery" is, were workers aged 55-69, that have gained 174,000 jobs to date.

Harlan Green © 2014

Follow Harlan Green on Twitter: https://twitter.com/HarlanGreen

Tuesday, April 29, 2014

Home Price Strength To Boost Sales

The Mortgage Corner

Data through February 2014, released today by S&P Dow Jones Indices for its S&P/Case-Shiller Home Price Indices, show that the annual rates of gain posted 13.1 (in 10-city index) and 12.9 percent (20-city index) in the twelve months ending February 2014. Though some regions had flat or slightly negative readings—e.g., Cleveland and Chicago are still affected by winter weather—it is good news for sales.

caseshiller

Graph: Calculated Risk

“Prices remained steady from January to February for the two Composite indices,” says David M. Blitzer, Chairman of the Index Committee at S&P Dow Jones Indices. “The annual rates cooled the most we’ve seen in some time. The three California cities and Las Vegas have the strongest increases over the last 12 months as the West continues to lead. Denver and Dallas remain the only cities which have reached new post-crisis price peaks.”

California cities San Francisco (22.7 percent), San Diego (19.9 percent), and Los Angeles (18.2 percent) led the way, with Las Vegas (23.1 percent) still the overall leader in annual price increases.

The Northeast with New York, Washington and Boston are seeing some of the slowest year-over-year gains. However, even there prices are above their levels of early 2013. On a month-to-month basis, there is clear weakness. Seasonally adjusted data show prices rose in 19 cities, but a majority at a slower pace than in January.

Another reason for optimism that home sales will increase this year is inventories are increasing again. Housing Tracker (Department of Numbers) has been providing some weekly inventory data for the last several years to Calculated Risk. And inventories are up 8.2 percent already this year.

In 2011 and 2012, inventory only increased slightly early in the year and then declined significantly through the end of each year. In 2013 (Blue), inventory increased for most of the year before declining seasonally during the holidays.  Inventory in 2013 finished up 2.7 percent YoY compared to 2012. But inventory in 2014 (Red) is now 8.2 percent above the same week in 2013.

The median asking price for homes in the US peaked in June 2006 at $319,459 and is now $48,209 (15.1 percent) lower. From a low of $211,844 in January 2011, the median asking price in the US has increased by $59,404 (28.0 percent) to $273,759, says Housing Tracker.

inventory

Graph: Calculated Risk

So though the price increases had some effect on slowing sales of new and existing-home over the past several months, the severe winter weather and lower inventories have a larger effect. And don’t forget rising prices also mean rising equity levels, which means more homes are eligible for sale.

Harlan Green © 2014

Follow Harlan Green on Twitter: https://twitter.com/HarlanGreen

Tuesday, March 25, 2014

What’s Happened to New-Home Sales?

The Financial FAQs

Sales of new single-family houses in February 2014 were at a seasonally adjusted annual rate of 440,000, according to U.S. Census Bureau and the Department of Housing and Urban Development estimates. This is 3.3 percent below the revised January rate of 455,000 and is 1.1 percent below the February 2013 estimate of 445,000.

newhomes

Graph: Calculated Risk

What has happened to new-home sales, with annual housing starts now above 900,000 units? Both housing prices and interest rates have been rising, for starters. And the Case-Shiller Home Price index is still rising annually at 13.2 percent, 0.8 percent in January, using a 3-month average.  And it takes at least 9 months for housing construction to be reflected in completions that would influence new-home sales.

shiller

Graph: Econoday

It could also be the winter weather in two-thirds of the country, and inventories are still low, at 5.2 months’ supply. But more likely it is that home ownership is increasingly difficult for first-time homebuyers, particularly. Tough lending standards for Fannie Mae and Freddie Mac, with higher credit score requirements and fees have made borrowing less attractive.

But that may be changing in 2014, as lenders seem to be easing their credit standards, both because default rates are down and housing prices continue to rise. The average FICO score on all closed loans was 724 in February 2014 compared to 745 in February 2013, or a 21-point decrease, according to a report released by Ellie Mae, a mortgage technology firm. (Under a system devised by Fair Isaac Corp., FICO credit scores run on a scale from 300 to 850.) Last month, 33 percent of closed loans had an average FICO score under 700 compared to 24 percent in February 2013.

“The share of purchase loans jumped four percentage points, representing 57 percent of all closed loans in February 2014,” said Jonathan Corr, president and chief operating officer of Ellie Mae. “This is the first time in four months that the share of purchase loans increased month over month and the largest one-month increase since August 2013, when the share of purchase loans also jumped four percentage points.”

“Credit requirements remained steady month over month, but there has been significant loosening compared to where we were a year ago,” said Corr.

So it may be too early to see a purchase trend in 2014 for new and existing-home sales. Total existing-home sales, which are completed transactions that include single-family homes, townhomes, condominiums and co-ops, declined 0.4 percent to a seasonally adjusted annual rate of 4.60 million in February from 4.62 million in January, and 7.1 percent below the 4.95 million-unit level in February 2013.

Interest rates fluctuations and conforming loan underwriting standards may be the deciding factors, which in turn affect consumer confidence. How much pentup demand is there with new households is another factor. So we will probably have to wait to see how the new selling season fares, taking into account all these factors.

Harlan Green © 2014

Follow Harlan Green on Twitter: https://twitter.com/HarlanGreen