Showing posts with label first-time home buyers. Show all posts

Wednesday, March 29, 2023

Homebuyers Already on the Move

 The Mortgage Corner

The home-buying season has begun earlier this year from a large rise in existing-home and new-home sales. It looks like families are already on the move, including retirees and seniors downsizing to more humble quarters.

Calculated Risk

Why? Housing pricing are finally declining in some regions in concert with lower mortgage rates (see above Case-Shiller graph). Homebuyers must be thinking interest rates have topped and the Fed rate hikes will end sometime this summer.

“I’m quite surprised,” Lawrence Yun, chief economist at the National Association of Realtors said. “The recovery is coming stronger, [but] maybe it will deflate again if the mortgage rates get too high… [and] mortgage rates have a very big influence.”

Baby boomers now make up 39 percent of home buyers (ages 58 to 76 years old) – the most of any generation – an increase from 29 percent last year, said the NAR, in its press release.

Maybe rising consumer confidence is another reason home sales are up. The Conference Board's consumer confidence index rose to 104.2 this month from a reading of 103.4 in February.

The cutoff date for the confidence survey was March 20, 10 days after California-based Silicon Valley Bank collapsed. New York-based Signature Bank failed on March 12, said the Conference Board, so the fact that jobs were plentiful seemed to outweigh banking worries.

And housing prices are stabilizing. “The MoM decrease in the seasonally adjusted Case-Shiller National Price Index was -0.25%. This was the seventh consecutive MoM decrease, and a slightly smaller decrease than in December,” said Bill McBride, quoting its press release.

The biggest surprise was that existing-home sales jumped 14.5 percent in February to a seasonally adjusted annual rate of 4.58 million, snapping a 12-month slide and representing the largest monthly percentage increase since July 2020 (+22.4 percent). Compared to one year ago, however, sales will still down 22.6 percent.

Calculated Risk

Downward price pressure also came from increasing inventories of for sale residences. The total existing-home inventory registered at the end of February grew to 980,000 units, identical to January and up 15.3 percent from one year ago (850,000). Unsold inventory sits at a 2.6-month supply at the current sales pace, up from 1.7 months in February 2022 when the price surge began.

Mortgage rates are also declining along with Treasury security yields, down approximately down -0.50 percent. I spotted a 6 percent rate on a 30-year conforming fixed rate mortgage with low origination points recently, down from 6.50 two weeks ago.

Not so surprising is that twenty-six percent of all buyers were first-time buyers, the lowest since NAR began tracking the data and a decrease from 34 percent last year.

Another sign that the selling season has begun was pending home sales that measure contracts signed but not closed, increased for the third month in a row.

“After nearly a year, the housing sector’s contraction is coming to an end,” said chief economist Yun. “Existing-home sales, pending contracts and new-home construction pending contracts have turned the corner and climbed for the past three months.”

So when will conditions improve for first-timers again? When the Fed reverses course and interest rates decline for real, which I’ve been calling for. New-home inventory is now matching existing-home inventory, which means builders are catching up, maybe in preparation for a more hopeful summer season.

Harlan Green © 2023

Follow Harlan Green on Twitter: https://twitter.com/HarlanGreen

Monday, June 24, 2019

Who Can Still Afford to Buy a Home?

The Mortgage Corner
 

That question of who can still afford to buy a home is up in the air, as we say, since home sales have been trending lower of late and there is still a housing shortage. MarketWatch’s Andrea Riquier believes housing sales peaked in 2018, dropping below combined sales of 6 million for the first time in two years, per her graph of existing and new-home sales, and won’t go higher this year—in the 11th year of the recovery from the housing bubble.

Sales are falling because Ms. Riquier maintains home buying is still out of the price ranges most young adults can afford for various reasons, including a low inventory of affordable homes for sale, and lower earning potential than in past recoveries for young adults with college degrees still digging out from under student loans.

Yet total existing-home sales’, https://www.nar.realtor/existing-home-sales, completed transactions that include single-family homes, townhomes, condominiums and co-ops, jumped 2.5 percent from April to a seasonally adjusted annual rate of 5.34 million in May, per the NAR.

The share of first-time home buyers continued a three-year decline, falling 33 percent (34 percent last year), for homes at or below the $277,000 median home price. This number has not been 40 percent or higher since the first-time home buyers credit ended in 2010.  It was a 2-year Obama initiative that gave a $7,500 tax credit to first-time buyers.


Total sales are down 1.1 percent from a year ago (5.40 million in May 2018), but when combined with surging May new-home sales of 673,000 reported by the Census Bureau, the total is 6.01 million. So total sales are rising again; maybe because of the recent interest rate decline to post-recession lows?   

NAR chief economist Lawrence Yun said the 2.5 percent jump shows that consumers are eager to take advantage of the favorable conditions. “The purchasing power to buy a home has been bolstered by falling mortgage rates, and buyers are responding.”

Rates are down because the 10-year Treasury bond benchmark yield that most lenders use to set mortgage rates has fallen to 2 percent at this writing, which puts it back to yields that prevailed during the Great Recession, and the 30-year fixed conforming mortgage is holding at 3.50 percent for less than one origination point.

But can builders keep up with the declining inventory of homes for sale? Residential investment has fallen for five straight quarters though the second quarter for starts is up overall with the new May report.


Privately‐owned housing starts in May were at a seasonally adjusted annual rate of 1,269,000, said the Census Bureau. This is 0.9 percent (±12.9 percent) below the revised April estimate of 1,281,000 and is 4.7 percent (±8.9 percent) below the May 2018 rate of 1,332,000. Single‐family housing starts in May were at a rate of 820,000; this is 6.4 percent (±9.5 percent) below the revised April figure of 876,000.

Single-family homes starts were actually very weak in May, in other words, for a 12.5 percent year-on-year decline, as I said. Multi-units, in contrast, are up a yearly 13.7 percent at a 449,000 rate.
So it really looks like more new households are opting to rent, even with record-low interest rates.

What else can they do with fewer purchasing options? One problem highlighted by Ms. Riquier is current homeowners are staying longer in their residence, thus reducing the housing supply—up to 10 years in recent surveys, says Riquier, vs. staying put for the more normal average 4 years before moving on..

It sounds like we need those record-low interest rates to keep the housing market alive. All the predictions are they could even go lower this year, but for how long?  It also looks like another first-time home buyers tax credit is needed to make homes more affordable to first-timers.

Harlan Green © 2019

Follow Harlan Green on Twitter: https://twitter.com/HarlanGreen

Friday, February 23, 2018

Lower Inventory = Fewer Home Sales

The Mortgage Corner

WASHINGTON (February 21, 2018) — Existing-home sales slumped for the second consecutive month in January and experienced their largest decline on an annual basis in over three years, according to the National Association of Realtors. All major regions saw monthly and annual sales declines last month.

Total existing-home sales, which are completed transactions that include single-family homes, townhomes, condominiums and co-ops, sank 3.2 percent in January to a seasonally adjusted annual rate of 5.38 million from a downwardly revised 5.56 million in December 2017. After last month’s decline, sales are 4.8 percent below a year ago (largest annual decline since August 2014 at 5.5 percent) and at their slowest pace since last September (5.37 million).

Graph: Econoday
Lawrence Yun, NAR chief economist, says January’s retreat in closings highlights the housing market’s glaring inventory shortage to start 2018. “The utter lack of sufficient housing supply and its influence on higher home prices muted overall sales activity in much of the U.S. last month,” he said. “While the good news is that Realtors in most areas are saying buyer traffic is even stronger than the beginning of last year, sales failed to follow course and far lagged last January’s pace. It’s very clear that too many markets right now are becoming less affordable and desperately need more new listings to calm the speedy price growth.”
Total housing inventory at the end of January rose 4.1 percent to 1.52 million existing homes available for sale, but is still 9.5 percent lower than a year ago (1.68 million) and has fallen year-over-year for 32 consecutive months. Unsold inventory is at a 3.4-month supply at the current sales pace (3.6 months a year ago).

“Another month of solid price gains underlines this ongoing trend of strong demand and weak supply. The underproduction of single-family homes over the last decade has played a predominant role in the current inventory crisis that is weighing on affordability,” said Yun. “However, there’s hope that the tide is finally turning. There was a nice jump in new home construction in January and homebuilder confidence is high. These two factors will hopefully lay the foundation for the building industry to meaningfully ramp up production as this year progresses.”

First-time homebuyers are being squeezed because of the housing shortage, as just 29 percent were buyers, down from 32 percent last month.

The median existing-home price for all housing types in January was $240,500, up 5.8 percent from January 2017 ($227,300). January’s price increase marks the 71st straight month of year-over-year gains, according to the NAR.

New-home sales and construction are beginning to catch up with demand, but interest rates have to remain at their historic lows for this to continue. The 30-year fixed conforming rate is still 4.0 percent for 1 origination point, just 0.50 percent above its historic low. And several Federal Reserve Governors have said the Fed may not hike short term rates anytime soon, if inflation rates don’t move above the current 2 percent target rate.

Harlan Green © 2018

Follow Harlan Green on Twitter: https://twitter.com/HarlanGreen

Tuesday, May 24, 2016

New-Home Sales Also Soaring

Financial FAQs
"Sales of new single-family houses in April 2016 were at a seasonally adjusted annual rate of 619,000, according to estimates released jointly today by the U.S. Census Bureau and the Department of Housing and Urban Development. This is 16.6 percent above the revised March rate of 531,000 and is 23.8 percent above the April 2015 estimate of 500,000."
We are beginning to see a real recovery in housing inventories with more new home being built, the one element that has been holding back more robust sales, as well as first-timers from entering the housing market.

“Rising home sales combined with tight inventory will translate into increased housing production as we move onward in 2016, especially as job creation continues and mortgage rates remain low,” said NAHB Chief Economist Robert Dietz.
We are also seeing record low mortgage default rates, another sign that more homeowners are free to either move or refinance their homes.  Strong job creation and a seven-year U.S. economic recovery have helped home owners get in the best shape in years. The number of new foreclosures in the first quarter edged near the lowest level in 17 years, the New York Federal Reserve said Tuesday.

The same was true for other consumer debt. Repayments increased and just 5 percent of all outstanding household debt — student loans, credit cards, auto loans, mortgages, home equity lines of credit - was delinquent in early 2016. That’s the smallest share of delinquencies since 2007, shortly before the onset of the Great Recession.

Graph: Calculated Risk

The bottom line is that more new homes have to be built—almost doubled to 1 million per year in order to catch up with historical demand. Historically, the number of new and existing-home sales was a constant ratio of 6 to 1 existing-homes to new-home sales. That means at the current existing-home sales rate of 5.4 million homes, some 900,000 new homes need to be sold. And they have to be in the more affordable price ranges, which means closer to the current median new-home price of $321,100, or below.

Harlan Green © 2016

Follow Harlan Green on Twitter: https://twitter.com/HarlanGreen

Thursday, May 5, 2016

Fannie Mae, GSEs, Even More Important

The Mortgage Corner

With news that Fannie Mae, one of the GSEs now managed by the Federal Housing Finance Authority (and US Treasury) just showed a $1.1B profit in Q1, but must pass all of it profits to Treasury since 2012, the question of how to resolve the status of major mortgage guarantors Fannie Mae and Freddie Mac becomes even more critical.

Why? They will have no capital left after 2017, and ““Operating with essentially zero capital is not sustainable,” said Fannie CEO Tim Mayopoulos on the Thursday morning earnings call, just after his company reported a $1.14 billion profit in the first three months of the year, the 17th consecutive quarter of profitability.

Yet banks and other non-GSE lenders aren’t stepping up to the plate to replace Fannie and Freddie. And they still guarantee more the 60 percent of all conventional mortgages. Private capital is “unwilling to step in” to replace the government-sponsored enterprises as mortgage finance leaders in the secondary market, said Mayopoulos to HousingWire’s Jacob Gaffney.

This is hurting the housing market, needless to say, as the GSEs keep tightening qualification standards in an attempt to satisfy Treasury that it is shrinking its loan portfolio. The average Fannie borrower’s FICO score was 746 in the first quarter. By way of comparison, the median credit score across the entire mortgage market in 2001, before the bubble era, was 701.

And that is even high, as scores of 620 to 680 were more prevalent in past decades because it was hard for homeowners to avoid at least one mortgage late payment in a year, what with so many payments made via snail mail. In fact, both FHA and VA, the other two Government Supervised Entities, allow credit scores as low as 520.


Fannie’s serious delinquency rate also shows cleaner credit quality. It fell for the 24th quarter in a row in the beginning of the year, to 1.44 percent. According to the company’s financial statement, that number would be even lower if foreclosures didn’t take so long in many states.

And Freddie Mac reported the Single-Family serious delinquency rate decreased in March to 1.20 percent from 1.26 percent in February. Freddie's rate is down from 1.73 percent in March 2015. This is the lowest rate since August 2008.

All this is making it more difficult for younger, first-time homebuyers with generally lower incomes, savings and credit scores. The NAR’s March existing-home sales survey reported the share of first-time buyers was 30 percent in March, unchanged both from February and a year ago. First-time buyers in all of 2015 also represented an average of 30 percent.
"With rents steadily rising and average fixed rates well below 4 percent, qualified first-time buyers should be more active participants than what they are right now," said the NAR’s chief economist Lawrence Yun. "Unfortunately, the same underlying deterrents impacting their ability to buy haven't subsided so far in 2016. Affordability and the low availability of starter homes is still a major barrier for them in most markets."
So there is no reason that credit requirements should be tightening at a time when more first-time homebuyers are entering the housing market. And there is plenty of evidence that the younger generations want and need housing.

Harlan Green © 2016

Follow Harlan Green on Twitter: https://twitter.com/HarlanGreen

Monday, June 29, 2015

Consumers Earn and Spend More This Year

Financial FAQs

The consumer came to life in May, boosted by a 0.5 percent rise in personal income and helping to support a 0.9 percent surge in personal outlays that reflects heavy spending on autos and retail goods. The spending surge will also boost housing, already showing much better numbers, and the rest of the economy this year.

This is while the gains are not inflationary, at least yet, based on the very closely watched core Personal Consumption Expenditure (PCE) price index which edged only 0.1 tenth higher in May and is at a very benign 1.2 percent year-on-year rate which is actually down a tenth from an upward revised April.

Also, consumer optimism is absolutely as strong as it gets well beyond forecasts to 96.1, according to the University of Michigan consumer sentiment index. The expectations component, reflecting strong optimism for the jobs market, is an absolute standout, at 97.8 for a 12-year high and an 11.0 point surge from mid-month and a 13.6 point surge from final May, said Econoday. The survey is now back to early 2000 levels in this graph that dates back to 1978 and five recessions.

image

Graph: Calculated Risk

And such increased household incomes and employment have boosted housing construction and permits, which in turn boosts lots of ancillary sectors, such as Professional Services, Insurance, and Banking. Housing starts came in at a 1.036 million rate in May which is down 11.1 percent from the April rate, as we reported – but the April rate, which was already one for the record books, was revised even  higher to 1.165 million for, and this is no misprint, a 22.1 percent gain from March.

image

Graph: Econoday

Increased consumer optimism has to be why we see the gigantic surge in permits, up 11.8 percent to 1.275 million following a 9.8 percent gain in April, which means future construction growth. Permits are the leading indicator in the report and the latest permit rate is the best since way back in August 2007. Based if nothing else than on permits, the housing sector, following the heavy weather of the first quarter, is moving to the top of the economy.

For home buying, the 30 to 39 age group (blue line) is important in this Calculated Risk graph.  The population in this age group is increasing, and will increase significantly over the next 10 plus years.   From roughly 2020 this predominately home buying age group will outnumber all the other age groups in this graph that projects out to 2060.

image

Graph: Calculated Risk

This increase in the demand for goods and services, including housing, is in fact because of the millennial generation, as I’ve said in past columns. Its numbers have now surpassed their parents’ baby boomer generation, and will continue to expand as more become adults, enter the workforce, and raise families.

Harlan Green © 2015

Follow Harlan Green on Twitter: https://twitter.com/HarlanGreen

Tuesday, June 23, 2015

Housing Beginning to Bloom

The Mortgage Corner

Ultra-low interest rates are finally beginning to pay off.  The housing season is beginning to bloom—for first-time homebuyers, in particular. The National Association of Realtors reports total existing-home sales, which are completed transactions that include single-family homes, townhomes, condominiums and co-ops, rose 5.1 percent to a seasonally adjusted annual rate of 5.35 million in May from an upwardly revised 5.09 million in April, largely because of the surge in first time buyers. Sales have now increased year-over-year for eight consecutive months and are 9.2 percent above a year ago (4.90 million).

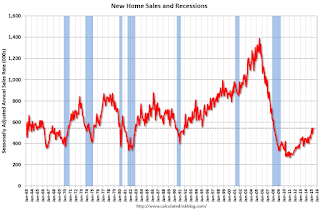
And new-home sales also soared. New single-family homes in the U.S. sold at an annual rate of 546,000 in May, hitting the fastest pace since February 2008, with growth in two of four regions, reports the U.S. Census Bureau this morning. And it revised April's rate to 534,000. May's sales rate was up 19.5 percent from a year earlier, signaling a healthy pick up, though recent sales rates remain below long-term averages.

image

Graph: Calculated Risk

This graph shows existing-home sales, on a Seasonally Adjusted Annual Rate (SAAR) basis since 1993. Sales in May (5.35 million SAAR) were 5.1 percent higher than last month, and were 9.2 percent above the May 2014 rate.

Lawrence Yun, NAR chief economist, says May home sales rebounded strongly following April's decline and are now at their highest pace since November 2009 (5.44 million). "Solid sales gains were seen throughout the country in May as more homeowners listed their home for sale and therefore provided greater choices for buyers," he said. "However, overall supply still remains tight, homes are selling fast and price growth in many markets continues to teeter at or near double-digit appreciation. Without solid gains in new home construction, prices will likely stay elevated — even with higher mortgage rates above 4 percent."

The percent share of first-time buyers rose to 32 percent in May, up from 30 percent in April and matching the highest share since September 2012. A year ago, first-time buyers represented 27 percent of all buyers.

"The return of first-time buyers in May is an encouraging sign and is the result of multiple factors, including strong job gains among young adults, less expensive mortgage insurance and lenders offering low down payment programs," said Yun. "More first-time buyers are expected to enter the market in coming months, but the overall share climbing higher will depend on how fast rates and prices rise."

The huge jump in existing-home sales means more demand for new homes, as we said last week. The median price of new homes fell 1 percent to $282,800 compared with May 2014, also a good sign for the first-time homebuyers. But there are still not enough homes for sale. The supply of new homes was 4.5 months at May's sales pace, down from 4.6 months in April.

New Home Sales

Graph: Calculated Risk

This is also why housing starts came in at a 1.036 million rate in May. Though down 11.1 percent from the April rate, which was already one for the record books. But April is now revised higher to 1.165 million, a 22.1 percent gain from March. Sealing matters is another gigantic surge in permits, up 11.8 percent to 1.275 million following a 9.8 percent gain in April.

And this is buttressed by builder confidence in the market for newly built, single-family homes in June up five points to a level of 59, according to the National Association of Home Builders/Wells Fargo Housing Market Index (HMI). This is the highest reading since September 2014, and in fact returns the index to pre-bubble (2001-02) levels.

Why the huge construction increase in June? This is while mortgage rates are rising, up some 0.375 percent since their most recent lows to 3.875 percent for 0 points in origination fees for a 30-year fixed rate conforming loan.

Firstly, it means consumers are confident enough in their future to begin to look for housing to support their growing families.  And the millennial generation aged 18 to 36 years has already surpassed their parents’ baby boomer population size, and will exceed it by 2020, according to demographers. This has to be why household formation is finally returning to normal levels of 1 million plus new households being formed per year, as the so-called echo boomers move out of their parents’ homes and or leave college to make their own nests.

So forecasters will probably be revising their second-quarter GDP estimates higher following the better housing numbers, not to mention their estimates for Thursday's index of leading economic indicators where permits are one of the components, as we said last week.

Harlan Green © 2015

Follow Harlan Green on Twitter: https://twitter.com/HarlanGreen

Saturday, April 25, 2015

March New-Home Sales A Dud

"Sales of new single-family houses in March 2015 were at a seasonally adjusted annual rate of 481,000, according to estimates released jointly today by the U.S. Census Bureau and the Department of Housing and Urban Development. This is 11.4 percent below the revised February rate of 543,000, but is 19.4 percent above the March 2014 estimate of 403,000."

image

Graph: Calculated Risk

The March result was a disappointment, mainly in the south, where sales fell 15.8 percent. And because builders continue to build—housing starts are close to the million unit mark again—housing inventories are rising and prices are falling. The supply of new homes rose to 5.3 months, while the median price fell to 1.5 percent to $277,400. Year-on-year, the median price to down 1.7 percent while sales are up 19.4 percent, a discrepancy that points to price discounting by builders, says Calculated Risk.

What is behind the up and down gyration in sales? Winter is still with us, for one thing. And many of the southern and Midwest states are being pounded by tornadoes, as well as torrential rains. Lower oil prices could also be hurting an area heavily dependent on the oil and gas industries.

We will know next week if job creation will resume from February’s low numbers, and so consumer confidence remains high. Mortgage activity is high, highest level in years, what with interest rates still at record lows. (The 10-year Treasury yield is back down to 1.91 percent, and Eurozone bonds now have negative interest rates, meaning banks have to pay their clients to borrow money, because there is so little demand for loans.)

Mortgage applications increased 2.3 percent from one week earlier, according to data from the Mortgage Bankers Association's (MBA) Weekly Mortgage Applications Survey for the week ending April 17, 2015.  The Market Composite Index, a measure of mortgage loan application volume, increased 2.3 percent on a seasonally adjusted basis from one week earlier.  The seasonally adjusted Purchase Index increased 5 percent from one week earlier to its highest level since June 2013.  The unadjusted Purchase Index increased 6 percent compared with the previous week and was 16 percent higher than the same week one year ago.

"Purchase applications increased for the fourth time in five weeks as we proceed further into the spring home buying season. Despite mortgage rates below four percent, refinance activity increased less than one percent from the previous week," said Mike Fratantoni, MBA's Chief Economist.  

The fact that purchase mortgage applications now comprise 44 percent of all applications, the highest in years, as we said, means the Fed’s policy of keeping interest rates as low as possible until household incomes begin to rise again is the right policy to kick start the housing market, and bring in those first time homebuyers who have been renting until know.

It also means some overbuilding of new homes is necessary to build up housing inventories for sale, and thus keep home prices in the affordable range.

Harlan Green © 2015

Follow Harlan Green on Twitter: https://twitter.com/HarlanGreen

Wednesday, January 7, 2015

Good Pending Sales, Home Prices in 2015

The Mortgage Corner

Pending home sales are rising again. Sales picked up steam in November, to 104.8 from a revised 104.0 in October for a better-than-expected gain of 0.8 percent. It is a sign, along with the Case-Shiller Home Price Index, that the housing market will pick up in 2015.

image

Graph: Econoday

Pending sales had been declining since last September, and only began to rise again this January. But they are still below post-recession highs. Rising prices may be the culprit, as the Case-Shiller Home Price Index rose 13.5 percent in 2014, but has now settled back to moderate 4.5 percent annual increases in recent months.

"The consistent economic growth and steady hiring we've seen the second half of this year is giving buyers enough assurance to consider purchasing a home before year's end," said NAR chief economist Lawrence Yun. "With rents now rising at a seven-year high, historically low rates and moderating price growth are likely to entice more buyers to enter the market in upcoming months."

image

Graph: Econoday

Where are those new buyers coming from? The main reason could be fresh data that show those 18 to 25 year-olds are finally leaving home, or school, when the lack of first-time homebuyers has kept existing-home sales from breaking out of a narrow range since 2009 and the end of the Great Recession. This is while housing prices have moderated their double-digit climb in 2014, making housing more affordable to those now able to find jobs.

Case-Shiller's 20 city year-on-year index for October (both adjusted and unadjusted) came in soft, at plus 4.5 percent, says Econoday, down 3 tenths from September. This is the lowest rate since October 2012 and follows a full year of low double digit gains through much of 2013 and into April this year.

So ‘the times they are a changin’. Household formation is increasing again, and history says at least 50 percent of those new householders will purchase a home. Fortune Magazine has just cited Neil Dutta, head of economics at Renaissance Macro Research, who pointed out in a note to clients that household formation in 2014 through September is already at its highest rate since 2005.

image

Graph: Fortune.com

The employment rate for folks aged 25 to 34 has grown 2.8 percent over the past year, about 29 percent faster than the overall employment rate, and they make up the largest generation ready to enter the housing market, larger than their baby boomer parents.

And don’t forget those record low interest rates, now back to last year’s pre-April rates, before Fed Chair Bernanke announcement that QE3 would end. The 30-year fixed conforming rate is now down to 3.50 percent with 0 origination points in California, for those with the best credit scores.

Harlan Green © 2014

Follow Harlan Green on Twitter: https://twitter.com/HarlanGreen

Wednesday, October 1, 2014

Pending-Home Sales Decline Slightly

The Mortgage Corner

The Pending Home Sales Index, a forward-looking indicator based on contract signings, fell 1.0 percent to 104.7 in August from 105.8 in July, and is now 2.2 percent below August 2013 (107.1). Despite the slight decline, the index is above 100 – considered an average level of contract activity – for the fourth consecutive month and is at the second-highest level since last August.

Lawrence Yun, NAR chief economist, said contract signings are holding steady and fewer distressed sales and less investor activity is likely behind August’s modest decline. “Fewer distressed homes at bargain prices and the acknowledgement we’re entering a rising interest rate environment likely caused hesitation among investors last month,” he said. “With investors pulling back, the market is shifting more towards traditional and first-time buyers who rely on mortgages to purchase a home.”

And the S&P/Case-Shiller U.S. National Home Price Index, which covers all nine U.S. census divisions, recorded a 5.6 percent annual gain in July 2014. The 10- and 20-City Composites posted year-over-year increases of 6.7 percent.

image

Graph: Calculated Risk

Data through July 2014 show a significant slowdown in price increases. Nineteen of the 20 cities saw lower annual returns in July. Las Vegas, Miami and San Francisco were the only cities to report double-digit annual gains. Cleveland’s rate remained unchanged at +0.9% for the 12 months ending July 2014.

Las Vegas rose 12/8 percent, Miami 11 percent, and San Francisco 10.3 percent. The PHSI in the Northeast slipped 3.0 percent to 86.5 in August, but is still 1.6 percent above a year ago. In the Midwest the index fell 2.1 percent to 102.4 in August, and is 7.6 percent below August 2013.

Pending home sales in the South decreased 1.4 percent to an index of 117.0 in August, unchanged from a year ago. The index in the West rose for the fourth consecutive month (2.6 percent) in August to 102.1, but still remains 2.6 percent below August 2013.

The major reason for less investor demand is the fall in foreclosures and delinquent mortgages, as we said. Fannie Mae reported today that the Single-Family Serious Delinquency rate declined in July to 2.00 percent from 2.05 percent in June. The serious delinquency rate is down from 2.70 percent in July 2013, and this is the lowest level since October 2008.

Freddie Mac also reported that the Single-Family serious delinquency rate declined in July to 2.02 percent from 2.07 percent in June. Freddie's rate is down from 2.70% in July 2013, and is at the lowest level since January 2009. Freddie's serious delinquency rate peaked in February 2010 at 4.20%.

image

Graph: Calculated Risk

“The employment outlook for young adults is brightening and their incomes3 finally appear to be rising,” said Yun. “Jobs and income gains will help repay student debt and better position first-time buyers, setting the stage for improved sales growth in upcoming years.” 

In fact, overall consumer incomes are rising. Personal income growth posted a 0.3 percent gain in August, following a 0.2 percent rise in July. The latest number matched expectations for a 0.3 percent advance. The wages & salaries component was even stronger with a 0.4 percent boost, following a 0.2 percent increase the month before.

image

Graph: Econoday

Personal spending jumped 0.5 percent after no change in July, while there was no increase in the PCE inflation index at all, mainly due to falling gas prices. Strength was in the durables component which jumped 1.8 percent after no change in July. August reflected a jump in auto sales. Nondurable spending declined 0.3 percent after no change in July. Services jumped 0.5 percent in August after being unchanged the month before.

And with interest rates falling again—the 30-yr conforming fixed rate is back to 3.75 percent with 0 origination points—more first-timers in particular can afford to buy homes. We are of course speaking of the 18 to 35-yr olds of the so-called millennial generation who have taken longer to both find jobs and leave their parents’ home.

Harlan Green © 2014

Follow Harlan Green on Twitter: https://twitter.com/HarlanGreen

Friday, September 24, 2010

Home Sales Are Rising—In Spite of Bad News

The Mortgage Corner

In spite of all the bad news—higher foreclosures (one Florida home foreclosed on that didn’t even have a mortgage!), falling prices, and record lower mortgage rates—buyers still want their dream home, say several reports.

Existing Home sales, which are completed transactions that include single-family, townhomes, condominiums and co-ops, increased 7.6 percent to a seasonally adjusted annual rate of 4.13 million in August from an upwardly revised 3.84 million in July, but remain 19.0 percent below the 5.10 million-unit pace of one year ago.

clip_image002

NAR chief economist Lawrence Yun said, “The housing market is trying to recover on its own power without the home buyer tax credit. Despite very attractive affordability conditions, a housing market recovery will likely be slow and gradual because of lingering economic uncertainty”.

There is no uncertainty about housing affordability, however, which is still hovering near its record high in spite of a 12 percent price rise in the median existing-home price, according to the Realtors. This is because 30-year fixed mortgage rates have dropped to 4.125 percent for conforming, 4.375 percent for so-called super conforming loans to $727,750, so that just a $37,392 annual income is need to qualify for a median-priced home with 20 percent down. This is 30 percent less than the income required to qualify in 2007.

Yun added, “Affordability could reach a generational high in the second half of this year because of rock-bottom mortgage interest rates, helped partly by the Fed’s very accommodative monetary policy. The loan underwriting standards are tighter, but home buyers can improve their chances of getting a loan by staying well within their budget.”

Total housing inventory at the end of August slipped 0.6 percent to 3.98 million existing homes available for sale, which represents an 11.6-month supply at the current sales pace, down from a 12.5-month supply in July.

clip_image004

“Home values have shown stabilizing trends over the past year,” said Dr. Yun, “even as the economy shed millions of jobs, because of the home buyer tax credit stimulus. Now that the economy is adding some jobs, the housing market needs to steadily improve and eventually stand on its own.”

Pending home sales in July also rose 5.2 percent to 79.4 based on contracts signed in July from a downwardly revised 75.5 in June, but remains 19.1 percent below July 2009. The data reflects contracts and not closings, which normally occur with a lag time of one or two months, indicating better numbers for future existing-home sales.

And first-time home buyers, a growing segment of the housing market, are contributing to an increase in demand for smaller and less expensive new homes, according to research from economists at the National Association of Home Builders (NAHB). A recent biennial American Housing Survey, which was conducted by the Department of Housing and Urban Development and the Census Bureau in 2009 finds that 41 percent of the 8.4 million households who bought a home between 2007 and 2009 were first-time buyers.

The market share of first-timers was up from 35 percent in both 2005 and 2007. Although some of the demand was fueled by the initial version of the home buyer tax credit in mid-2008, which was specifically targeted to those buying a home for the first time, the upward trend is expected to continue as children of baby boomers -- members of a generation that is larger than their parents' -- move into their household formation years in the period ahead.

"Builders are increasingly gearing their homes to the needs of first-time buyers, and we expect the trend to continue in the period ahead as the economy begins generating more jobs and more people in their 20s form households," said Chairman Bob Jones of NAHB.

Housing won’t truly stabilize until the foreclosure rate has dropped significantly, and there are still too many in the 90-day late category of mortgage delinquencies. So there may be another spike in foreclosures, as banks clear their books of bad loans. The new Basel III capital requirements were less than feared, which frees up more bank capital, and so banks may be gearing up to do business as usual again.

Harlan Green © 2010

Saturday, April 11, 2009

When Will Housing Market Bottom?

The Pending Home Sales Index, a forward-looking indicator based on contracts signed in January, fell 7.7 percent to 80.4 from a downwardly revised reading of 87.1 in December, and is 6.4 percent below January 2008. The index is at the lowest level since tracking began in 2001, when the index value was set at 100.

Since it is a leading indicator of future activity, what does this mean for reaching a housing bottom? Pending sales track escrows that close in 30-60 days. The West was the only region that showed increased activity, with it seasonally adjusted pending index up 2.4 percent in a month and 13.5 percent over last January. The West includes states like California, Nevada and Arizona that have seen the greatest price declines.

Lawrence Yun, NAR’s chief economist, said the downturn in the economy also weighed heavily on the data. “Even with many serious potential home buyers on the sidelines waiting for passage of the stimulus bill, job losses and weak consumer confidence were a natural drag on home sales,” he said. “We expect similarly soft home sales in the near term, but buyers are expected to respond to much improved affordability conditions and from the $8,000 first-time buyer tax credit.”

NAR’s Housing Affordability Index rose 13.6 percentage points in January to 166.8, a new record high. The HAI, a broad index of affordability that tracks the ability of a household with median income to buy a median-priced existing home, shows that the relationship between home prices, mortgage interest rates and family income is the most favorable since tracking began in 1970.

The HAI indicates a median-income family, earning $59,800, could afford a home costing $283,400 in January with a 20 percent down payment, assuming 25 percent of gross income is devoted to mortgage principal and interest; affordability conditions for first-time buyers with the same income and small down payments are roughly 80 percent of that amount. A year ago, the typical first-time family could afford a home costing $263,300.

The just unveiled Housing and Affordability Sustainability Plan (HASP) should also stimulate mortgage volumes for distressed borrowers with loan amounts less than $729,750. Eligible borrowers have to show either that their homes are more than 80 percent encumbered, or loan payments—including taxes and insurance—are more than 38 percent of monthly gross income. Lenders can then either cut the interest rate as low as 2 percent, forgive principal, and if that doesn’t work, extend amortization period to 40 years.

Harlan Green © 2009