Showing posts with label household formation. Show all posts

Wednesday, December 18, 2019

Full Speed Ahead for Housing Construction, Sales?

The Mortgage Corner


The ultra-low interest rates are making a difference as homebuilder sentiment is soaring along with new building permits, which should boost new and existing-home sales as well. For instance, more new homes on the market encourage existing-home owners to move up or downsize, depending on their age and family.

Builder confidence in the market for newly-built single-family homes increased five points to 76 in December off an upwardly revised November reading, according to the latest National Association of Home Builders/Wells Fargo Housing Market Index (HMI) released today. This is the highest reading since June of 1999.

This is making a small dent in the severe housing shortage since the Great Recession that has resulted in soaring rents and the current homelessness in communities that haven’t been building enough new housing.
“While we are seeing near-term positive market conditions with a 50-year low for the unemployment rate and increased wage growth, we are still underbuilding due to supply-side constraints like labor and land availability,” said NAHB Chief Economist Robert Dietz. “Higher development costs are hurting affordability and dampening more robust construction growth.”
All three components of that gauge -- present sales, future sales expectations and prospective buyers traffic -- improved, said Wrightson, but the biggest gain was a seven-point rise in current sales of new homes to a 21-year high of 84.  Regionally, the gains were more mixed, with the Midwest index improving sharply, the South rising marginally, and the West and Northeast declining.

Homebuilders also boosted construction on new homes in the U.S. at an annual pace of 1.37 million in November, the Commerce Department said today. This was a 3.2 percent (±10.0 percent) increase from a revised 1.32 million in October, 13.6 percent higher than a year ago.

And new building permits hit another post-recession high, up at a seasonally-adjusted rate of 1.48 million. That was 1.4 percent (±1.4 percent) above the pace of 1.46 million set in October and 11.1 percent above last year’s rate.

We know there is still a tremendous shortage of housing that came from the reluctance of builders to build for years after the Great Recession. Some of the shortage also came from Wall Street firms buying up housing abandoned from the busted housing bubble that were then turned into rentals.

A recent report by CBSN documented the carnage from the busted housing bubble and Great Recession. More than 9 million homes were foreclosed or sold at a loss after the bubble popped, leading to fears that tracts of abandoned neighborhoods would become "ghost towns."

This led government officials such as then Fed Chair Ben Bernanke to suggest foreclosed homes could be sold in bulk to private investors as rental properties. But that wasn’t enough, as there was very little government help to keep homeowners in their homes as happened during the Great Depression when the Home Owners' Loan Corporation (HOLC lent low-interest money to families in danger of losing their homes to foreclosure. By the mid-1930s, the HOLC had refinanced nearly 20 percent of urban homes in the country, allowing homeowners to stay in their homes with very lenient terms to enable them to weather the joblessness of the Great Depression.
“In the decade since the crash,” said the CBSN report, “7 million more households have become renters, while only 1 million more have become homeowners, according to Census data. And "institutional landlords," as the Wall Street investors are called, have become a major driver of the affordable housing woes many Americans are now facing—from steep rent payments all the way to eviction.”
The homeownership rate as a percentage of households that own vs. renting hasn’t recovered, dropping from its pre-recession high of 69 percent to 64.3 percent of households today. The U.S. has become a nation of renters at a time when rental rates are soaring due to the lack of new housing, resulting also in the more than one-half million homeless.

Another casualty of the Great Recession was lack of new household formation among the millennial generation children of the baby boomers who in fact outnumber their boomer parents; but alas, were without adequate available housing.

But now residential construction is beginning to meet the demand from new household formation that is back to the longer-term 1.2 million historical average, according to the U.S. Census Bureau. Millennials are paying down their college debt enough to move out of their rental or parents’ home, and forming more families.

There is more economic good news to report this week in upcoming columns. Industrial production has picked up in autos and trucks after the GM strike, according to the Federal Reserve, though not back to pre-recession levels. And job vacancies continue to soar with 1.4 million more vacancies than new job hires.

It means jobs are plentiful, so look for housing construction and home sales to keep this economic recovery afloat!

Harlan Green © 2019

Follow Harlan Green on Twitter: https://twitter.com/HarlanGreen

Monday, March 11, 2019

Homeownership Expands Again

The Mortgage Corner

New data indicate that in 2016, in defiance of myriad prognostications, the decade-long decline in the homeownership rate abruptly reversed. Once-rapid growth in renter households stalled, and the long-stagnant number of owner-led households began rising,” says the Washington Post’s Andrew Van Dam.
The homeownership of American households peaked at the height of the housing bubble at 69 percent, and only now has returned to post-recession levels. This is confirmed by several other indicators, including the big jump in household formation by the millennial generation, children of the baby boomers, in particular, who are now 22 to 38 years of age. It took them this long to buy because of the Great Recession that depressed incomes and huge amount of college debt.

And builders are beginning to realize that fact, as housing starts jumped back to historical levels in January to a 1.230 million annual rate. After falling 28 percent in December, starts in the West jumped 29 percent in January, as California began to recover from the record number of wildfires. The biggest region for home builders is the South where January starts rose 14 percent to more than reverse December's nearly 8 percent decline, which were also weather-related.

Another reason for the rise in homeownership has to be steadily rising rents since they hit bottom in 2008, and mortgages rates still at almost record lows. “In the middle of 2015, rents nationally rose more than 6 percent from a year earlier — easily their fastest growth since the real estate data experts at Zillow began keeping track. It is one of the few times on record that rents rose faster than home prices,” said Van Dam.
The last piece of the housing puzzle is the moderation of housing prices that no longer rise at 5 percent per year. The Case-Shiller same-home index year-on-year prices were up only 4.2 percent in the month which missed expectations by a very sharp 6 tenths. This is the lowest growth rate since November 2014 and compares with FHFA's 5.6 percent rate for December which was a 3-year low.

The surge in new households, as well as record low mortgage rates, have helped new-home sales as well. New home sales jumped 3.7 percent in December to a 621,000 annual rate that is on the high end of expectations, though December's year-on-year rate is still minus 2.4 percent.

We therefore see a steady improvement for home sales in 2019, since I predict interest rates could stay this low for the foreseeable future. Why? Economic growth is slowing, while consumer incomes are rising above inflation rate, and there is still a housing shortage.

Harlan Green © 2019

Follow Harlan Green on Twitter: https://twitter.com/HarlanGreen

Thursday, February 21, 2019

Housing Market Still Alive and Well!

The Mortgage Corner


The Mortgage Bankers Association said last week its Builder Applications Survey data for January showed mortgage applications for new home purchases jumped by 43 percent from December, though was unchanged from a year ago.  This should silence the doomsayers who predict labor shortages and higher tariffs are sure to kill the housing market.
"After two lackluster months, new home sales surged...in January to the fastest pace in our survey, dating back to 2013," said Joel Kan, MBA Associate Vice President of Economic and Industry Forecasting. "Despite the jitters potential homebuyers felt in December from the volatility in the financial markets, the healthy job market and wage growth, moderating price gains and lower mortgage rates all helped home sales recover. Additionally, builders seem to be seeing improvement in their labor shortages, as recently released government survey data showed increases in construction hiring and openings in December."
Mortgage interest rates have indeed come down with a vengeance since December. The 30-year conventional fixed rate guaranteed by Fannie Mae and Freddie Mac is now 3.75 percent for a one-point origination fee, and the so-called high-balance conventional rate is 4.0 percent with one origination point for the most credit-worthy borrowers.

That’s why home builders’ confidence index jumped 4 points to 62 from 58 (percent of those surveyed), according to the latest National Association of Home Builders/Wells Fargo Housing Market Index (HMI), which is also good news.

So housing construction isn’t about to die, which is a sign economic growth isn’t gasping for air either in this full employment, low-interest rate environment. February marked the second consecutive month in which all the HMI indices posted gains. The index measuring current sales conditions rose three points to 67, the component gauging expectations in the next six months increased five points to 68 and the metric charting buyer traffic moved up four points to 48.
“Builder confidence levels moved up in tandem with growing consumer confidence and falling interest rates,” said NAHB Chief Economist Robert Dietz. “The five-point jump on the six-month sales expectation for the HMI is due to mortgage interest rates dropping from about 5 percent in November to 4.4 percent this week. However, affordability remains a critical issue. Rising costs stemming from excessive regulations, a dearth of buildable lots, a persistent labor shortage and tariffs on lumber and other key building materials continue to make it increasingly difficult to produce housing at affordable price points.”
There is more to the jump in builder confidence and new-home construction. The millennial generation is forming more new households this year, and at least 50 percent have historically wanted to buy a home. Researchers at the San Francisco Federal Reserve have been finding such an increase.
“The shares of young adults heading households now are similar to rates seen at the start of the housing boom,” said SF Fed researchers. “Moreover, while more young adults are living at home longer, data suggest they are continuing to transition to higher headship rates as they get older…Given current 12-month annual headship rates by age group, the Census Bureau projections imply household formations averaging on the order of 1.4 to 1.5 million per year through 2020. That is much better than an average of a little less than 900,000 annually over the past five years.”
MBA estimated new single-family home sales at a seasonally adjusted annual rate of 713,000 units in January, based on data from the BAS, an increase of 29.2 percent from the December pace of 552,000 units. On an unadjusted basis, MBA estimated 54,000 new home sales in January, an increase of 45.9 percent from 37,000 new home sales in December, a whopping increase.   

Conventional loans composed 68.7 percent of loan applications, FHA loans composed 18.6 percent, RHS/USDA loans composed 0.5 percent and VA loans composed 12.2 percent. The average loan size of new homes decreased from $334,944 in December to $334,532 in January.

The jump in finance applications and home building in January shouldn’t be surprising. The U.S. economy continues to perk along, seemingly ignoring any bad news, such as the just-released FOMC minutes of the December meeting that sees cloudier skies ahead for the U.S. and world economies this year.

Harlan Green © 2019


Follow Harlan Green on Twitter: https://twitter.com/HarlanGreen

Friday, February 8, 2019

What is Driving Household Formation and Home Sales?

The Mortgage Corner


The growth in household formation, the major determinate of home ownership, is slowly returning to pre-housing bubble levels, according to a 2016 report by the San Francisco Fed’s economic research dept. This is a good sign for the future of new home construction as well, that has run a deep deficit since the end of the housing bubble.

The culprit in large part has been a millennial generation reaching adulthood—those born 1981 to 1996—that have been slow to leave home and form their own households, burdened with student debt and a slow to recover job market since the end of the Great Recession.

In 2014, the U.S. Federal Reserve released data about young households under the age of 35, (millennials), and perhaps one of the most striking data points was the low level of income. The median pre-tax income level for heads-of-household below the age of 35 was $35,300 per year. Comparable levels of income for previous years of the same demographic were $38,900 in 1995 and $43,900 in 2001 (all priced in 2013 dollars so we are looking at an apples-to-apples analysis). 
“The shares of young adults heading households now are similar to rates seen at the start of the housing boom,” said the SF Fed researchers. “Moreover, while more young adults are living at home longer, data suggest they are continuing to transition to higher headship rates as they get older…Given current 12-month annual headship rates by age group, the Census Bureau projections imply household formations averaging on the order of 1.4 to 1.5 million per year through 2020. That compares favorably to an average of a little less than 900,000 annually over the past five years.”
This could be boosting new-home sales, which eventually boosts housing construction. Sales of newly built, single-family homes jumped 16.9 percent to a seasonally adjusted annual rate of 657,000 units in November after an upwardly revised October report, reports the NAHB, and according to newly released data by the U.S. Department of Housing and Urban Development and the U.S. Census Bureau. This is the highest sales pace since March 2018. However, on a year-to-date basis, sales are down 7.7 percent from this time in 2017.

Even builders recognize they are dependent on new household formation. “Solid job growth and growing household formations should support future demand for housing even as builders continue to address mounting affordability woes,” said NAHB Chief Economist Robert Dietz. “Builders are doing all they can to hold the line on costs to meet this demand, particularly at the entry-level market.”
Existing-home sales aren’t doing so well. Existing-home sales ran at a seasonally adjusted annual rate of 4.99 million in December, the National Association of Realtors said Tuesday. That was the lowest since November 2015. Sales were down 6.4 percent for the month, and 10.3 percent lower than the year-ago rate.
Lawrence Yun, NAR’s chief economist, says current housing numbers are partly a result of higher interest rates during much of 2018. “The housing market is obviously very sensitive to mortgage rates. Softer sales in December reflected consumer search processes and contract signing activity in previous months when mortgage rates were higher than today. Now, with mortgage rates lower, some revival in home sales is expected going into spring.”
But there is also the problem low inventory. There was just a 3.7 months of unsold inventory at the current sales rate. This is much too low to sustain sales anywhere near normal rates, especially in the affordable range. “…there is still a lack of adequate inventory on the lower-priced points and too many in upper-priced points,” said Yun.

We therefore maybe seeing the end of a not so virtuous circle. A fully-employed economy is drawing more millennials to form households and purchase homes. It’s about time, as the oldest cohort of millennials are approaching 38 years of age.

And reinforcing the good news on the household formation front is that more millennial women are marrying—some 1.2 million were newly-weds in 2016, according to PEW Research. That means even more households are being formed

Harlan Green © 2019

Follow Harlan Green on Twitter: https://twitter.com/HarlanGreen

Tuesday, March 14, 2017

Homeownership Is Rising

The Mortgage Corner

An improving economy, multiple years of strong job growth and the notable increase in home values in most markets fueled a greater share of purchases from Generation X households over the past year, says the National Association of Realtors in a recent survey.

And that is helping to boost the all-important household formation of younger generations, which is what ultimately precipitates home sales, especially among those young adults who are forming families.

This is according to the National Association of Realtors® 2017 Home Buyer and Seller Generational Trends study, which evaluates the generational differences of recent home buyers and sellers. The survey additionally found that a growing number of millennials and younger boomer buyers have children living at home; student debt is common among Gen X and boomer households; more millennials are buying outside the city; and younger generations are more likely to use a real estate agent.


A notable shift in the relative household growth rates after 2007 reflects declines in “headship” rates, that is, the share of the population identified as heads of households, according to a report by the San Francisco Federal Reserve. It is mostly the result of the Great Recession that decimated the earning power of so many young adults, in particular. This means that for over five decades headship rates in the United States had increased on average before falling off in the wake of the financial crisis after 2007.

The patterns in headship rates over the housing cycle differ considerably across age groups. Specifically, in recent years most of the changes were among young adults. For two groups—ages 18 to 24 and ages 25 to 29—headship rates have declined appreciably in recent years. Headship rates among older age groups have been more stable.

Also apparent in the SF Fed’s chart is that headship rates among young adults rose considerably from the mid-1990s up to the financial crisis. That was the period of the strong housing market, rapidly rising house prices, and booming homeownership rates, including among young adults. Indeed, the movements in shares of young heads of household closely track the rise and decline in homeownership ratios.
"Gen X sellers' median tenure in their previous home was 10 years, which puts many of them selling a property they bought right around the time home values were on the precipice of declining," said NAR chief economist Lawrence Yun. "Fortunately, the much stronger job market and 41 percent cumulative rise in home prices since 2011 have helped a growing number build enough equity to finally sell and trade up to a larger home. More Gen X sellers are expected this year and are definitely needed to ease the inventory shortages in much of the country."
The uptick in purchases from Gen X buyers this year (28 percent) was the highest since 2014 and up from 26 percent in 2016. Millennials were the largest group of recent buyers for the fourth consecutive year (34 percent), but their overall share was down slightly from a year ago (35 percent). Baby boomers were 30 percent of buyers, and the Silent Generation made up 8 percent.

This year's survey also brought to light how the soaring cost of rent in many areas is likely influencing the decision of middle-aged parents to buy a home with their young adult children in mind. Younger boomers were the most likely to purchase a multi-generational home (20 percent; 16 percent in 2016), and the top reason for doing so was that children over 18 years old either moved back home or never left (30 percent; 27 percent in 2016).
"The job market is very healthy for young adults with a college education, but repaying student debt and dealing with ever-increasing rents on an entry-level salary are forcing many to either shack-up with several roommates or move back home," said Yun. "This growing trend of delayed household formation is one of the main contributors to the nation's low homeownership rate."
Similar to previous years, roughly two-thirds of millennial buyers are married. One aspect of their household that has changed is the number of children in them. In this year's survey, 49 percent of millennial buyers had at least one child, which is up from 45 percent last year and 43 percent two years ago.

With more kids in tow, the need for more space at an affordable price is increasingly pushing millennial buyers outside the city. Only 15 percent of millennial buyers bought in an urban area, which is down from 17 percent last year and 21 percent two years ago.
"Millennial buyers, at 85 percent, were the most likely generation to view their home purchase as a good financial investment," added Yun. "These strong feelings bode well for even greater demand in the future as more millennials settle down and begin raising families. A significant boost in new and existing inventory will go a long way to ensuring the opportunity is there for more of them to reach the market."
But that isn’t yet the case. Inventories are still in the 5-month range with current sales rates. So something must happen to increase housing inventories of existing homes, such as the sale of tens of thousands of foreclosed homes hedge funds purchased at fire sale prices when the housing bubble burst that are rental units.

The Blackstone’s Invitation Homes subsidiary, under the auspices of Blackstone's real estate leadership, began purchasing homes in 2012 and eventually amassed more than 60,000 homes, investing $1.2 billion in renovations. At one point it was reportedly spending $150 million per week on homes.

And now the Dallas-based single-family rental real estate investment trust, one of the largest in its class, raised $1.54 billion in an initial public offering this January. It priced 77 million shares at $20 each, well within its previously stated range of $18 and $21, said the press release.

So until hedge funds decide it’s no longer lucrative to hold rental properties, we may continue to experience a housing shortage, which means prices will continue to rise above the inflation rate for the foreseeable future.

Harlan Green © 2017

Follow Harlan Green on Twitter: https://twitter.com/HarlanGreen

Wednesday, June 15, 2016

Who Are the Homeowners?

The Mortgage Corner

The Atlanta Federal Reserve Bank just published a housing study entitled, “It’s Not Just Millennials Who Aren't Buying Homes,” that breaks down homeownership by age and household status. And the results show that age and whether one is head of a household makes a difference.


“In recent years, much attention has been focused on the growing tendency of millennials to rent,” says the Atlanta Fed study. “Theories for the decrease in homeownership among young adults abound. They include rising student debt levels that crowd out additional borrowing, a tendency to live in more urban areas where the cost to buy is relatively high, a generally tougher credit environment, and even shifts in the perception of homeownership in the wake of the housing bust.”
But in fact the homeownership rate has declined in all age brackets, except 65 + year-olds. Why is not clear. We know household incomes since 1980 have declined for all age brackets except seniors whose incomes are boosted by social security, Medicare, and other retirement benefits.
The study also shows that homeownership rates have actually returned to pre-housing bubble levels of 64 percent, the homeownership rate since the 1970s.
“The fact that the average U.S. homeownership rate is close to rates seen in the mid-1980s and mid-1990s while homeownership rates within age groups (under 65) are currently lower than their respective averages in the mid-1980s to mid-1990s suggests that factors other than age may be affecting the average person's decision to buy or rent.”
I believe it has to be declining household incomes that haven’t yet returned to pre-recession levels, even with record low interest rates. According to the Federal Reserve, the median household income was $51,939 in 2013, below the 1999 peak of around $57,000. The Census Bureau estimated real median household income at $53,657 for 2014 and $54,462 in 2015. Household income varies by race, with Asians the highest in 2014 at over $74,000 and African Americans the lowest around $35,000.


So household incomes have a long way to go to return to historic highs. A major reason has to be the soaring inequality that could take decades to correct; if and only if more progressive economic policies can be enacted—such as a wealth tax on large financial assets, and a higher maximum personal tax rate, which hasn’t yet even returned to 1980, Reagan era levels.

The nation’s aggregate household income has substantially shifted from middle-income to upper-income households, driven by the growing size of the upper-income tier and more rapid gains in income at the top. Fully 49 percent of U.S. aggregate income went to upper-income households in 2014, up from 29 percent in 1970. The share accruing to middle-income households was 43 percent in 2014, down substantially from 62 percent in 1970.

The bottom line is that married couple families still have the highest homeownership rate, whereas non-married singles have the lowest rate. What better reason to own a home than raising a family? And millennials are just now entering the age when they are beginning to form their own households, so their homeownership rate may also rise.

Harlan Green © 2016

Follow Harlan Green on Twitter: https://twitter.com/HarlanGreen

Tuesday, April 19, 2016

Builder Confidence Holds, But Household Formation Still Weak

The Mortgage Corner

Builder confidence in the market for newly-built single-family homes remained unchanged in April at a level of 58 on the National Association of Home Builders/Wells Fargo Housing Market Index (HMI).
“Builders remain cautiously optimistic about construction growth in 2016,” said NAHB Chief Economist Robert Dietz. “Solid job creation and low mortgage interest rates will sustain continued gains in the single-family housing market in the months ahead.”


And privately-owned housing starts in March were at a seasonally adjusted annual rate of 1,089,000. This is 8.8 percent below the revised February estimate for new construction of 1,194,000, but is 14.2 percent above the March 2015 rate of 954,000, according to the Census Bureau. This is the main reason builders’ confidence remains solid.

But for it to go higher, (and housing starts return to historical levels)—the formation of new households would also have to increase to historical levels, and that will take some time, given all those millennials aged between 18-36 years that either cannot afford to live alone, or choose to rent rather than purchase a home, according to the Census Bureau.


Graph: Bloomberg

This manifests itself in in the number of 25- to 34-year-olds of working age living at home. The rate began rising in 2003, fell briefly after the recession (perhaps because of first-time buyer-assistance programs), says Bloomberg’s Barry Ritzholtz, and then started rising again. As of last year, those still of working age still at home was at a record high.
It isn't merely living in their parents’ basements;” says Ritzholtz, “more young adults are doubling up in apartments. Census data has identified this as a fast-growing living arrangement. The central theme is that expensive housing, along with a dearth of economic opportunities, forces young adults into less-than-desirable living arrangements.”
Unfortunately, there is still a shortage of homes on the market, especially entry-level housing that most millennials can afford. Single-family housing starts in March, for instance, were at a rate of 764,000; this is 9.2 percent below the revised February figure of 841,000. The March rate for units in buildings with five units or more was 312,000.

And privately-owned housing units authorized by building permits in March were at a seasonally adjusted annual rate of 1,086,000. This is 7.7 percent below the revised February rate of 1,177,000, but is 4.6 percent above the March 2015 estimate of 1,038,000.

What is the current level of new household formation? Speaking on the country’s economic outlook and monetary policy at the Economic Leadership Forum in Somerset, New Jersey, Federal Reserve Bank of New York President Bill Dudley said the U.S. economy has its strengths and weaknesses—but he expects household formation to receive a boost in 2016.

“Housing starts are still well below the rate consistent with the nation’s population growth rate, and the fundamentals of housing demand remain positive,” Dudley said. “Rising employment is likely to boost the household formation rate and low mortgage interest rates should keep housing relatively affordable, despite the ongoing recovery in home prices.”
Harlan Green © 2016

Follow Harlan Green on Twitter: https://twitter.com/HarlanGreen

Wednesday, August 19, 2015

Higher Birth Rates Are Here

The Mortgage Corner

The mellennial generation, now aged 18 to 36 years, are beginning to drive higher birth rates. And that means more households being formed, which will ultimately create a higher demand for housing. Actually, a 4 million birth rate was breached in 2007, and births then declined due to the Great Recession. But the millennials are back above the 4 million birth rate again.

And housing construction is surging—no coincidence, given the rising demand for housing of any kind—rental as well as for prospective homeowners. Led by a strong jump in single-family production, nationwide housing starts inched up 0.2 percent to a seasonally adjusted annual rate of 1.206 million units in July, according to newly released data from the U.S. Department of Housing and Urban Development and the Commerce Department. This is the highest level since October 2007.

“This month’s drop in the more volatile multifamily side is a return to trend after an unusually high June,” said NAHB Chief Economist David Crowe. “While multifamily production has fully recovered from the downturn, single-family starts are improving at a slow and sometimes intermittent rate as consumer confidence gradually rebounds. Continued job and economic growth will keep single-family housing moving forward.” 

Births had declined for five consecutive years prior to increasing in 2013. They are about 7.7 percent below the peak in 2007 (births in 2007 were at the all-time high - even higher than during the "baby boom"). “I suspect certain segments of the population were under stress before the recession started,” says Calculated Risk’s Bill McBride, “- like construction workers - and even more families were in distress in 2008 through 2012. And this led to fewer babies.”

image

Graph: Calculated Risk

The above historical graph dates back to 1909, and the largest dip was before and during the Great Depression. It hit bottom in 1933, before beginning to rise again until it hit the baby boomer bulge of the 1950s and 60s.

This has to be the main reason home builder sentiment is at a 10-year high. The new home sector is increasingly a central source of strength for the economy and builders are increasingly optimistic, says the NAHB. The housing market index rose 1 point to a very strong 61 in August with the future sales component leading the way at 70. Current sales are at 66 with traffic continuing to lag but less so, at 45 for a 2 point gain in the month.

“Today’s report is consistent with our forecast for a gradual strengthening of the single-family housing sector in 2015,” said NAHB Chief Economist David Crowe. “Job and economic gains should keep the market moving forward at a modest pace throughout the rest of the year.”

Single-family starts rose 12.8 percent to a seasonally adjusted annual rate of 782,000 units after an upwardly revised June reading while multifamily production fell 17 percent to 424,000 units. And rising single family starts is another sure sign that more families and households are being formed.

What age group is having the most births? It is women in their 30s. The preliminary birth rate for women aged 30–34 in 2014 was 100.8 births per 1,000 women, up 3 percent from the rate in 2013 (98.0). The rate for this group has increased steadily since 2011. The number of births to women in their early 30s also increased in 2014, by 4 percent.

The rate for women aged 35–39 was 50.9 births per 1,000 women, up 3 percent from 2013 (49.3). The rate for this group has increased steadily since 2010. The number of births to women in their late 30s increased 5 percent in 2014.

Need we say more about the rising birth rate? All signs point to another upsurge in new household formation, needless to say, the main driver of real estate sales and the concomitant sectors that aid and drive RE—jobs in construction, insurance, professional fields, and banking, for starters.

Could it be that the real estate industry will drive 3 percent plus GDP growth for the rest of 2015, even if interest rates rise slightly? Rates are still at record lows with the conforming 30-year fixed rate at 3.625 percent for 1 origination point, and purchase mortgage applications still up 19 percent year over year, reports the Mortgage Bankers Association.

Harlan Green © 2015

Follow Harlan Green on Twitter: https://twitter.com/HarlanGreen

Wednesday, July 22, 2015

Existing-Home Sales at 8-Year High

The Mortgage Corner

It had to happen.  Why did June existing-home sales jump to an 8-year high? Fewer foreclosures is the short answer, hence more available for sale at market prices. But soaring consumer optimism due to an even better jobs market has to be the driving force causing families to build their nests.

Also, prices are rising to multi-year highs due to supply scarcities. And then there are the demographics, as the new generation is pushing older generations to move up or down, with even baby boomers wanting more retirement living.

Total existing-home sales, which are completed transactions that include single-family homes, townhomes, condominiums and co-ops, increased 3.2 percent to a seasonally adjusted annual rate of 5.49 million in June from a downwardly revised 5.32 million in May. Sales are now at their highest pace since February 2007 (5.79 million), have increased year-over-year for nine consecutive months and are 9.6 percent above a year ago (5.01 million).

image

Graph: Calculated Risk

Lawrence Yun, NAR chief economist, says backed by June's solid gain in closings, this year's spring buying season has been the strongest since the downturn. "Buyers have come back in force, leading to the strongest past two months in sales since early 2007," he said. "This wave of demand is being fueled by a year-plus of steady job growth and an improving economy that's giving more households the financial wherewithal and incentive to buy."

Inventories have dropped to 5 months, which is driving up prices. The median price, up 3.3 percent in the month to $236,400, is already a record. Part of the rise in prices is tied to a lack of distressed sales, at only 8 percent of June's total which is a record low, according to Econoday.

Adds Yun, "June sales were also likely propelled by the spring's initial phase of rising mortgage rates, which usually prods some prospective buyers to buy now rather than wait until later when borrowing costs could be higher."

And that may be an additional factor. Interest rates, though still low, have risen approximately ¼ percent since their most recent lows, with 30-year fixed conforming rates now 3.75 percent for a 1 point origination fee in California.

Total housing inventory3 at the end of June inched 0.9 percent to 2.30 million existing homes available for sale, and is 0.4 percent higher than a year ago (2.29 million). Unsold inventory is at a 5.0-month supply at the current sales pace, down from 5.1 months in May.

"Limited inventory amidst strong demand continues to push home prices higher, leading to declining affordability for prospective buyers," said Yun. "Local officials in recent years have rightly authorized permits for new apartment construction, but more needs to be done for condominiums and single-family homes."

The percent share of first-time buyers fell to 30 percent in June from 32 percent in May, but remained at or above 30 percent for the fourth consecutive month. A year ago, first-time buyers represented 28 percent of all buyers.

This is why housing starts surged nearly 10 percent last month to an annual rate of 1.17 million, just a touch below a post- recession high. Builders were especially active in the Northeast and South that suffered so much from last winter. We need more housing, in other words, as jobs and families continue to grow.

Harlan Green © 2015

Follow Harlan Green on Twitter: https://twitter.com/HarlanGreen

Tuesday, June 23, 2015

Housing Beginning to Bloom

The Mortgage Corner

Ultra-low interest rates are finally beginning to pay off.  The housing season is beginning to bloom—for first-time homebuyers, in particular. The National Association of Realtors reports total existing-home sales, which are completed transactions that include single-family homes, townhomes, condominiums and co-ops, rose 5.1 percent to a seasonally adjusted annual rate of 5.35 million in May from an upwardly revised 5.09 million in April, largely because of the surge in first time buyers. Sales have now increased year-over-year for eight consecutive months and are 9.2 percent above a year ago (4.90 million).

And new-home sales also soared. New single-family homes in the U.S. sold at an annual rate of 546,000 in May, hitting the fastest pace since February 2008, with growth in two of four regions, reports the U.S. Census Bureau this morning. And it revised April's rate to 534,000. May's sales rate was up 19.5 percent from a year earlier, signaling a healthy pick up, though recent sales rates remain below long-term averages.

image

Graph: Calculated Risk

This graph shows existing-home sales, on a Seasonally Adjusted Annual Rate (SAAR) basis since 1993. Sales in May (5.35 million SAAR) were 5.1 percent higher than last month, and were 9.2 percent above the May 2014 rate.

Lawrence Yun, NAR chief economist, says May home sales rebounded strongly following April's decline and are now at their highest pace since November 2009 (5.44 million). "Solid sales gains were seen throughout the country in May as more homeowners listed their home for sale and therefore provided greater choices for buyers," he said. "However, overall supply still remains tight, homes are selling fast and price growth in many markets continues to teeter at or near double-digit appreciation. Without solid gains in new home construction, prices will likely stay elevated — even with higher mortgage rates above 4 percent."

The percent share of first-time buyers rose to 32 percent in May, up from 30 percent in April and matching the highest share since September 2012. A year ago, first-time buyers represented 27 percent of all buyers.

"The return of first-time buyers in May is an encouraging sign and is the result of multiple factors, including strong job gains among young adults, less expensive mortgage insurance and lenders offering low down payment programs," said Yun. "More first-time buyers are expected to enter the market in coming months, but the overall share climbing higher will depend on how fast rates and prices rise."

The huge jump in existing-home sales means more demand for new homes, as we said last week. The median price of new homes fell 1 percent to $282,800 compared with May 2014, also a good sign for the first-time homebuyers. But there are still not enough homes for sale. The supply of new homes was 4.5 months at May's sales pace, down from 4.6 months in April.

New Home Sales

Graph: Calculated Risk

This is also why housing starts came in at a 1.036 million rate in May. Though down 11.1 percent from the April rate, which was already one for the record books. But April is now revised higher to 1.165 million, a 22.1 percent gain from March. Sealing matters is another gigantic surge in permits, up 11.8 percent to 1.275 million following a 9.8 percent gain in April.

And this is buttressed by builder confidence in the market for newly built, single-family homes in June up five points to a level of 59, according to the National Association of Home Builders/Wells Fargo Housing Market Index (HMI). This is the highest reading since September 2014, and in fact returns the index to pre-bubble (2001-02) levels.

Why the huge construction increase in June? This is while mortgage rates are rising, up some 0.375 percent since their most recent lows to 3.875 percent for 0 points in origination fees for a 30-year fixed rate conforming loan.

Firstly, it means consumers are confident enough in their future to begin to look for housing to support their growing families.  And the millennial generation aged 18 to 36 years has already surpassed their parents’ baby boomer population size, and will exceed it by 2020, according to demographers. This has to be why household formation is finally returning to normal levels of 1 million plus new households being formed per year, as the so-called echo boomers move out of their parents’ homes and or leave college to make their own nests.

So forecasters will probably be revising their second-quarter GDP estimates higher following the better housing numbers, not to mention their estimates for Thursday's index of leading economic indicators where permits are one of the components, as we said last week.

Harlan Green © 2015

Follow Harlan Green on Twitter: https://twitter.com/HarlanGreen

Wednesday, June 17, 2015

Housing Construction Soars

The Mortgage Corner

Housing construction is taking off, as I predicted two weeks ago. The numbers show actual construction starts accelerating as well as building permits for future construction. It is also boosting builder confidence to a level that signals continued growth in new construction.

As Econoday reported, “Don't let the headline fool you (i.e., slight drop in June), the housing starts & permits report points to solid strength for the housing sector.” Though the Calculated Risk graph shows how far the housing market is from a true recovery. It is only now returning to the lows of the 1990 recession.

image

Graph: Calculated Risk

Housing starts came in at a 1.036 million rate in May, down 11.1 percent from the April rate but the April rate, which was already one for the record books, is now revised higher to 1.165 million, a 22.1 percent gain from March. Sealing matters is another gigantic surge in permits, up 11.8 percent to 1.275 million following a 9.8 percent gain in April.

And builder confidence in the market for newly built, single-family homes in June rose five points to a level of 59, according to the National Association of Home Builders/Wells Fargo Housing Market Index (HMI). This is the highest reading since September 2014, and in fact returns the index to pre-bubble (2001-02) levels.

image

Graph: Calculated Risk

“The HMI indices measuring current and future sales expectations are at their highest levels since the last quarter of 2005, indicating a growing optimism among builders that housing will continue to strengthen in the months ahead,” said NAHB Chief Economist David Crowe. “At the same time, builders remain sensitive to consumers’ ability to buy a new home.”

All three HMI components posted healthy gains in June. The component gauging current sales conditions jumped seven points to 65, the index charting sales expectations in the next six months increased six points to 69, and the component measuring buyer traffic rose five points to 44, said the press release.

Why the huge construction increase in June? This is while mortgage rates are rising, up some 0.375 percent since their most recent lows to 3.875 percent for 0 points in origination fees for a 30-year fixed rate conforming loan. Firstly, it means consumers are confident enough in their future to begin to look for housing to support their growing families.

And this is, of course, the millennial generation aged 18 to 36 years that has already surpassed their parents’ baby boomer population size, and will exceed it by 2020, according to demographers.

image

Graph: CNBC

Also, household formation is finally returning to normal levels of 1 million plus new households being formed per year, as the so-called echo boomers move out of their parents’ homes and or leave college to make their own nests.

Household formation has been unusually low over the past seven years, averaging 577,000 new households. Whereas, there are approximately 15 million new households per decade being formed during normal times.

So, "there's a ton of people living in basements," Tommy Lee of Fundstrat Global Advisors said in an interview with CNBC's "Trading Nation." "Two quarters of pretty decent household formation isn't getting everybody out of the basement. I think this means we have multiple years where household formations are well over 1.3 million, 1.4 million."

Forecasters will be revising their second-quarter GDP estimates higher following today's report, says Econoday, not to mention their estimates for Thursday's index of leading economic indicators where permits are one of the components.

Harlan Green © 2015

Follow Harlan Green on Twitter: https://twitter.com/HarlanGreen

Tuesday, May 26, 2015

New-Home Sales, Case Shiller Index On the Rise

The Mortgage Corner--II

As if to confirm U.S. housing starts and building permits’ jump to their highest levels in nearly 7-1/2 years, the sales rate of new single-family houses in April 2015 rose even higher at a seasonally adjusted annual rate of 517,000, according to estimates released jointly today by the U.S. Census Bureau and the Department of Housing and Urban Development. “This is 6.8 percent above the revised March rate of 484,000 and is 26.1 percent above the April 2014 estimate of 410,000,” per the Census Bureau.

image

Graph: Calculated Risk

It means home construction is returning to pre-recession levels, as is the demand for more housing, which will spur more housing construction. The sales rate is rising fast enough to drop housing inventories to 4.6 months, at the low end of inventories.

The south was the biggest gainer, with construction up 5.8 percent. Also, the median price rose to $297,300 for a strong 8.3 percent year-on-year gain. So sales have finally reached the long term trend line, which should signal a longer term recovery as buyer’s enthusiasm tends to feed on itself, according to Behavioral Economist and Nobelist Dr. Robert Shiller.

image

Graph: Calculated Risk

As if to confirm the rising enthusiasm of buyers, the S&P Case-Shiller Home Price Index continued its climb to post-recession highs, with San Francisco now up 10.31 percent year over year, Denver and Dallas up 10 percent and 9.3 percent, respectively. Denver and Dallas housing prices have almost doubled since the Great Recession, per the above graph. San Francisco’s prices are just now approaching their bubble high.

“Home prices have enjoyed year-over-year gains for 35 consecutive months,” says David M. Blitzer, Managing Director & Chairman of the Index Committee for S&P Dow Jones Indices. “The pattern of consistent gains is national and seen across all 20 cities covered by the S&P/Case-Shiller Home Price Indices…”

Of course lower interest rates were also a factor, as I’ve said, with housing affordability increasing this year, according to the National Association of Home Builders/Wells Fargo Housing Opportunity Index (HOI).

In all, 66.5 percent of new and existing homes sold between the beginning of January and end of March were affordable to families earning the U.S. median income of $65,800, said the report. “This is up from the 62.8 percent of homes sold that were affordable to median-income earners in the fourth quarter.”

What is another catalyst? Housing formation is recovering, which is largely due to Millennials moving out of their parents’ homes, or higher education venues. Based on unusually low household formation numbers of past several years, "there's a ton of people living in basements," Fundstrat Global Advisors' Tom Lee said in a recent interview with CNBC's "Trading Nation." "Two quarters of pretty decent household formation isn't getting everybody out of the basement. I think this means we have multiple years where household formations are well over 1.3 million, 1.4 million."


Household formation will be the key to future housing growth, as the millenials’ population size has now reached that of the baby boomers, their parents. And many have yet to reach home-buying age. Household formation had dipped as low as 360,000 per annum in recent years, due to the housing bust. So this is yet another sign of a growing pool of homebuyers.

Harlan Green © 2015

Follow Harlan Green on Twitter: https://twitter.com/HarlanGreen

Tuesday, April 7, 2015

Mortgage Delinquencies Close to Pre-Recession Lows.

The Mortgage Corner

Calculated Risk reports Black Knight Financial Services (BKFS) released their Mortgage Monitor report for February on Monday. According to BKFS, 5.36 percent of mortgages were delinquent in February, down from 5.56 percent in January. BKFS reported that 1.58 percent of mortgages were in the foreclosure process, down from 2.22 percent in February 2014. This is approaching historical lows for delinquencies, and should mean a very good year for housing.

image

Graph: Calculated Risk

February’s delinquency rate, while still 17 percent above the pre-crisis norm of 4.6 percent, was down 49 percent from its January 2010 peak of 10.6 percent. And at 1.58 percent, the foreclosure rate remained 175 percent above precrisis norms, but was still down 63 percent from its October 2011 peak, reports Black Knight.

This breaks down as:

· 1,646,000 properties less than 90 days past due, but not in foreclosure.

· 1,067,000 properties that are 90 or more days delinquent, but not in foreclosure.

· 800,000 loans in foreclosure process.

It also means last week’s jump in Pending Home Sales was no fluke, as lower delinquency rates mean more homes with positive equity are increasing housing inventories. The National Association of Realtors Pending Sales Index is at its highest level since June 2013 (109.4), has increased year-over-year for six consecutive months and is above 100 – considered an average level of activity – for the 10th consecutive month.

So what will happen in 2015? Mortgage applications have also jumped, particularly purchase applications, as we said last week. "There was a broad based increase in mortgage applications last week (April 1) relative to the week prior. The increase in purchase volume was led by a nearly 6 percent increase in both conventional and government markets, perhaps signaling that households are finally ready to begin the home-buying season," said Lynn Fisher, MBA's Vice President of Research and Economics.

But that is largely because of still record low interest rates. The Fed wants to begin to raise interest rates sometime this year, but growth has slowed recently, due to the another severe winter, and a soaring dollar value that hurts exports. So the latest words from the Fed Governors are that low interest rates should be around for a while longer.

New York Fed Governor William Dudley said as much recently. “…as Chair Yellen remarked in her most recent press conference, removal of “patient” from the statement does not indicate that we will be “impatient” to begin to normalize monetary policy.  Rather, the timing of normalization will be data dependent and remains uncertain because the future evolution of the economy cannot be fully anticipated.”

The housing market will have a very good year, according to Core Logic’s 2015 housing forecast. “The U.S. economy is poised to grow by close to 3 percent in 2015, generating a 3- to 3.5-million-person gain in employment,” said Core Logic chief economist Frank Nothaft. “This job growth, coupled with very low mortgage interest rates and some easing in credit access, is expected to propel both owner-occupant and rental housing activity this year. This heightened level of housing demand should translate to the best home sales market in eight years.”

Let us hope the Fed remains patient for first-time homebuyers that require affordable loan rates, in particular, and are just now entering the housing market.

Harlan Green © 2015

Follow Harlan Green on Twitter: https://twitter.com/HarlanGreen

Monday, March 16, 2015

2014 Household Formation Rebounds

Financial FAQs

Breaking news. The latest Homeownership & Vacancy Survey, released by the Census Bureau, estimated household formation surged to 1.7 million in 2014 from 400,000 the previous year. That is really big news. Household formation, which is the bottom line demand factor for RE sales, mortgage financing, as well as the insurance and construction industries—in fact, anything related to the housing market--may finally begin to show growth from the horrible post-Great Recession years.

image

Graph: Trading Economics

This graph tells the story. Projections were for a recovery to 800,000 new households in 2014, but it looks like Millennials are beginning to leave home, or even college, and form new households in greater numbers—especially the oldest ages from 30 to 36 years. And most demographers agree millennials were born between 1980 to 1996, which means the oldest are reaching the age when they want to start a family, and that usually means buying a home.

Many of those have been renting, and we actually saw a 2.1 million surge in rental units in 2014, which has to account for many of those new households, according to the Census Bureau survey.

In fact, over the past year all the growth in net household formations has been among renters, according to the U.S. Census. For those 35 years old and younger, their home ownership rate has fallen from 44 percent to 36 percent over the past decade, which is why construction of multi-family apartments is at the highest level in a quarter-century this year.

And we know why. They can’t afford to buy until they reach an older age—in fact 30 years of age is when they achieve the median income wage of $42,000, according to a new Georgetown University study.

Through analyzing about three decades of census data—from 1980 to 2012—the study found that on average, young workers are now 30 years old when they first earn a median-wage income of about $42,000, a marker of financial independence, up from 26 years old in 1980.

image

Graph: fivethirtyeight.com

Economists now estimate millennials will spend some $1.6 trillion on home purchases and $600 billion on rent over the next five years, more per person than any other generation with more of them opting for more affordable rents versus paying the big price tags to buy homes, according to a new report from The Demand Institute, a non-profit think tank operated by The Conference Board and Nielsen. Millennials will form just over eight million new households, albeit most of them rental households, as we said.

But there is some good income news. The 2014 numbers aren’t in for a breakdown in median incomes, but the Q4 2014 Federal Reserve Flow of Funds report says the net worth of households and nonprofits rose to $82.9 trillion during the fourth quarter of 2014. The value of directly and indirectly held corporate equities increased $742 billion and the value of real estate rose $356 billion.

This can only boost the millennial generation’s financial well-being, as well, and so the housing market and its ancillary industries.

Harlan Green © 2015

Follow Harlan Green on Twitter: https://twitter.com/HarlanGreen

Wednesday, January 7, 2015

Good Pending Sales, Home Prices in 2015

The Mortgage Corner

Pending home sales are rising again. Sales picked up steam in November, to 104.8 from a revised 104.0 in October for a better-than-expected gain of 0.8 percent. It is a sign, along with the Case-Shiller Home Price Index, that the housing market will pick up in 2015.

image

Graph: Econoday

Pending sales had been declining since last September, and only began to rise again this January. But they are still below post-recession highs. Rising prices may be the culprit, as the Case-Shiller Home Price Index rose 13.5 percent in 2014, but has now settled back to moderate 4.5 percent annual increases in recent months.

"The consistent economic growth and steady hiring we've seen the second half of this year is giving buyers enough assurance to consider purchasing a home before year's end," said NAR chief economist Lawrence Yun. "With rents now rising at a seven-year high, historically low rates and moderating price growth are likely to entice more buyers to enter the market in upcoming months."

image

Graph: Econoday

Where are those new buyers coming from? The main reason could be fresh data that show those 18 to 25 year-olds are finally leaving home, or school, when the lack of first-time homebuyers has kept existing-home sales from breaking out of a narrow range since 2009 and the end of the Great Recession. This is while housing prices have moderated their double-digit climb in 2014, making housing more affordable to those now able to find jobs.

Case-Shiller's 20 city year-on-year index for October (both adjusted and unadjusted) came in soft, at plus 4.5 percent, says Econoday, down 3 tenths from September. This is the lowest rate since October 2012 and follows a full year of low double digit gains through much of 2013 and into April this year.

So ‘the times they are a changin’. Household formation is increasing again, and history says at least 50 percent of those new householders will purchase a home. Fortune Magazine has just cited Neil Dutta, head of economics at Renaissance Macro Research, who pointed out in a note to clients that household formation in 2014 through September is already at its highest rate since 2005.

image

Graph: Fortune.com

The employment rate for folks aged 25 to 34 has grown 2.8 percent over the past year, about 29 percent faster than the overall employment rate, and they make up the largest generation ready to enter the housing market, larger than their baby boomer parents.

And don’t forget those record low interest rates, now back to last year’s pre-April rates, before Fed Chair Bernanke announcement that QE3 would end. The 30-year fixed conforming rate is now down to 3.50 percent with 0 origination points in California, for those with the best credit scores.

Harlan Green © 2014

Follow Harlan Green on Twitter: https://twitter.com/HarlanGreen

Wednesday, December 31, 2014

What Will 2015 Bring?

Popular Economics Weekly

We already have an idea of what will happen in 2015. Firstly, job creation should continue to exceed 300,000 payroll jobs per month. Nobelist Paul Krugman is especially optimistic about economic growth, given that we have escaped much of the austerity budget cuts taken by the Eurozone and Japan.

“What about the prospects looking forward? As I’ve pointed out before, business investment has been relatively strong throughout. Residential investment, however, has been very low since 2006, suggesting that there’s a backlog of pent-up demand, which should come into play in an improving job market. So that’s one source of strength. Also, low oil prices are going to be mostly positive, although with some adverse regional effects; more on that in a later post.”

image

Graph: Trading Economics

We would also posit that current economic growth will remain high in 2015, following consecutive 4.6 and 5 percent growth rates in Q2 and Q3. This is because government hiring will continue to pick up as effects of the Great Recession wear off, which has been the main drag on growth, as Professor Krugman says.

"Since Obama took office, we’ve gained 6.7 million private-sector jobs, compared with just 3.1 million at the same point under Bush. But under Bush we’d added 1.2 million public sector jobs, while under Obama we’ve cut 600,000. The point is that relatively good private sector performance has been masked by public-sector cutbacks; this is the opposite of what you usually hear, but that’s no surprise.”

And Fed Chair Janet Yellen is determined to keep interest rates low until wage and salaries climb above the 2 percent inflation rate, which might happen in 2015 with continuing strong job growth.

The weak growth link remains the housing market, and any improvement will be closely watched by economists. The key will be adequate population growth (with more new household formation), especially from the millennials, children of the baby boomers as we have been saying.

Several housing specialists, including the NAR’s Realtor.com, Jed Kolko of Trulia.com, and even Robert Shiller of the Case-Shiller Housing Price Index see a better housing market in 2015. But increased household formation of those millennials that have been living with their parents, or renting, are the key. And 2015 looks to be the year when they begin to buy homes, according to Fortune Magazine’s Fortune.com. Historical household formation has been some 1 million new households per year, but has been less than half the historical average since the end of the housing bubble.

image

Graph: Fortune

Why? Millennials job growth, for one: “In 2014, it’s been a banner year for employment but parsed by age groups those under 35 have been gaining jobs at a 60 percent faster rate than rest – one of the best years for employment was even better for millennials,” said Realtor.com economist Jonathan Smoke in his recent release of the 2015 housing forecast.

And the oldest cohort of 25-34 puts the majority of millennials out of school and getting married. That’s combined with birth rates putting 2014 in the running for highest volume of births in years, as millennials outnumber their baby boomer parents by as much as 10 percent (as much as 88 million vs. 77 million baby boomers).

We will see what else 2015 brings, of course. More new, entry-level homes will have to be built, of course, so builders have to get the message that millennials won’t be able to afford the homes and higher prices tolerated by their parents.

There are indications that home builders are already doing this. For example, CNBC’s Diana Olick reports homebuilder D.R. Horton has a new brand, Express Homes that offers properties at $120,000 to $150,000 in lower priced states such as Texas and Georgia, well below the national median price of a new home, which in March came in at a record $290,000, according to the U.S. Census.

In other words, if and when housing returns to normal growth levels, we should see more sustained overall economic growth for 2015 and beyond.

Harlan Green © 2014

Follow Harlan Green on Twitter: https://twitter.com/HarlanGreen
Tuesday, August 19, 2014

Lower Household Debt, Housing, Now Boosting Growth

The Mortgage Corner

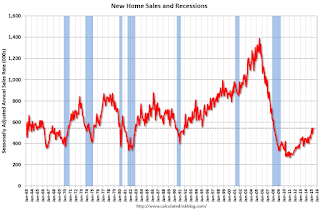
In another sign that this could be a better growth year, builder confidence in the market for newly built, single-family homes rose two points to 55 on the National Association of Home Builders/Wells Fargo Housing Market Index (HMI) for August, and housing starts surged. This third consecutive monthly gain brings builder optimism to its highest level since January, and housing starts to the highest level in 8 months.

And housing has been the missing component of GDP growth since the end of the Great Recession, which is another sign that 3 percent plus GDP growth is in the cards for the rest of this year and maybe next year as household formation (mainly the millennial generation of 18 to 36 year-olds finally leaving home) returns to normal levels.

icap

Graph: Wrightson ICAP

All three HMI components posted gains in August. The indices gauging current sales conditions and expectations for future sales each rose two points to 58 and 65, respectively. The index gauging traffic of prospective buyers increased three points to 42.

"Each of the three components of the HMI registered consecutive gains for the past three months, which is a positive sign that builder confidence appears to be firming following an uneven spring," said NAHB Chief Economist David Crowe. "Factors contributing to this rise include sustained job growth, historically low mortgage rates and affordable home prices, which are helping to unleash pent-up demand."

Based in part on the strength in the NAHB index last month, Wrightson ICAP, a leading financial market data provider, expects a third straight solid increase in single-family building permits in today’s July report. Today’s NAHB data suggest that the uptrend in permits will continue into August.

And sure enough, U.S. housing starts jumped 15.7 percent in July, hitting the highest level in eight months. The 1.09 million annual rate of new housing starts topped economist expectations of 975,000. And permits for new construction, a sign of future demand, rose 8.1 percent to an annual rate of 1.05 million from 973,000 in June.

Some lenders are getting around the tight lending conditions and higher risk fees imposed by the Fed on conventional mortgages guaranteed by Fannie Mae and Freddie Mac, in particular. For instance, they are beginning to offer interest only mortgages again, though borrowers have to be qualified at the fully amortized interest rate, rather than the lower interest only payment.

And, the July 2014 Senior Loan Officer Opinion Survey on Bank Lending Practices showed a continued easing of lending standards and terms for many types of loan categories amid a broad-based pickup in loan demand. “Although many banks reported having eased standards for prime residential real estate (RRE) loans,” said the report, “respondents generally indicated little change in standards and terms for other types of loans to households.”

However, a few large banks had eased standards, increased credit limits, and reduced the minimum required credit score for credit card loans. Banks also reported having experienced stronger demand over the past three months, on net, for many more loan categories than on the April survey.

The good news, though, was that many of the new Quality Mortgage standards imposed by the CPFB (i.e., 43 percent maximum debt-to-income ratios, no interest only provisions) don’t apply to GSE guaranteed mortgages, if they meet the stricter conforming underwriting criteria.

What all this means is that banks are willing to lend again, which should put some of that cash savings’ hoard back to work that is held by banks and wealthy individuals. Market Watch’s Rex Nutting has reported on this extensively.

deposits

Graph: Marketwatch

“The majority of Americans are doing their patriotic bit, spending nearly everything they earn,” writes Nutting. “ A recent report from the Fed showed that little more than a third of families are able to save any money at all after they pay their bills each month. More than 60 percent say they couldn’t come up with $400 in an emergency without borrowing or pawning something.”

The bottom line is that most people are saving next to nothing, while just a few are saving a large amount of their personal disposable income (i.e., after taxes). A recent bankrate.com survey found that the top 1 percent save some 36 percent of their income, whereas the overall personal savings rate for all Americans is still not much more the 5 percent at present.

It speaks to the unequal income distribution since the end of the Great Recession, with lower and middle class income earners actually losing income—in part due to the housing bust—and those able to profit from the rise in financial markets garnering almost 100 percent of the income gain since then. Those who do save are saving a ton — more than $1.2 trillion a year of the $10.8 trillion held in financial assets, rather than investing in productive capacity.

Harlan Green © 2014

Follow Harlan Green on Twitter: https://twitter.com/HarlanGreen