Showing posts with label conforming loans. Show all posts

Wednesday, February 22, 2017

Home Sales Reach 10-year High

Financial FAQs

Existing-home sales ran at a seasonally adjusted annual pace of 5.69 million, the National Association of Realtors said Wednesday. That was 3.3 percent above an upwardly-revised 5.51 million in December and 3.8 percent higher than a year ago.

Total existing-home sales , which are completed transactions that include single-family homes, townhomes, condominiums and co-ops, expanded 3.3 percent to a seasonally adjusted annual rate of 5.69 million in January from an upwardly revised 5.51 million in December 2016. January's sales pace is 3.8 percent higher than a year ago (5.48 million) and surpasses November 2016 (5.60 million) as the strongest since February 2007 (5.79 million), which marked the end of the housing bubble.


Lawrence Yun, NAR chief economist, says January's sales gain signals resilience among consumers even in a rising interest rate environment. "Much of the country saw robust sales activity last month as strong hiring and improved consumer confidence at the end of last year appear to have sparked considerable interest in buying a home," he said. "Market challenges remain, but the housing market is off to a prosperous start as homebuyers staved off inventory levels that are far from adequate and deteriorating affordability conditions."
But in fact interest rates have risen substantially only for the less than perfect credit holders, as my recent column has highlighted—those with credit scores below 700 with less than 20 percent down payment, and debt-to-income ratios below 30 percent.

The median existing-home price for all housing types in January was $228,900, up 7.1 percent from January 2016 ($213,700). This is yuge. January's price increase was the fastest since last January (8.1 percent) and marks the 59th consecutive month of year-over-year gains.

Total housing inventory at the end of January rose 2.4 percent to 1.69 million existing homes available for sale, but is still 7.1 percent lower than a year ago (1.82 million) and has fallen year-over-year for 20 straight months. Unsold inventory is at a 3.6-month supply at the current sales pace (unchanged from December 2016).

It is a record low housing inventory of homes for sale, and means that housing construction hasn’t been able to keep up with the demand for housing, another reason prices are rising so fast and first-time homebuyers are having such a hard time finding affordable housing.

Then we have overly restrictive mortgage qualification standards, mainly because Fannie Mae and Freddie Mac, the main guarantors of conforming mortgages are still ‘owned’ by the US Treasury, which has imposed draconian fees on prospective borrowers with less than perfect credit scores.

NAR President William E. Brown talks about this problem that could possibly drag down inventory for would-be buyers even further in coming months. "Supply and demand imbalances continue to be burdensome in many markets, and now Fannie Mae is supporting a Wall Street firm's investment in single-family rentals," he said. "This will only further hamper tight supply and put major investors in direct competition with traditional buyers. Instead, the GSEs should lower overly burdensome fees (link is external) and help qualified borrowers become homeowners."
"Competition is likely to heat up even more heading into the spring for house hunters looking for homes in the lower- and mid-market price range," added Yun. "NAR and realtor.com®'s new ongoing research — the Realtors® Affordability Distribution Curve and Score — revealed that the combination of higher rates and prices led to households in over half of all states last month being able to afford less of all active inventory on the market based on their income." 
First-time buyers were 33 percent of sales in January, which is up from 32 percent both in December and a year ago. NAR's 2016 Profile of Home Buyers and Sellersreleased in late 2016 — revealed that the annual share of first-time buyers was 35 percent.

Much will depend on whether Janet Yellen’s Fed can continue to keep interest rates at their historic lows. Conforming 30-year fixed rates are still obtainable at interest rates as low as 3.50 percent for those with credit scores above 740—those almost perfect credit score holders. It will be more difficult for the rest, unless the US Treasury eases its death grip on Fannie and Freddie, which would allow many more—as many as 1.1 million more to qualify for an affordable home, according to the Urban Institute.

Harlan Green © 2017

Follow Harlan Green on Twitter: https://twitter.com/HarlanGreen

Monday, November 28, 2016

Conforming Mortgage Limits Rise for 2017

Financial FAQs

The Federal Housing Finance Authority, or FHFA, just announced it is increasing the limit for conforming mortgages from $417,000 to $424,100 in most regions of the United States starting Jan. 1, 2017—the first such increase since 2006.

The approximately 1.7 percent bump in the baseline conforming loan limit follows the FHFA’s announcement that  the average U.S. home price has returned to its pre-decline peak, which it hit in the third quarter of 2007. The FHFA bases the loan cap on its quarterly Housing Price Index, which gauges average single-family home prices. The index rose 1.5 percent during the third quarter of 2016 and is up 6.1 percent over the past year, enough to push it above its previous high point.


The FHFA is the supervising entity of conforming loans guaranteed by Fannie Mae and Freddie Mac.
FHFA house price index eased slightly in September and was up 0.6 percent after increasing 0.7 percent in August. On the year, the FHFA index surged to plus 6.1 percent, down from August's gain of 6.4 percent. In the third quarter, house prices were up 1.5 percent and were 6.1 percent higher than the third quarter in 2015. 

Eight of nine census divisions posted monthly gains in September ranging from plus 1.3 percent in the in the Pacific with the Northeast declining 0.2 percent. On the year, the Pacific region was up 8.1 percent with New England in the rear at 2.9 percent.

Conforming loan limits are significant because they apply to home loans that meet the underwriting guidelines of Fannie Mae or Freddie Mac, the government-sponsored entities that acquire mortgages from lenders and ensure a steady flow of money to the mortgage market.
Interest rates for nonconforming, or jumbo mortgages, are generally higher than rates for loans that fall under the cap, and these types of mortgages can be more difficult to obtain.
“Today’s conforming loan limit increase is a much-needed recognition of rising home prices in high-cost markets, and a help to first-time and lower-income borrowers looking to utilize an FHA mortgage,” said NAR President William E. Brown. “Credit remains tight, but this decision will help more qualified buyers address the hurdles and high costs standing between them and the dream of homeownership.”
Conforming loan limits are higher than the baseline cap in parts of the country where home prices are especially high, but cannot be more than 150 percent of the baseline limit—$636,150 for 2017—for the contiguous U.S. Exceptions are established for Alaska, Hawaii, Guam, and the U.S. Virgin Islands, where loan limits in specific locations may exceed that amount.

Harlan Green © 2016

Follow Harlan Green on Twitter: https://twitter.com/HarlanGreen

Tuesday, September 15, 2015

Construction, Retail Sales Higher

The Mortgage Corner

The strength of the economy right now is in the housing and construction sectors, again areas insulated from global factors, such as China’s slowdown. Construction spending, next to vehicle sales, is perhaps the week's best surprise, rising 0.7 percent for a second straight month, and 13.7 percent annually. Why? Rents are rising fast, which means many householders will start thinking about whether buying with today’s ultra-low mortgage rates as the better alternative.

image

Graph: Econoday

The Econoday graph shows the slope has steepened nicely in the spring and summer. The latest gain is centered in the most important component of all, single-family homes where construction spending rose 2.1 percent in the month for a year-on-year gain of 15.8 percent. Multi-family homes slowed in the month but the year-on-year rate, reflecting demand tied to high rents, is still outstanding at 21.2 percent.

image

Graph: Econoday

And auto sales are up a surprising 1.5 percent to a 17.8 million annual rate, with 14.1 million sales of domestic-made vehicles. The gain points to another strong month for retail sales in what would underscore the insulated strength of the domestic economy. It was outsized strength in the auto sector that supported the factory sector in June and July, though August's sales gain was centered in foreign-made vehicles. Still, sales of domestic-made cars and light trucks, which make up 80 percent of all sales, are at very strong levels.

In fact, retail sales just in this morning show a 2.2 percent annual gain, with strong sales in auto and food service. It could ave been above 3 percent if gas prices hadn’t fallen, but then would consumers be buying as much if gas prices were higher? This should mean Q3 GDP growth will again exceed 3 percent, following a revised Q2 reading of 3.7 percent by the BEA.

image

Graph: Calculated Risk

Will more renters be buying homes this year? The best way to compare rents to housing prices is the price-to-rent ratio. It is leveling off, which means rents are rising as fast as housing prices—some 5 percent of late. Combine that with conforming 30-year fixed mortgage rates of 3.75 percent, and we will have more renters looking to buy a home this year, at least. And the tax advantages of owning vs. renting really mean it’s more advantageous to buy over the longer term, rather than give the tax advantages to a landlord.

Harlan Green © 2015

Follow Harlan Green on Twitter: https://twitter.com/HarlanGreen

Tuesday, June 23, 2015

Housing Beginning to Bloom

The Mortgage Corner

Ultra-low interest rates are finally beginning to pay off.  The housing season is beginning to bloom—for first-time homebuyers, in particular. The National Association of Realtors reports total existing-home sales, which are completed transactions that include single-family homes, townhomes, condominiums and co-ops, rose 5.1 percent to a seasonally adjusted annual rate of 5.35 million in May from an upwardly revised 5.09 million in April, largely because of the surge in first time buyers. Sales have now increased year-over-year for eight consecutive months and are 9.2 percent above a year ago (4.90 million).

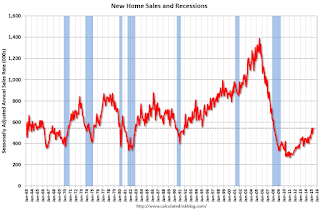
And new-home sales also soared. New single-family homes in the U.S. sold at an annual rate of 546,000 in May, hitting the fastest pace since February 2008, with growth in two of four regions, reports the U.S. Census Bureau this morning. And it revised April's rate to 534,000. May's sales rate was up 19.5 percent from a year earlier, signaling a healthy pick up, though recent sales rates remain below long-term averages.

image

Graph: Calculated Risk

This graph shows existing-home sales, on a Seasonally Adjusted Annual Rate (SAAR) basis since 1993. Sales in May (5.35 million SAAR) were 5.1 percent higher than last month, and were 9.2 percent above the May 2014 rate.

Lawrence Yun, NAR chief economist, says May home sales rebounded strongly following April's decline and are now at their highest pace since November 2009 (5.44 million). "Solid sales gains were seen throughout the country in May as more homeowners listed their home for sale and therefore provided greater choices for buyers," he said. "However, overall supply still remains tight, homes are selling fast and price growth in many markets continues to teeter at or near double-digit appreciation. Without solid gains in new home construction, prices will likely stay elevated — even with higher mortgage rates above 4 percent."

The percent share of first-time buyers rose to 32 percent in May, up from 30 percent in April and matching the highest share since September 2012. A year ago, first-time buyers represented 27 percent of all buyers.

"The return of first-time buyers in May is an encouraging sign and is the result of multiple factors, including strong job gains among young adults, less expensive mortgage insurance and lenders offering low down payment programs," said Yun. "More first-time buyers are expected to enter the market in coming months, but the overall share climbing higher will depend on how fast rates and prices rise."

The huge jump in existing-home sales means more demand for new homes, as we said last week. The median price of new homes fell 1 percent to $282,800 compared with May 2014, also a good sign for the first-time homebuyers. But there are still not enough homes for sale. The supply of new homes was 4.5 months at May's sales pace, down from 4.6 months in April.

New Home Sales

Graph: Calculated Risk

This is also why housing starts came in at a 1.036 million rate in May. Though down 11.1 percent from the April rate, which was already one for the record books. But April is now revised higher to 1.165 million, a 22.1 percent gain from March. Sealing matters is another gigantic surge in permits, up 11.8 percent to 1.275 million following a 9.8 percent gain in April.

And this is buttressed by builder confidence in the market for newly built, single-family homes in June up five points to a level of 59, according to the National Association of Home Builders/Wells Fargo Housing Market Index (HMI). This is the highest reading since September 2014, and in fact returns the index to pre-bubble (2001-02) levels.

Why the huge construction increase in June? This is while mortgage rates are rising, up some 0.375 percent since their most recent lows to 3.875 percent for 0 points in origination fees for a 30-year fixed rate conforming loan.

Firstly, it means consumers are confident enough in their future to begin to look for housing to support their growing families.  And the millennial generation aged 18 to 36 years has already surpassed their parents’ baby boomer population size, and will exceed it by 2020, according to demographers. This has to be why household formation is finally returning to normal levels of 1 million plus new households being formed per year, as the so-called echo boomers move out of their parents’ homes and or leave college to make their own nests.

So forecasters will probably be revising their second-quarter GDP estimates higher following the better housing numbers, not to mention their estimates for Thursday's index of leading economic indicators where permits are one of the components, as we said last week.

Harlan Green © 2015

Follow Harlan Green on Twitter: https://twitter.com/HarlanGreen

Wednesday, June 17, 2015

Housing Construction Soars

The Mortgage Corner

Housing construction is taking off, as I predicted two weeks ago. The numbers show actual construction starts accelerating as well as building permits for future construction. It is also boosting builder confidence to a level that signals continued growth in new construction.

As Econoday reported, “Don't let the headline fool you (i.e., slight drop in June), the housing starts & permits report points to solid strength for the housing sector.” Though the Calculated Risk graph shows how far the housing market is from a true recovery. It is only now returning to the lows of the 1990 recession.

image

Graph: Calculated Risk

Housing starts came in at a 1.036 million rate in May, down 11.1 percent from the April rate but the April rate, which was already one for the record books, is now revised higher to 1.165 million, a 22.1 percent gain from March. Sealing matters is another gigantic surge in permits, up 11.8 percent to 1.275 million following a 9.8 percent gain in April.

And builder confidence in the market for newly built, single-family homes in June rose five points to a level of 59, according to the National Association of Home Builders/Wells Fargo Housing Market Index (HMI). This is the highest reading since September 2014, and in fact returns the index to pre-bubble (2001-02) levels.

image

Graph: Calculated Risk

“The HMI indices measuring current and future sales expectations are at their highest levels since the last quarter of 2005, indicating a growing optimism among builders that housing will continue to strengthen in the months ahead,” said NAHB Chief Economist David Crowe. “At the same time, builders remain sensitive to consumers’ ability to buy a new home.”

All three HMI components posted healthy gains in June. The component gauging current sales conditions jumped seven points to 65, the index charting sales expectations in the next six months increased six points to 69, and the component measuring buyer traffic rose five points to 44, said the press release.

Why the huge construction increase in June? This is while mortgage rates are rising, up some 0.375 percent since their most recent lows to 3.875 percent for 0 points in origination fees for a 30-year fixed rate conforming loan. Firstly, it means consumers are confident enough in their future to begin to look for housing to support their growing families.

And this is, of course, the millennial generation aged 18 to 36 years that has already surpassed their parents’ baby boomer population size, and will exceed it by 2020, according to demographers.

image

Graph: CNBC

Also, household formation is finally returning to normal levels of 1 million plus new households being formed per year, as the so-called echo boomers move out of their parents’ homes and or leave college to make their own nests.

Household formation has been unusually low over the past seven years, averaging 577,000 new households. Whereas, there are approximately 15 million new households per decade being formed during normal times.

So, "there's a ton of people living in basements," Tommy Lee of Fundstrat Global Advisors said in an interview with CNBC's "Trading Nation." "Two quarters of pretty decent household formation isn't getting everybody out of the basement. I think this means we have multiple years where household formations are well over 1.3 million, 1.4 million."

Forecasters will be revising their second-quarter GDP estimates higher following today's report, says Econoday, not to mention their estimates for Thursday's index of leading economic indicators where permits are one of the components.

Harlan Green © 2015

Follow Harlan Green on Twitter: https://twitter.com/HarlanGreen

Wednesday, February 18, 2015

Housing Starts, Builder Optimism Dips

The Mortgage Corner

Nationwide housing starts fell 2 percent to a seasonally adjusted annual rate of 1.065 million units in January, according to newly released data from the U.S. Commerce Department. This drop was mainly due to a 22.2 percent decrease in the Midwest, hit hard by winter weather.

And home builders’ sentiment also fell slightly from 57 to 55 percent, meaning a majority of those surveyed are optimistic that 2015 will be a good year for housing construction.

image

Graph: Calculated Risk

Single-family housing production fell 6.7 percent to a seasonally adjusted annual rate of 678,000 in January while multifamily starts rose 7.5 percent to 387,000 units. This is 2.0 percent below the revised December estimate of 1,087,000, but is 18.7 percent above the January 2014 rate of 897,000.

"After a strong single-family report in December, it is not surprising to see some pull back in January," said NAHB Chief Economist David Crowe. "With continued job creation and a growing economy, single-family production should make gains in the year ahead."

image

Graph: Calculated Risk

Though builder sentiment dipped, it was very good for a winter report.
“For the past eight months, confidence levels have held in the mid- to upper 50s range, which is consistent with a modest, ongoing recovery,” said NAHB Chief Economist David Crowe. “Solid job growth, affordable home prices and historically low mortgage rates should help unleash growing pent-up demand and keep the housing market moving forward in the year ahead.”

So what does this say about housing in 2015? The Fed’s FOMC minutes were just released, and it looks like they might not be ready to raise interest rates in the middle of 2015, as had been hinted by several of the Fed Governors.

“In connection with the risks associated with an early start to policy normalization, many participants observed that a premature increase in rates might damp the apparent solid recovery in real activity and labor market conditions, undermining progress toward the Committee's objectives of maximum employment and 2 percent inflation,” said the minutes. “In addition, an earlier tightening would increase the likelihood that the Committee might be forced by adverse economic outcomes to return the federal funds rate to its effective lower bound.”

Why is the Fed becoming more dovish viz interest rates? The Producer Price Index for wholesale prices is hovering perilously close to deflation. The PPI — a good proxy for wholesale costs — fell a record 0.8 percent in January on a seasonally adjusted basis, the Labor Department said today. It was the third decline in a row and the fifth in the past six months.

This is big news, folks, and could mean mortgage rates would remain low much longer than originally projected.

Harlan Green © 2015

Follow Harlan Green on Twitter: https://twitter.com/HarlanGreen

Wednesday, February 11, 2015

Mortgage Refinancings Surging in 2015

The Mortgage Corner

The still record-low interest rates are making a difference. Refinancings jumped 66 percent in January’s first two weeks, according to the MBA. And borrowers who refinanced during the fourth quarter of 2014 were able to reduce their interest rate, on average, by about 1.3 percentage points – a savings of about 23 percent, according to a recent Freddie Macs report. On a $200,000 loan that translates into saving of about $2,500 interest during the next 12 months.

image

Graph: Calculated Risk

Why? Conforming 30-yr fixed rates now are as low as 3.375 percent, and high-balance fixed rate conforming amounts can be found at 3.50 percent for 1 origination point.

"Our latest refinance report shows the refinance boom continued to wind down as the pool of potential borrowers declined over the course of 2014,” says Len Kiefer, Freddie Mac deputy chief economist. “However, because mortgage rates fell in the fourth quarter of last year, we actually saw the share of refinance originations tick up a bit despite volumes being down, a similar trend we expect to see for the first quarter of 2015 as mortgage rates have moved even lower.”

One popular program that in many cases doesn’t even require an appraisal for loan amounts up to 125 percent of value is the HARP II programs for conforming loans originated before June, 2009. Borrowers can reduce their interest rate to today’s market rates. But normal conforming qualification debt ratios and decent credit are required for HARP refinancings.

Home owners who refinanced through the government’s HARP program during the fourth quarter of 2014 saw an average reduction in their interest rate of 1.6 percentage points, according to Freddie Mac, amounting to an average savings of $3,300 in interest during the first 12 months – or about $275 in savings every month.

About 71 percent of those who refinanced their first-lien mortgage maintained about the same loan amount or lowered their principal balance by paying additional money at closing, according to the report.

But 34 percent of refinancers were able to shorten their loan terms, according to the report. This is when the conforming 15-yr fixed rate today is 2.50 percent. Overall, borrowers who refinanced in 2014 saved about $5 billion in interest over the next 12 months.

This has to spur home construction as well, since it enables the reduction of so much debt.

image

Graph: Calculated Risk

And sure enough, the U.S. Census Bureau of the Department of Commerce said that construction spending during October 2014 was estimated at a seasonally adjusted annual rate of $971.0 billion, 1.1 percent above the revised September estimate of $960.3 billion.

The latest NAR survey also showed more optimism for 2015 housing sales. An improving job market, low mortgage rates, and recent moves by the government to loosen up mortgage credit is fueling increased optimism among REALTORS®. In particular, real estate professionals are growing more confident about the housing market’s outlook for the next six months, according to the December 2014 REALTORS® Confidence Index, a survey of more than 4,000 Realtors.

So stay tuned, as winter wanes and interest rates stay low. Of course it will be up to the Federal Reserve as well, to maintain low interest rates for the rest of 2015.

Harlan Green © 2015

Follow Harlan Green on Twitter: https://twitter.com/HarlanGreen

Monday, December 1, 2014

GDP Growth Higher, Case-Shiller Prices Steady

The Mortgage Corner

The economy in the second and third quarters posted its best back-to-back growth in 11 years, And the Conference Board’s Index of Leading Economic Indicators showed strong growth over the next six months. offering fresh evidence that the U.S. will enter the new year with good momentum.

The government last Tuesday said gross domestic product rose at a 3.9 percent annual pace in the third quarter instead of 3.5 percent. Combined with a 4.6 percent gain in the second quarter, the U.S. has posted its best six-month stretch of growth since the middle of 2003.

image

Graph: Trading Economics

The Conference Board Leading Economic Index® (LEI) for the U.S. increased 0.9 percent in October to 105.2 (2004 = 100), following a 0.7 percent increase in September, and no change in August.

“The LEI rose sharply in October, with all components gaining over the previous six months,” said Ataman Ozyildirim, Economist at The Conference Board. “Despite a negative contribution from stock prices in October, and minimal contributions from new orders for consumer goods and average workweek in manufacturing, the LEI suggests the U.S. expansion continues to be strong.”

The largest of the 10 contributors were manufacturer’s new orders, up some 10 percent, and the 10-year Treasury bond rate dropping from 2.62 percent to 2.21 percent, boosting consumer spending and housing sales.

“The upward trend in the LEI points to continued economic growth through the holiday season and into early 2015,” said Ken Goldstein, Economist at The Conference Board. “This is consistent with our outlook for relatively good, but not great, consumer demand over the near term. Going forward, there are continued concerns about slow business investment and lackluster income growth.”


image

Graph: Econoday

S&P/Case-Shiller reported almost half of major cities tracked in Tuesday’s housing data saw prices fall in September, while almost half saw them rise,. Overall, the gauge of home prices in 20 cities was basically unchanged in September, ticking down .03 percent, a sign the summer sales market has ended.

Annnual growth cooled as well, with year-over-year home prices rising 4.9 percent in September — the slowest pace since October 2012 — compared with annual growth of 5.6 percent in August.

Here’s a chart summarizing the results:

image

The leaders were Charlotte, NC, and Miami, while the year-over-year leaders in price rises were again Miami, Las Vegas and San Francisco. With the Federal Housing Finance Authority loosening some conforming mortgage qualification standards, and if conforming interest rates remain below 4 percent, we could see overall housing prices stabilize and maybe even begin to rise again in 2015.

But it all depends on the jobs market, of course, and we see robust job growth continuing into the first half of 2015, as well, before the Fed begins to raise their short term interest rates.

Harlan Green © 2014

Follow Harlan Green on Twitter: https://twitter.com/HarlanGreen