Showing posts with label fixed rates. Show all posts

Tuesday, September 15, 2015

Construction, Retail Sales Higher

The Mortgage Corner

The strength of the economy right now is in the housing and construction sectors, again areas insulated from global factors, such as China’s slowdown. Construction spending, next to vehicle sales, is perhaps the week's best surprise, rising 0.7 percent for a second straight month, and 13.7 percent annually. Why? Rents are rising fast, which means many householders will start thinking about whether buying with today’s ultra-low mortgage rates as the better alternative.

image

Graph: Econoday

The Econoday graph shows the slope has steepened nicely in the spring and summer. The latest gain is centered in the most important component of all, single-family homes where construction spending rose 2.1 percent in the month for a year-on-year gain of 15.8 percent. Multi-family homes slowed in the month but the year-on-year rate, reflecting demand tied to high rents, is still outstanding at 21.2 percent.

image

Graph: Econoday

And auto sales are up a surprising 1.5 percent to a 17.8 million annual rate, with 14.1 million sales of domestic-made vehicles. The gain points to another strong month for retail sales in what would underscore the insulated strength of the domestic economy. It was outsized strength in the auto sector that supported the factory sector in June and July, though August's sales gain was centered in foreign-made vehicles. Still, sales of domestic-made cars and light trucks, which make up 80 percent of all sales, are at very strong levels.

In fact, retail sales just in this morning show a 2.2 percent annual gain, with strong sales in auto and food service. It could ave been above 3 percent if gas prices hadn’t fallen, but then would consumers be buying as much if gas prices were higher? This should mean Q3 GDP growth will again exceed 3 percent, following a revised Q2 reading of 3.7 percent by the BEA.

image

Graph: Calculated Risk

Will more renters be buying homes this year? The best way to compare rents to housing prices is the price-to-rent ratio. It is leveling off, which means rents are rising as fast as housing prices—some 5 percent of late. Combine that with conforming 30-year fixed mortgage rates of 3.75 percent, and we will have more renters looking to buy a home this year, at least. And the tax advantages of owning vs. renting really mean it’s more advantageous to buy over the longer term, rather than give the tax advantages to a landlord.

Harlan Green © 2015

Follow Harlan Green on Twitter: https://twitter.com/HarlanGreen

Wednesday, July 22, 2015

Existing-Home Sales at 8-Year High

The Mortgage Corner

It had to happen.  Why did June existing-home sales jump to an 8-year high? Fewer foreclosures is the short answer, hence more available for sale at market prices. But soaring consumer optimism due to an even better jobs market has to be the driving force causing families to build their nests.

Also, prices are rising to multi-year highs due to supply scarcities. And then there are the demographics, as the new generation is pushing older generations to move up or down, with even baby boomers wanting more retirement living.

Total existing-home sales, which are completed transactions that include single-family homes, townhomes, condominiums and co-ops, increased 3.2 percent to a seasonally adjusted annual rate of 5.49 million in June from a downwardly revised 5.32 million in May. Sales are now at their highest pace since February 2007 (5.79 million), have increased year-over-year for nine consecutive months and are 9.6 percent above a year ago (5.01 million).

image

Graph: Calculated Risk

Lawrence Yun, NAR chief economist, says backed by June's solid gain in closings, this year's spring buying season has been the strongest since the downturn. "Buyers have come back in force, leading to the strongest past two months in sales since early 2007," he said. "This wave of demand is being fueled by a year-plus of steady job growth and an improving economy that's giving more households the financial wherewithal and incentive to buy."

Inventories have dropped to 5 months, which is driving up prices. The median price, up 3.3 percent in the month to $236,400, is already a record. Part of the rise in prices is tied to a lack of distressed sales, at only 8 percent of June's total which is a record low, according to Econoday.

Adds Yun, "June sales were also likely propelled by the spring's initial phase of rising mortgage rates, which usually prods some prospective buyers to buy now rather than wait until later when borrowing costs could be higher."

And that may be an additional factor. Interest rates, though still low, have risen approximately ¼ percent since their most recent lows, with 30-year fixed conforming rates now 3.75 percent for a 1 point origination fee in California.

Total housing inventory3 at the end of June inched 0.9 percent to 2.30 million existing homes available for sale, and is 0.4 percent higher than a year ago (2.29 million). Unsold inventory is at a 5.0-month supply at the current sales pace, down from 5.1 months in May.

"Limited inventory amidst strong demand continues to push home prices higher, leading to declining affordability for prospective buyers," said Yun. "Local officials in recent years have rightly authorized permits for new apartment construction, but more needs to be done for condominiums and single-family homes."

The percent share of first-time buyers fell to 30 percent in June from 32 percent in May, but remained at or above 30 percent for the fourth consecutive month. A year ago, first-time buyers represented 28 percent of all buyers.

This is why housing starts surged nearly 10 percent last month to an annual rate of 1.17 million, just a touch below a post- recession high. Builders were especially active in the Northeast and South that suffered so much from last winter. We need more housing, in other words, as jobs and families continue to grow.

Harlan Green © 2015

Follow Harlan Green on Twitter: https://twitter.com/HarlanGreen

Tuesday, July 7, 2015

Pending Home Sales, Mortgage Applications Soar

The Mortgage Corner

Pending home sales continued to rise in May and are now at their highest level in over nine years, according to the National Association of Realtors. Gains in the Northeast and West were offset by small decreases in the Midwest and South. This is why we expect both existing and new-home sales to be the best since 2006 at the height of the housing bubble.

And mortgage activity is soaring, thanks to ultra-low interest rates, with total mortgage origination balances reaching $466 billion in the first quarter -- nearly a 75 percent increase from the same time a year ago, according to the Equifax National Consumer Credit Trends Report.

The Pending Home Sales Index, a forward-looking indicator based on contract signings, climbed 0.9 percent to 112.6 in May and is now 10.4 percent above May 2014. The index has now increased year-over-year for nine consecutive months and is at its highest level since April 2006.

image

Graph: Econoday

Pending sales were strongest in the West, up 2.2 percent in May for a 13.0 percent year-on-year gain. Pending sales in the South, up 10.6 percent year-on-year, have also been strong though the region though lower by 0.8 percent in the latest month. The Midwest was down 0.6 percent for a year-on-year plus 7.8 percent, but were up sharply in the Northeast where housing came back strongly from the severe winter, up 6.3 percent in this report for a year-on-year again of 10.6 percent.

NAR chief economist Lawrence Yun says contract activity rose again in May for the fifth straight month, increasing the likelihood that home sales are off to their best year since the downturn. "The steady pace of solid job creation seen now for over a year has given the housing market a boost this spring," said Yun. "It's very encouraging to now see a broad based recovery with all four major regions showing solid gains from a year ago and new home sales also coming alive."

Equifax said the bulk of mortgage growth has been to first mortgages, which zoomed nearly 80 percent compared to the first quarter of 2014 to $430 billion. The number of first mortgages originated in the first three months of the year was 1.78 million -- a 55 percent increase over the same time a year ago and 14 percent higher than in the fourth quarter of 2014. Originations of home equity lines of credit (HELOCs) rose 30 percent to $30.9 billion and new home equity installment loans climbed 13.6 percent to $5.0 billion.

  • Average first-lien mortgage loan amounts rose to $232,547 in March, an 11.5% increase over March 2014;
  • The number of first mortgages originated in the first three months of the year was 1.78 million, a 54.9% increase over the same time a year ago and 13.6% higher than in the fourth quarter of 2014;
  • The share of first mortgage accounts originated in the first quarter that went to consumers with an Equifax Risk Score below 620 (generally considered subprime) was 4.5%;
  • 3.1% of newly originated balances in the first quarter went to borrowers with subprime credit scores. For the same time a year ago, the share was 3.5%; and
  • The average loan amount for a first mortgage originated to a borrower with a subprime credit score in March 2015 was $152,260, up 9.9% from March 2014.

"The drop in mortgage rates that began in the fourth quarter of last year kicked off a refinance boomlet that accelerated in the first quarter, as rates fell further, averaging just 3.7 percent for the first three months of this year," said Amy Crews Cutts, Chief Economist at Equifax. "While rates have recently reversed that trend and are back up to about 4 percent, they remain extremely low historically. These rates, coupled with a housing market that is showing signs of vigor, should carry the mortgage business over the summer."

So we are seeing the housing sector back to normal growth. Existing-home sales also rose 5.1 percent in May to a 5.35 million annual rate. Home sales were plus 9.2 percent which, outside of the March 11.9 percent, is the strongest rate in nearly two years. And prices are rising, up 7.9 percent year-on-year at a median $228,700.

But, "Housing affordability remains a pressing issue with home-price growth increasing around four times the pace of wages," adds Yun. "Without meaningful gains in new and existing supply, there's no question the goalpost will move further away for many renters wanting to become homeowners."

Harlan Green © 2015

Follow Harlan Green on Twitter: https://twitter.com/HarlanGreen

Tuesday, June 23, 2015

Housing Beginning to Bloom

The Mortgage Corner

Ultra-low interest rates are finally beginning to pay off.  The housing season is beginning to bloom—for first-time homebuyers, in particular. The National Association of Realtors reports total existing-home sales, which are completed transactions that include single-family homes, townhomes, condominiums and co-ops, rose 5.1 percent to a seasonally adjusted annual rate of 5.35 million in May from an upwardly revised 5.09 million in April, largely because of the surge in first time buyers. Sales have now increased year-over-year for eight consecutive months and are 9.2 percent above a year ago (4.90 million).

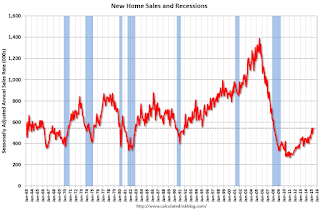
And new-home sales also soared. New single-family homes in the U.S. sold at an annual rate of 546,000 in May, hitting the fastest pace since February 2008, with growth in two of four regions, reports the U.S. Census Bureau this morning. And it revised April's rate to 534,000. May's sales rate was up 19.5 percent from a year earlier, signaling a healthy pick up, though recent sales rates remain below long-term averages.

image

Graph: Calculated Risk

This graph shows existing-home sales, on a Seasonally Adjusted Annual Rate (SAAR) basis since 1993. Sales in May (5.35 million SAAR) were 5.1 percent higher than last month, and were 9.2 percent above the May 2014 rate.

Lawrence Yun, NAR chief economist, says May home sales rebounded strongly following April's decline and are now at their highest pace since November 2009 (5.44 million). "Solid sales gains were seen throughout the country in May as more homeowners listed their home for sale and therefore provided greater choices for buyers," he said. "However, overall supply still remains tight, homes are selling fast and price growth in many markets continues to teeter at or near double-digit appreciation. Without solid gains in new home construction, prices will likely stay elevated — even with higher mortgage rates above 4 percent."

The percent share of first-time buyers rose to 32 percent in May, up from 30 percent in April and matching the highest share since September 2012. A year ago, first-time buyers represented 27 percent of all buyers.

"The return of first-time buyers in May is an encouraging sign and is the result of multiple factors, including strong job gains among young adults, less expensive mortgage insurance and lenders offering low down payment programs," said Yun. "More first-time buyers are expected to enter the market in coming months, but the overall share climbing higher will depend on how fast rates and prices rise."

The huge jump in existing-home sales means more demand for new homes, as we said last week. The median price of new homes fell 1 percent to $282,800 compared with May 2014, also a good sign for the first-time homebuyers. But there are still not enough homes for sale. The supply of new homes was 4.5 months at May's sales pace, down from 4.6 months in April.

New Home Sales

Graph: Calculated Risk

This is also why housing starts came in at a 1.036 million rate in May. Though down 11.1 percent from the April rate, which was already one for the record books. But April is now revised higher to 1.165 million, a 22.1 percent gain from March. Sealing matters is another gigantic surge in permits, up 11.8 percent to 1.275 million following a 9.8 percent gain in April.

And this is buttressed by builder confidence in the market for newly built, single-family homes in June up five points to a level of 59, according to the National Association of Home Builders/Wells Fargo Housing Market Index (HMI). This is the highest reading since September 2014, and in fact returns the index to pre-bubble (2001-02) levels.

Why the huge construction increase in June? This is while mortgage rates are rising, up some 0.375 percent since their most recent lows to 3.875 percent for 0 points in origination fees for a 30-year fixed rate conforming loan.

Firstly, it means consumers are confident enough in their future to begin to look for housing to support their growing families.  And the millennial generation aged 18 to 36 years has already surpassed their parents’ baby boomer population size, and will exceed it by 2020, according to demographers. This has to be why household formation is finally returning to normal levels of 1 million plus new households being formed per year, as the so-called echo boomers move out of their parents’ homes and or leave college to make their own nests.

So forecasters will probably be revising their second-quarter GDP estimates higher following the better housing numbers, not to mention their estimates for Thursday's index of leading economic indicators where permits are one of the components, as we said last week.

Harlan Green © 2015

Follow Harlan Green on Twitter: https://twitter.com/HarlanGreen

Saturday, April 25, 2015

March New-Home Sales A Dud

"Sales of new single-family houses in March 2015 were at a seasonally adjusted annual rate of 481,000, according to estimates released jointly today by the U.S. Census Bureau and the Department of Housing and Urban Development. This is 11.4 percent below the revised February rate of 543,000, but is 19.4 percent above the March 2014 estimate of 403,000."

image

Graph: Calculated Risk

The March result was a disappointment, mainly in the south, where sales fell 15.8 percent. And because builders continue to build—housing starts are close to the million unit mark again—housing inventories are rising and prices are falling. The supply of new homes rose to 5.3 months, while the median price fell to 1.5 percent to $277,400. Year-on-year, the median price to down 1.7 percent while sales are up 19.4 percent, a discrepancy that points to price discounting by builders, says Calculated Risk.

What is behind the up and down gyration in sales? Winter is still with us, for one thing. And many of the southern and Midwest states are being pounded by tornadoes, as well as torrential rains. Lower oil prices could also be hurting an area heavily dependent on the oil and gas industries.

We will know next week if job creation will resume from February’s low numbers, and so consumer confidence remains high. Mortgage activity is high, highest level in years, what with interest rates still at record lows. (The 10-year Treasury yield is back down to 1.91 percent, and Eurozone bonds now have negative interest rates, meaning banks have to pay their clients to borrow money, because there is so little demand for loans.)

Mortgage applications increased 2.3 percent from one week earlier, according to data from the Mortgage Bankers Association's (MBA) Weekly Mortgage Applications Survey for the week ending April 17, 2015.  The Market Composite Index, a measure of mortgage loan application volume, increased 2.3 percent on a seasonally adjusted basis from one week earlier.  The seasonally adjusted Purchase Index increased 5 percent from one week earlier to its highest level since June 2013.  The unadjusted Purchase Index increased 6 percent compared with the previous week and was 16 percent higher than the same week one year ago.

"Purchase applications increased for the fourth time in five weeks as we proceed further into the spring home buying season. Despite mortgage rates below four percent, refinance activity increased less than one percent from the previous week," said Mike Fratantoni, MBA's Chief Economist.  

The fact that purchase mortgage applications now comprise 44 percent of all applications, the highest in years, as we said, means the Fed’s policy of keeping interest rates as low as possible until household incomes begin to rise again is the right policy to kick start the housing market, and bring in those first time homebuyers who have been renting until know.

It also means some overbuilding of new homes is necessary to build up housing inventories for sale, and thus keep home prices in the affordable range.

Harlan Green © 2015

Follow Harlan Green on Twitter: https://twitter.com/HarlanGreen

Thursday, March 12, 2015

Will 2015 Interest Rates Remain This Low?

The Mortgage Corner

Record low interest rates are holding, in spite of the latest stock market selloffs, and may remain low throughout 2015. Why? Oil prices are still below $50/barrel, and overall prices are falling throughout the developed world. The Eurozone in particular has fallen into such deflationary times that some euro bonds have negative interest rates. That means holders of those bonds have to literally pay interest to hold them (i.e., government issued bonds), believe it or not.

image

Graph: Trading Economics

This is while the U.S. inflation rate has fallen to 1.3 percent, below the Fed’s 2 percent target that would mean prices are rising enough to sustain economic growth—in part because of those plunging oil prices. And because low oil prices will probably be sustained for at least 2 years, according to energy analysts, Janet Yellen’s Fed shouldn’t be tempted to raise their rates until later this year, if at all.

Oil prices are likely to stay at $60 a barrel or lower for the next two years as US shale extraction continues to suppress prices, according to the International Energy Agency’s latest report. After plunging from $115 a barrel in June to little more than $45 in January, the price of Brent crude has rallied recently, but the IEA said price pressures could have further to go.

“Despite expectations of tightening balances by end-2015, downward market pressures may not have run their course just yet,” the IEA, which advises mainly developed economies on the oil market, said in a monthly report.

There’s another reason for the Fed not to raise rates anytime soon, even though the so-called “confidence fairies” (P Krugman’s term) demand it; which are mainly deficit hawks that see inflation right around the corner, even when there’s none.

image

Graph: P Krugman

Because we are still not close to full employment, in spite of February’s 5.5 percent unemployment rate. Annual household median incomes after inflation have plunged 7.42 percent since the Great Recession, from $68,931 to $63,815. And history both here and in Europe has shown that tightening credit when household incomes haven’t recovered (either by raising interest rates, or otherwise restricting credit) can stop an economic recovery in its tracks.

That also means today’s long term mortgage rates, such as for the conforming 30-year fixed rate—should remain at or below 4 percent for the rest of 2015. Today, the 30-year conforming rate is 3.75 percent, still a very affordable mortgage.

Harlan Green © 2015

Follow Harlan Green on Twitter: https://twitter.com/HarlanGreen

Thursday, February 26, 2015

January Existing Home Sales, Mortgage Applications Dip

The Mortgage Corner

Oh, the winter freeze! It seems to put the housing market into a deep freeze, as well. Total existing-home sales, completed transactions that include single-family homes, townhomes, condominiums and co-ops, fell 4.9 percent to a seasonally adjusted annual rate of 4.82 million in January (lowest since last April at 4.75 million) from an upwardly-revised 5.07 million in December, said the NAR. Despite January’s decline, sales are higher by 3.2 percent than a year ago.

Lawrence Yun, NAR chief economist, says the housing market got off to a somewhat disappointing start to begin the year with January closings down throughout the country. “January housing data can be volatile because of seasonal influences, but low housing supply and the ongoing rise in home prices above the pace of inflation appeared to slow sales despite interest rates remaining near historic lows,” he said. “Realtors® are reporting that low rates are attracting potential buyers, but the lack of new and affordable listings is leading some to delay decisions.”

image

Graph: Calculated Risk

Better news was that the Chicago Fed National Activity Index (CFNAI) edged up to +0.13 in January from –0.07 in December, with industrial production up. Three of the four broad categories of indicators that make up the index increased from December, and only one of the four categories made a negative contribution to the index in January.

The index is a weighted average of 85 indicators of national economic activity drawn from four broad categories of data: 1) production and income; 2) employment, unemployment, and hours; 3) personal consumption and housing; and 4) sales, orders, and inventories.

Total existing-home inventory at the end of January increased 0.5 percent to 1.87 million existing homes available for sale, but is 0.5 percent lower than a year ago (1.88 million). Unsold inventory is at a 4.7-month supply at the current sales pace – up from 4.4 months in December. The median existing-home price for all housing types in January was $199,600, which is 6.2 percent above January 2014. This marks the 35th consecutive month of year-over-year price gains.

image

This follows the Conference Board’s LEI, which slowed to a not-so-strong plus 0.2 percent versus a slightly downward revised plus 0.4 percent in December. Once again the yield spread is the biggest positive for the index reflecting the Fed's near zero rate policy. Consumer expectations are the 2nd largest positive in the month, though one that may reverse in the next report given last week's plunge in the consumer sentiment index. Credit indications, which continue to be very positive in this report, are the 3rd largest positive.

Both indexes show increased employment in 2015, which should mean home sales will pick up with the selling season and better weather in the spring. “Although sales cooled in January, home prices continued solid year-over-year growth,” adds Yun. “The labor market and economy are markedly improved compared to a year ago, which supports stronger buyer demand. The big test for housing will be the impact on affordability once rates rise.”

Real estate is showing more signs of life, with the Case-Shiller Home Price Index rising again. Data released for December 2014 shows a slight uptick in home prices across the country. The S&P/Case-Shiller U.S. National Home Price Index, which covers all nine U.S. census divisions, recorded a 4.6 percent annual gain in December 2014 versus 4.7 percent in November.

image

Graph: Calculated Risk

Nine cities reported monthly increases in prices ... Both the 10-City and 20-City Composites saw year-over-year increases in December compared to November. The 10-City Composite gained 4.3 percent year-over-year, up from 4.2 percent in November. The 20-City Composite gained 4.5 percent year-over-year, compared to a 4.3 percent increase in November.

image

Graph: US Census Bureau

And lastly, January new-home sales were unchanged, but prices rose. Sales of new single-family houses in January 2015 were at a seasonally adjusted annual rate of 481,000, which is not enough product to keep prices in the affordable range. This is 0.2 percent below the revised December rate of 482,000, but is 5.3 percent above the January 2014 estimate of 457,000.

“In a promising sign, new home sales have been trending at post-recession highs for the past two months,” said NAHB Chief Economist David Crowe. “As the economy strengthens and mortgage rates remain low, we can expect continued upward movement in the housing market this year.”

So still record low interest rates (i.e., 3.50 percent conforming fixed rates) are keeping homebuyer and refinancers interested, but not enthusiastic.   And we believe mortgage rates will remain low, as evidenced by Fed Chairwoman Janet Yellen’s latest congressional testimony, which hinted that said rates could remain low for much of this year.

Harlan Green © 2015

Follow Harlan Green on Twitter: https://twitter.com/HarlanGreen

Thursday, February 5, 2015

Who Will Have Jobs This Year?

Popular Economic Weekly

Today’s ADP monthly private payroll report hints at what will happen with Friday’s ‘official’ nonfarm Labor Department unemployment report. ADP sees a slowing in job growth for January, to a lower-than-expected 213,000 for private payrolls and against ADP's upwardly revised 253,000 for December (initial estimate 241,000). Turning to government Labor Dept. data, the corresponding Econoday consensus for Friday's jobs report is 229,000 vs December's 240,000.

image

Graph: Econoday

Some drop in midwinter payrolls is expected, but where are the strengths and weaknesses? Companies in the U.S. service sector grew slightly faster in January, but they also cut back on the number of people they hired, according to survey of senior executives. A similar ISM gauge for manufacturing sector employment also declined in January, slipping to 54.1 percent from 56 percent.

The two ISM employment indexes are generally a good indicator of trends in the U.S. labor market. Even though both were positive in January, they point to somewhat slower job growth in the first month of 2015.

Among the goods-producing sector, there were 48,000 new construction jobs in December’s payroll report, with Health care and social assistance the second-highest job total. Construction payrolls are up 677,000 from their lows in 2010, but still 1.62 million below its 2006 high during the housing bubble.

So if interest rates remain at their record lows, real estate construction jobs may continue to expand.  Some 215,000 construction jobs were added in 2014, but total is still 1.6m below 2005 levels at height of the housing bubble. 

image

The apparent slowdown in hiring among service and manufacturing companies at the start of a new year could be a hint that the U.S. job creation in January will fall short of December’s 252,000 mark, as we said. The Institute for Supply Management said its nonmanufacturing index edged up to 56.7 percent in January from 56.5 percent in December. Readings over 50 percent signal that more businesses are expanding instead of contracting.

The good news is that new orders remained very healthy. The index measuring fresh demand rose to 59.5 percent and remained close to a post-recession high. On the downside, the employment gauge fell 4.1 points to 51.6 percent, marking the lowest level in 11 months. It was also the second worst reading in 20 months.

The 213,000 increase for January ADP payrolls is the lowest since September which was also 213,000. Increases in ADP's data from October to December averaged 257,000. By industries, ADP reports the largest percentage gain for January comes from construction, up 0.3 percent or 18,000 jobs (vs. 48,000 in BLS Dec. report), and the lowest from manufacturing, up 0.1 percent or 14,000 jobs, and financial activities, also up 0.1 percent or 10,000 jobs.

So continued health of the housing sector will be key to higher economic growth in 2015.

Harlan Green © 2015

Follow Harlan Green on Twitter: https://twitter.com/HarlanGreen

Tuesday, October 21, 2014

Existing-Home Sales Highest in Year

The Mortgage Corner

The National Association of Realtors reports total existing-home sales, which are completed transactions that include single-family homes, townhomes, condominiums and co-ops, increased 2.4 percent to a seasonally adjusted annual rate of 5.17 million in September from 5.05 million in August. Sales are now at their highest pace of 2014, but still remain 1.7 percent below the 5.26 million-unit level from last September.

image

Graph: Calculated Risk

That has to be partly due to falling interest rates, with conforming 30-year fixed rates dropping as low as 3.625 percent for a 1 point origination fee in California. But also rents are soaring, up more than 10 percent year-over-year in five large rental markets -- San Francisco, Sacramento, Oakland, Denver, and Miami.

Lawrence Yun, NAR chief economist, says the improved demand for buying seen since the spring has carried into the fall. “Low interest rates and price gains holding steady led to September’s healthy increase, even with investor activity remaining on par with last month’s marked decline,” he said. “Traditional buyers are entering a less competitive market with fewer investors searching for available homes, but may also face a slight decline in choices due to the fact that inventory generally falls heading into the winter.”

image

Graph: Calculated Risk

Total housing inventory at the end of September (blue line in graph) fell 1.3 percent to 2.30 million existing homes available for sale, which represents a 5.3-month supply (red line) at the current sales pace. This is far too few homes available for sale, which means a greater demand for new home construction. Despite fewer homes for sale in September, unsold inventory is still 6.0 percent higher than a year ago, when there were 2.17 million existing homes available for sale.

And housing prices continue to rise, though more slowly than last year. The median existing-home price for all housing types in September was $209,700, which is 5.6 percent above September 2013. This marks the 31st consecutive month of year-over-year price gains.

Why the falling interest rates? Worries of slower worldwide growth are worrying stock prices. The 10-year Treasury note yield dropped below 2 percent for the first time in 16 months. This has even caused Federal Reserve Vice Chairman Stanley Fischer to voice fears that the slowdown in the Eurozone in particular could slow U.S. growth. Why? Because it lowers the demand for U.S. goods and services.

Fischer said in a speech recently that, “if foreign growth is weaker than anticipated, the consequences for the U.S. economy could lead the Fed to remove accommodation more slowly than otherwise.”

Lawrence Yun added, “Economic instability overseas is leading to volatility in the stock market and is causing investors to seek safer bets, which will likely keep interest rates in upcoming weeks hovering near or below where they are now,” said  Yun. “This is welcoming news for consumers looking to buy, although they could temporarily become more cautious by less certain economic conditions.”

Of interest are all-cash sales, which tell us whether the mortgage markets are functioning better, or worse. Fewer all-cash sales generally mean banks are easing their credit standards. All-cash sales were 24 percent of transactions in September, said the NAR, up slightly from August (23 percent) but down from 33 percent in September of last year. Individual investors, who account for many cash sales, purchased 14 percent of homes in September, up from 12 percent last month but below September 2013 (19 percent). Sixty-three percent of investors paid cash in September. 

Distressed homes – foreclosures and short sales – increased slightly in September to 10 percent from 8 percent in August, but are down from 14 percent a year ago, another reason there are fewer all-cash purchases. Seven percent of September sales were foreclosures and 3 percent were short sales. Foreclosures sold for an average discount of 14 percent below market value in September (same as in August), while short sales were discounted 14 percent (10 percent in August). 

Harlan Green © 2014

Follow Harlan Green on Twitter: https://twitter.com/HarlanGreen

Tuesday, September 2, 2014

Pending Sales Up, Mortgage Delinquencies Down

The Mortgage Corner

U.S. home buyers signed more contracts to buy existing homes in July, rebounding from a drop in June. This is in line with declining delinquency and foreclosure rates that portend a healthy real estate market for the rest of this year, and maybe into next year, if interest rates hold at their current lows. Today’s 30-year fixed conforming rate has fallen to 3.75 percent for 1 origination point in California.

The National Association of Realtors' monthly Pending Home Sales index rose 3.3 percent in July over June but is still 2.1 percent below its level in July 2013. It’s rising again because both consumer confidence measures have been rising of late, buoyed by rising incomes and low inflation.

pending

Graph: Econoday

"Interest rates are lower than they were a year ago, price growth continues to moderate and total housing inventory is at its highest level since August 2012," said Lawrence Yun, NAR's chief economist. "The increase in the number of new and existing homes for sale is creating less competition and is giving prospective buyers more time to review their options before submitting an offer."

michigan

Graph: Calculated Risk

And consumer sentiment is up in the final August reading, to 82.5 vs 79.2 at mid-month, along with the Conference Board’s Confidence index, the second reading of consumer optimism that is rising this week. The gain is centered in current conditions as it was in Tuesday's consumer confidence report, and underscores the improvement this month in unemployment claims, which once again fell below 300,000 for the second consecutive week. The current conditions component in this report is at 99.8 vs 99.6 at mid-month and 97.4 in final July. A rise in current conditions points to general month-to-month strength for consumer activity.

foreclosures

Graph: Calculated Risk

Lastly, home prices continue to rise and delinquencies to fall. A total of ​​3,785,000 loans were delinquent or in foreclosure in July. This is down from 4,599,000 in July 2013. Calculated Risk reports Black Knight Financial Services (BKFS) released their Mortgage Monitor report for July today. According to BKFS, 5.64 percent of mortgages were delinquent in July, down from 5.70 percent in June. More importantly BKFS reports that 1.85 percent of mortgages were in the foreclosure process, down from 2.82 percent in July 2013.

Both delinquencies and foreclosures are finally approaching historical levels, which means that housing sales—including new-home sales will do the same. The rate of monthly new problem loans has now fallen to 2005-06 levels, reports BKFS. Many foreclosure sales were held up by lengthy court proceedings in many of the eastern and Midwestern state that did judicial sales, rather than the western states with Trust Deed liens that could be auctioned off on courthouse steps.

Harlan Green © 2014

Follow Harlan Green on Twitter: https://twitter.com/HarlanGreen

Wednesday, July 23, 2014

Existing-Home Sales On Rise Again

The Mortgage Corner

The NAR just reported total existing-home sales, which are completed transactions that include single-family homes, townhomes, condominiums and co-ops, climbed 2.6 percent to a seasonally adjusted annual rate of 5.04 million in June from an upwardly-revised 4.91 million in May. Sales are at the highest pace since October 2013 (5.13 million), but remain 2.3 percent below the 5.16 million-unit level a year ago, due partly to inventory shortage, and affordability problems.

sales

Graph: Calculated Risk

Total housing inventory at the end of June rose 2.2 percent to 2.30 million existing homes available for sale, which represents a 5.5-month supply at the current sales pace, unchanged from May. Unsold inventory is 6.5 percent higher than a year ago, when there were 2.16 million existing homes available for sale.

NAR chief economist Lawrence Yun says “Inventories are at their highest level in over a year and price gains have slowed to much more welcoming levels in many parts of the country. This bodes well for rising home sales in the upcoming months as consumers are provided with more choices,” he said. “On the contrary, new home construction needs to rise by at least 50 percent for a complete return to a balanced market because supply shortages – particularly in the West – are still putting upward pressure on prices.”

The most important statistic is the inventory of existing homes for sale, and other agencies show higher inventory levels. For instance, though the NAR reported that inventory was up 6.5 percent year-over-year in June, Housing Tracker shows inventory up 15 percent year-over-year in July, and Trulia chief economist Jed Kolko has seasonally adjusted the inventory, which is up some 10.9 percent, said Calculated Risk.

Yun also noted homebuyers are having affordability problems, in that stagnant wage growth is holding back what should be a stronger pace of sales. “Hiring has been a bright spot in the economy this year, adding an average of 230,000 jobs each month,” he said. “However, the lack of wage increases is leaving a large pool of potential homebuyers on the sidelines who otherwise would be taking advantage of low interest rates. Income growth below price appreciation will hurt affordability.”

Given the political realities at present, it looks like the only way to boost incomes—and housing sales—is to creep closer to full employment when employers will have to bid up wages. We know Fed Chairman Yellen is all for boosting employment, which is why she is resisting pressures to raise interest rates prematurely, when the real unemployment rate for the long term unemployed and part time workers is still 12.1 percent.

And that may not happen until mid-2015, at the earliest. So look for continued slow growth in housing sales (and lower interest rates) until next year, if Lawrence Yun and Janet Yellen are correct in their forecasts.

Harlan Green © 2014

Follow Harlan Green on Twitter: https://twitter.com/HarlanGreen

Friday, May 23, 2014

Where Is Housing Affordable Anymore?

Financial FAQs

How much salary do you need in order to afford the principal and interest payments on a median-priced home in your metro area? To find out, HSH.com, a mortgage data service, took the National Association of Realtors’ first-quarter data for median home prices and HSH.com’s first-quarter average interest rate for 30-year, fixed-rate mortgages to determine how much of your salary it would take to afford the base cost of owning a home--the principal, interest, taxes and insurance--in 27 metro areas.

hsh

Graph: HSH

The good news is that conforming 30-yr fixed rates are now down to 3.875 percent for a ½ origination point in California. The Hi-Balance conforming 30-yr fixed rate is now 4 percent with a ½ pt. origination fee.

Residents of the five cities that need the lowest annual salary to afford a median-priced home were: Cleveland ($29,788), Pittsburgh ($30,177), St. Louis ($31,275), Cincinnati ($31,850) and Detroit ($32,250). The five least-affordable cities were: Boston ($79,820) Los Angeles ($85,964) New York City ($89,788), San Diego ($98,534) and San Francisco ($137,129).

Unfortunately, HSH used very conservative debt-to-income (DTI) ratios to arrive at these numbers, making them seem more sensational that they really were. HSH used standard 28 percent "front-end" debt ratios, and a 20 percent down payment taken from the NAR’s median-home-price data to arrive at their figures, said the blog. But Fannie Mae allows up to 45 percent for all debt, and even 50 percent DTI, in some cases, so that homes even in the most expensive cities don’t require such high salaries.

A buyer can in fact own a home that is 160 percent higher than the median prices with the same income, or conversely, instead of the $137,150 annual salary, it can be as low as $103,000 per year with San Francisco’s $679,800 median price, if no other debt obligations.

This is while April total existing-home sales, which are completed transactions that include single-family homes, townhomes, condominiums and co-ops, rose 1.3 percent to a seasonally adjusted annual rate of 4.65 million in April from 4.59 million in March, but are 6.8 percent below the 4.99 million-unit level in April 2013.

inventory

Graph: Calculated Risk

Total housing inventory at the end of April jumped 16.8 percent to 2.29 million existing homes available for sale, which represents a 5.9-month supply at the current sales pace, up from 5.1 months in March. Unsold inventory is 6.5 percent higher than a year ago, when there was a 5.2-month supply, which is slowing those price increases.

Homes are still affordable, even in the highest-priced cities, in other words. But it’s no surprise those are the coastal cities that also have the most robust economies.

Harlan Green © 2014

Follow Harlan Green on Twitter: https://twitter.com/HarlanGreen

Sunday, March 16, 2014

Losing Fannie and Freddie—A Terrible Idea

Financial FAQs

There was a reason Fannie Mae (Federal National Mortgage Association) and Freddy Mac (Federal Home loan Mortgage Corporation) were government created entities, before they became private corporations in the 1970s.  They encouraged homeownership at a time when owning a home was only for the wealthiest.  Though Fannie Mae—the  Federal National Mortgage Association—was created in 1938 as part of the New Deal, it became important after WWII when the most basic 50 percent down payment on a 15-year fixed rate loan was available.  Payments were prohibitively expensive for those just entering the middle class.

Fannie Mae and Freddie Mac, Government-Sponsored Enterprises, or GSEs, filled the void with 30-year fixed rate mortgages, loans that private banks thought too risky.  Banks have always preferred short-term construction loans, or lines of credit that shortened their risk profiles.

And so the federal government created hybrid agencies that set up strict standards for so-called conventional, conforming mortgages.  These were mortgages that conformed to stricter underwriting standards set up by Fannie and Freddie.

And now some in Congress want to abolish them altogether, and replace them with what is basically a privately-funded secondary market mechanism for packaging and selling guaranteed mortgages with sky-high capital requirements that will raise interest rates, putting even more consumers out of the housing market.

Firstly, the only problem with the GSEs in their current form was that they were undercapitalized.  And because they were undercapitalized they suffered the same fate as all the undercapitalized major banks bailed out by TARP funds.  The only difference was that they were made wards of the government, which is what they were prior to the ‘70s, anyway.  And they are now pouring $billions back into the US Treasury, some $203 billion to date since the recovery, when they were lent $188 billion.

So there is no reason to dissolve them and every reason to keep them as viable GSEs.  This is mainly because their underwriting criteria have been the gold standard for borrower qualification, requiring income and asset verification, and assessing the likelihood this condition would continue, as we said.

That is why their default rates have about returned to historical levels, while so-called Private-Label mortgages—those originated by banks that don’t meet the stricter conforming standards—have default rates still in the 6 percent rage, 3 times the Fannie/Freddie rate.

The latest proposal, by committee chairmen, Tim Johnson, a Democrat from South Dakota, and Mike Crapo of Idaho, the ranking Republican, have come up with a compromise that provides an explicit government guarantee for mortgages, but only after private investors have taken the first losses. The plan would set up a new federal regulator, called the Federal Mortgage Insurance Corporation, to provide the guarantee and regulate the system.

Having private investors take first losses, in lieu of Fannie and Freddie’s current stockholders, is a terrible idea because banks are much more risk averse.  That’s why Fannie and Freddie currently originate some 60 percent of all residential mortgages since the end of the Great Recession.

clip_image001

Graph: WSJ/Inside Mortgage Finance

The new agreement would establish the Federal Mortgage Insurance Corporation as the insurer of last resort, but would require 10 percent private capital reserves, which is the rub. The guarantee, provided for a fee equivalent to 0.1 percent interest, would not kick in until the private reserves were wiped out. Fannie and Freddie would have remained solvent during the housing crisis if they had kept 4 percent of their capital in reserve.

The bill would create a single platform to standardize mortgage-backed securities, which are investment vehicles created by bundling mortgages and then selling off pieces of the bundle to spread the risk of default.

The bill would also set a minimum down payment of 5 percent, except for first-time home buyers, who would have to put down 3.5 percent for the mortgage to qualify for the guarantee. Some advocates have said they would prefer that the down payment amounts be left to the new regulator, who could adjust them in response to economic conditions.

The increased capital requirements and the government guarantee would raise the cost of borrowing for homeowners, said economist Mark Zandi, because the risks of the system would no longer be borne by all taxpayers. He estimated that interest rates would increase by 0.4 to 0.5 percentage points. 

This would put Fannie/Freddie fixed rate conforming mortgages at or above 5 percent at rates that prevailed on the runup to the housing bust, when households hadn’t lost so much income and accumulated record debts.  That is not the case today, for most Americans, needless to say.

The bill could therefore eliminate the affordable housing goals that governed Fannie and Freddie, which required them to make a certain number of loans to people with low incomes but which some advocates said were easily gamed and worked to discourage lending in particularly expensive markets.

John Taylor, president and chief executive of the National Community Reinvestment Coalition, said he had been assured that lenders would be encouraged to offer loans to low-income families through incentive pricing or would be required to do so by the regulator.

Really?  It depends on the types of “encouragement” given to banks.  They don’t have public service goals unless required to, such as the Community Reinvest Act, that combatted red-lining, because lenders tended to avoid lending in lower-income neighborhoods.  This is because they are required to maximize their profits, and affordable loans are by their nature very low profit margin entities.

So if not allowed to return as private corporations with stockholders bearing the risk, then at least keep them under some form of government control—there are many forms this can take, including strict regulations to protect their underwriting standards.  But there has to be enough capital, as is the lesson learned with commercial banks, as well.

Harlan Green © 2014

Follow Harlan Green on Twitter: https://twitter.com/HarlanGreen

Thursday, January 23, 2014

2013 Home Sales Highest Since 2006

The Mortgage Corner

The National Association of Realtors (NAR) just reported that for all of 2013, there were 5.09 million sales, which is 9.1 percent higher than 2012. It was the strongest performance since 2006 when sales reached an unsustainably high 6.48 million at the close of the housing boom, and is now back to the 2000 sales rate at the beginning of the housing bubble.

existsales

Graph: Calculated Risk

Lawrence Yun, NAR chief economist, said housing has experienced a healthy recovery over the past two years. “Existing-home sales have risen nearly 20 percent since 2011, with job growth, record low mortgage interest rates and a large pent-up demand driving the market,” he said. “We lost some momentum toward the end of 2013 from disappointing job growth and limited inventory, but we ended with a year that was close to normal given the size of our population.”

But for sale inventories have declined and are putting upward pressure home prices. The national median existing-home price for all of 2013 was $197,100, which is 11.5 percent above the 2012 median of $176,800, and was the strongest gain since 2005 when it rose 12.4 percent.

The is in large part because total housing inventory at the end of December fell 9.3 percent to 1.86 million existing homes available for sale, which represents a 4.6-month supply at the current sales pace, down from 5.1 months in November. Unsold inventory is 1.6 percent above a year ago, when there was a 4.5-month supply.

The median existing-home price for all housing types in December was $198,000, up 9.9 percent from December 2012. Distressed homes – foreclosures and short sales – accounted for 14 percent of December sales, unchanged from November; they were 24 percent in December 2012. The shrinking share of distressed sales accounts for some of the price growth.

Ten percent of December sales were foreclosures, and 4 percent were short sales. Foreclosures sold for an average discount of 18 percent below market value in December, while short sales were discounted 13 percent.

Interest rates will play a big part on home sales this year, needless to say, but will probably not rise much above current rates, even with higher economic growth. This is because of the tremendous cash hoard of businesses that obviates their need to borrow, as well as consumers that are borrowing much less than in the past. The 30-year conforming fixed rate is averaging 4.0 percent in California for a 0.5 point origination fee, and high-balance 30-year conforming is averaging 4.125 percent for a 1 point origination fee.

Harlan Green © 2013

Follow Harlan Green on Twitter: https://twitter.com/HarlanGreen

Wednesday, October 16, 2013

Government Shutdown Dims Builder Optimism

Financial FAQs

New-home construction is already a casualty of the government shutdown, and even sequestration agreement that has cut government hiring and spending more than $1.6 trillion to date. But its effect would be mitigated if interest rates remain low, and lenders continue to ease qualification criteria, such as lowering their super-high credit score requirement.

The National Association of Home Builders/Wells Fargo housing-market index fell to 55 in October from 57 in September. A prior September estimate pegged the level at 58, which matched the highest reading since 2005. Results above 50 signal that builders, generally, are optimistic about sales trends.

clip_image002[6]


“Interest rates remain near historic lows and we don’t expect the level of rates to have a major impact on sales and starts going forward,” said David Crowe, NAHB’s chief economist. “Once this government impasse is resolved, we expect builder and consumer optimism will bounce back.”

Despite the recent decline, pent-up demand is supporting builder sentiment, which has increased 34 percent over the past year, outpacing home-construction growth.

"A spike in mortgage interest rates along with the paralysis in Washington that led to the government shutdown and uncertainty regarding the nation's debt limit have caused builders and consumers to take pause," said NAHB Chief Economist David Crowe. "However, interest rates remain near historic lows and we don't expect the level of rates to have a major impact on sales and starts going forward. Once this government impasse is resolved, we expect builder and consumer optimism will bounce back."

Interest have declined slightly from their recent highs, so that the 30-year conforming fixed rate today is approximately 4.25 percent with 0 origination points in California.

There is some good news. The average credit score among borrowers who received a mortgage in September was 732, down from a peak of 750 a year prior, according to new data released today by Ellie Mae, which provides mortgage lenders with loan origination systems.  And this is a sign both that lenders loosening their heretofore strict qualification standards, and that more eligible homebuyers will be allowed in the market.

“The share of purchase loans continued to grow in September 2013, climbing 1 percent to 58 percent of all loans even in the face of higher interest rates and seasonality,” said Jonathan Corr, president and chief operating officer of Ellie Mae. “This was the eighth consecutive month that the purchase loan percentage has increased or stayed steady. In January 2013, purchases represented only 27 percent of closed loans.

“The credit standards also continued to ease in September with average FICO scores for closed loans dropping to 732 compared to 734 in August. September’s averages were 15 points below where they were at the beginning of the year (January 2013) and the lowest level since we began our tracking in August 2011,” noted Corr. “When you drill down farther, the change is even more apparent. For example, 31 percent of the closed loans in September 2013 had FICO scores under 700 compared to 17.4 percent of closed loans in September 2012.“

That’s also the lowest average credit score since the company started tracking this data in August 2011.

This is important because even a 680 FICO score is a sign of good credit record, though credit balances may be high. But the overall debt-to-income ratio is more important in determining borrowers’ ability-to-pay in this case.

Lenders pulled back on giving mortgages to borrowers with less-than-perfect credit in 2008 as the number of borrowers who foreclosed on their homes spiked. That’s left millions of would-be home buyers shut out of the housing market. The findings suggest that some borrowers who were unable to gain financing as recently as a year ago could get mortgage approval now.

To be sure, the bar to getting a mortgage remains high. Applicants who were denied a mortgage in September had an average FICO score of 696, according to Ellie Mae—a score that’s relatively stellar by most counts. FICO scores range from 300 to 850. Before the recession it was common for borrowers with credit scores in the 600 range and below to get mortgages.

Harlan Green © 2013

Follow Harlan Green on Twitter: www.twitter.com/HarlanGreen

Monday, October 14, 2013

So-called Qualified Mortgages Are a Problem

The Mortgage Corner

The new rules coming into effect in January 2013 for most conforming loans—i.e., those guaranteed by Fannie Mae and Freddie Mac will cause a definite drop in mortgage lending. The Consumer Protection Financial Bureau, created under Dodd-Frank has labeled such mortgages as Qualified Mortgages.

Financial institutions in the business of originating mortgages that they plan to resell on the secondary market to government-sponsored mortgage buyers Fannie Mae and Freddie Mac will have to raise their standards for approving loans. That is likely to have the biggest impact on working-class families, many of whom are struggling with consumer debt and are living paycheck to paycheck.

Two of the most important new rules created by the Consumer Financial Protection Bureau related to housing are the Ability-to-Repay rule and the 3 percent test rule.

The Ability-to-Repay rule, also known as the Qualified Mortgage rule, says borrowers' total debt liability -- including housing -- should not exceed 43 percent of income. A Qualified Mortgage is one that would be qualified for resale on the secondary mortgage market.

Yet borrowers with up to 50 percent total debt liability (DTI), excellent credit and savings that qualify today, would be excluded. And other rules, such as no interest only programs, no more than 30-year amortizations, lower debt-to-income qualification levels, and perhaps lower maximum loan to value amounts, will severely restrict homeownership.

So the regulations also could have the unintended effect of making it more difficult for many working-class families to qualify for mortgage loans offered by major banks, as an example. This is because higher income is required, hence such families will qualify for lower-priced homes.

The 3 percent test rule says 3 percent of the mortgage amount is the maximum amount of fees that banks can charge a borrower in order for the home loan to be classified as a Qualified Mortgage that can be resold in the secondary market.

"If you are a bank that pretty much originates and sells your mortgages, you are now playing under these rules," said Ernie Hogan, executive director of Pittsburgh Community Reinvestment Group. "If you are a bank that originates mortgages but keeps them and holds them for 30 years, you can vary from some of these rules."

Mr. Hogan believes this rule will make lower-priced homes more expensive for banks because they will not make as much money on that kind of business.

"It will hurt working-class families buying homes for $75,000 or less," he said. "Those loans will be classified as a high-cost loan. You are going to lose people in the mortgage industry looking at that segment. That's what we think will happen. Banks will make a better spread on higher-priced homes."

Don Frommeyer, president of the National Association of Mortgage Brokers, said the 3 percent rule also will be a problem for mortgage brokers. He said brokers will have a harder time collecting their fee on homes priced below $160,000 because every cost to the customer in the home buying process goes toward the 3 percent. For a mortgage of $100,000, for example, all origination fees -- including the mortgage broker fee -- would be limited to a total of $3,000.

This will also mean a step backward in the incipient housing recovery, as qualification standards were already tightened by the Federal Reserve last year for conventional loans guaranteed by Fannie and Freddie, in an attempt to lessen mortgage fraud and predatory lending practices.

But predatory lending wasn’t much of a problem before subprime loan programs were introduced in early 2000 that were basically liar loans, with little or no attempt to verify incomes and assets. Conversely, loans underwritten to Fannie Mae and Freddie Mac standards have never had this problem, with default rates not much higher than historical averages since the housing bubble.

So there is conjecture that a major reason for even more restrictive rules is an attempt to get Fannie and Freddie, now wards of the government, completely out of the mortgage purchase and guarantee business. But who then would be left, since they have been guaranteeing more than 90 percent of all mortgages originated since the end of the Great Recession. Need we say any more restrictions on them could step this real estate recovery in its tracks?

Harlan Green © 2013

Follow Harlan Green on Twitter: www.twitter.com/HarlanGreen

Thursday, September 26, 2013

Case-Shiller Home Prices Take Off

The Mortgage Corner

The July S&P Case-Shiller home price index shows home prices are in full recovery mode. Over the last 12 months, prices rose 12.3 percent and 12.4 percent as measured by the 10- and 20-City Composites in the major cities and metro areas, which are a 3-month average of same-home increases. And because the Fed still in full credit easing mode with its September decision to maintain QE3 securities’ purchases at $85 billion per month, interest rates are beginning to decline

clip_image002

Graph: Calculated Risk

Data through July 2013, released today by S&P Dow Jones Indices for its S&P/Case-Shiller Home Price Indices showed increases of 1.9 percent and 1.8 percent from June for the 10- and 20-City Composites. For at least four months in a row, all 20 cities showed monthly gains. Phoenix posted 22 consecutive months of positive returns. Although home prices in all the cities increased, 15 cities and both Composites those increases slowed in July versus June.

“Home prices gains are holding their 12 percent annual rate of gain established by the two Composite indices in April,” says Chairman David M. Blitzer, of the S&P Dow Jones Indices. “The Southwest continues to lead the housing recovery. Las Vegas home prices are up 27.5 percent year-over-year; in California, San Francisco, Los Angeles and San Diego are up 24.8, 20.8 and 20.4 percent, respectively. However, all remain far below their peak levels.”

The result of lower mortgage rates is mortgage applications are also increasing, after falling sharply in May when the Fed first hinted it would begin to tighten credit in the fall. Mortgage applications increased 5.5 percent from one week earlier, according to data from the Mortgage Bankers Association’s (MBA) Weekly Mortgage Applications Survey for the week ending September 20, 2013.

The Refinance Index increased 5 percent from the previous week. The seasonally adjusted Purchase Index increased 7 percent from one week earlier. The Purchase Index was at its highest level since July 2013.

clip_image004

Graph: Calculated Risk

The HARP share of refinance applications increased to 41 percent from 40 percent the week before, and is the highest since MBA started tracking this measure in early 2012. So there is the feeling that many home owners with negative home equity are only now taking advantage of refinancing their underwater mortgages at current interest rates. The HARP program allows mortgage holders to refinance when debt can be as much as 150 percent of their home’s value.
So the Federal Housing Finance Authority has stepped up its campaign to encourage more homebuyers to apply for HARP refinancing. Acting FHFA Director Edward J. DeMarco said that 2.8 million homeowners have refinanced through HARP but with mortgage rates still historically low and HARP eligibility requirements expanded, other qualified homeowners could reduce their monthly mortgage payments or build their equity faster with a shorter term mortgage through the program.

DeMarco told Bloomberg News in an interview this weekend that FHFA used focus groups to find out why borrowers with high rates hadn't yet tried to refinance through HARP. They found many didn't realize they were eligible. They thought they had to be delinquent on their mortgages before the government would help them. DeMarco said he hoped the educational outreach would bring in an additional 2 million HARP borrowers.

This is while total existing-home sales, which are completed transactions that include single-family homes, townhomes, condominiums and co-ops, rose to a seasonally adjusted annual rate of 5.48 million in August from 5.39 million in July, and are 13.2 percent higher than the 4.84 million-unit level in August 2012, reported the National Association of Realtors.

Harlan Green © 2013

Follow Harlan Green on Twitter: www.twitter.com/HarlanGreen

Thursday, September 19, 2013

Existing Home Sales Take Off

The Mortgage Corner

Existing-home sales have finally taken off, a sign that real estate might now be leading the economic recovery. Real estate has historically led past recoveries, by employing so many construction workers and professional services, but not this one to date due to the busted housing bubble.

Total existing-home sales, which are completed transactions that include single-family homes, townhomes, condominiums and co-ops, rose 1.7 percent to a seasonally adjusted annual rate of 5.48 million in August from 5.39 million in July, and are 13.2 percent higher than the 4.84 million-unit level in August 2012, reports the National Association of Realtors.

image

Graph: Calculated Risk

And total housing inventory at the end of August increased 0.4 percent to 2.25 million existing homes available for sale, which represents a 4.9-month supply at the current sales pace, down from a 5.0-month supply in July. So the very low inventory is causing housing prices to soar, which will ultimately cure much of the negative home equity still existing. Unsold inventory is 6.3 percent below a year ago, when there was a 6.0-month supply.

Lawrence Yun, NAR chief economist, said the market may be experiencing a temporary peak.  “Rising mortgage interest rates pushed more buyers to close deals, but monthly sales are likely to be uneven in the months ahead from several market frictions,” he said.  “Tight inventory is limiting choices in many areas, higher mortgage interest rates mean affordability isn’t as favorable as it was, and restrictive mortgage lending standards are keeping some otherwise qualified buyers from completing a purchase.”

But that may not be so with the Federal Reserve’s decision to put off tapering QE3 purchases. Conforming 30-year fixed mortgage interest rates plunged one-quarter percent on Wednesday to 4.25 percent for zero points origination fee in California, when the Fed announced its decision to continue the $85 billion in purchases.

The national median existing-home price for all housing types was $212,100 in August, up 14.7 percent from August 2012.  This is the strongest year-over-year price gain since October 2005 when the median rose 16.6 percent, and marks 18 consecutive months of year-over-year price increases, said the NAR.

Even more importantly, distressed homes – foreclosures and short sales – accounted for 12 percent of August sales, down from 15 percent in July, and is the lowest share since monthly tracking began in October 2008. They were 23 percent in August 2012.  Ongoing declines in the share of distressed sales are responsible for some of the growth in median price.

Granted much of the boost in home sales and rising interest rates comes from the fear that QE3 would end. But with interest rates again falling, both home purchases and mortgage refinancing will be boosted. So it looks like the Fed is maintaining it commitment to reviving the housing market, as well as economic growth in general.

Harlan Green © 2013

Follow Harlan Green on Twitter: www.twitter.com/HarlanGreen

Thursday, August 22, 2013

Our Poor Inflation Record

Popular Economics Weekly

Inflation has fallen so low that it threatens this economic recovery. Why? Producers can’t charge more for their products, therefore can’t increase profits unless they use fewer workers and greater automation to replace them.  So there is no incentive to hire more workers, which would increase the demand for their products, and so increase economic growth.

The median household income declined some 10 percent from 2000, after inflation because of less need for highly skilled workers.  And the unemployment rate is still above 7 percent, some 4 years after the end of the Great Recession.

clip_image001

Chart: Trading Economics

That’s because with automation and the Global Information Age, things can be produced more cheaply anywhere in the world where things are cheapest to produce, which puts pressure on workers’ incomes everywhere.  So we know there can’t be as much inflation with unemployment remaining so high. 

In fact, it is remarkable how closely disinflation (falling inflation) has tracked historical unemployment rates in these charts that begin in 1948, the beginning of the modern consumer economy.  For instance, inflation began its steep decline after 1980 when Fed Chairman Volcker pushed interest rates as high as 16 percent, causing the 1981 and 1983 recessions, and a jobless rate of more than 10 percent. The result of the Great Recession has been the same—high joblessness with too low inflation.

clip_image002

Chart:  Financial Times

            So Fed Chairman Bernanke basically inherited an almost deflationary economic environment in 2006, with the Great Recession that began December 2007 and ended June 2009.  That is why the Fed has been keeping interest rates so low, and why the Fed Governors aren’t yet ready to end the QE3 purchase of securities.  Without QE3, we could be in deep trouble with real estate still in the doldrums.

clip_image003

Chart: Calculated Risk

            The good news is that July existing-home sales rose to the highest level in 4 years, since the end of the Great Recession.  The consensus is that most of these homes were put into contract before the recent rise in interest rates, and that the current rise in mortgage rates since then will slow down sales.

            Total existing-home sales, which are completed transactions that include single-family homes, townhomes, condominiums and co-ops, increased 6.5 percent to a seasonally adjusted annual rate of 5.39 million in July from a downwardly revised 5.06 million in June, and are 17.2 percent above the 4.60 million-unit pace in July 2012, said the National Association of Realtors. 

But with just a 5.1-month supply, inventory levels are historically low during this sales season.  That means values haven’t raised enough to allow more homes with positive equity on the market that would create a sustained recovery.  With such a low inventory level there is no danger of either a new housing bubble (meaning too many homes for sale), or inflationary pressures.

Harlan Green © 2013

Follow Harlan Green on Twitter: www.twitter.com/HarlanGreen