Tuesday, June 30, 2015

It’s Time For the 30-hour Week

Popular Economics Weekly

Don’t look now, but we should soon have the 30-hour work week as the standard, instead of the 40-hour work week last enshrined during FDR’s New Deal. Why, when Americans now work more hours than any other developed country?

There are a number of good reasons, and they have little to do with the ACA, or Obamacare, which has decreed that 30 hours per week is considered to be full time employment for large businesses that are required to offer insurance coverage to their employees.

But it has a lot to do with the labor slack in our job market that Fed Chair Yellen has been talking so much about, and the declining health and welfare of American workers. Thanks to the tech revolution and huge productivity gains of those past 30 years, fewer workers are needed to do the same amount of work in the digital world. So if fewer workers are needed to do the same work, then why are more employees working overtime?

Maybe because no one in America has thought through the consequences. What would it mean to share the workload with more people? The Germans certainly have done something about it. Rather than fire employees when times were tough in Germany’s last recession, firms hit hardest by the reduction in demand reduced their employees’ working hours to spread the pain.

And, the four-day workweek is nearly standard in the Netherlands, especially among working moms, according to a CNN Money article. Overall, the entire workforce averages around 29 hours a week -- the lowest of any industrialized nation, according to the OECD.

Some 86 percent of employed mothers worked 34 hours or less each week last year, according to Dutch government statistics, as reported by CNN. Among fathers, about 12 percent also worked a shortened workweek. Denmark is close behind with a 33 hour average work week and five weeks of paid vacation.

“Dutch laws promote a work-life balance and protect part-time workers,” said the report. All workers there are entitled to fully paid vacation days, maternity and paternity leave. A law passed in 2000 also gives workers the right to reduce their hours to a part-time schedule, while keeping their job, hourly pay, health care and pro-rated benefits.

Whereas in a U.S., a Gallup survey last summer found that the average for full-time employees was actually 47 hours—or 46 if you isolate those workers with just one job. Either way, that's almost the equivalent of an extra business day on top of the usual five-day workweek. And it’s affecting our health and longevity.

Of the more than 1,200 adults surveyed by Gallup, 21 percent said they worked 50 to 59 hours while 18 percent said they worked 60 or more. Another 11 percent estimated 41 to 49 hours. It is an insanity that American workers have become such workaholics at the expense of their health, their families, and their own sanity.

The Centers for Disease Control and Prevention cites studies that found "a pattern of deteriorating performance on psycho physiological tests as well as injuries while working long hours."

It also cited four studies that found "that the 9th to 12th hours of work were associated with feelings of decreased alertness and increased fatigue, lower cognitive function, [and] declines in vigilance on task measures."

Wouldn’t this be the least painless way for workers to catch up to the incomes of their bosses that now earn on average 303 times their average employees’ income, according to a recent EPI study? Where have most of the productivity profits since the late 1970s gone, as illustrated by the BLS graph? To those executives and their stockholders, as this graph illustrates.

image

It’s no longer a secret that America is the most over-worked country in the developed world, according to the Center For American Progress, a progressive think tank. It is the only developed country with no mandated vacation, sick leave or parental work leave allowances, which even many third world countries like Afghanistan and Ethiopia have.

In fact, it is already beginning to happen among high tech firms that allow flex hours and even work at home. A 4-day -- or compressed -- workweek is offered as an option to at least some employees at 43 percent of companies, according to the Society for Human Resource Management. But only 10 percent of those companies make it available to all or most of their employees.

And there are roughly two dozen local union contracts that include a compressed workweek option for public-service employees working in municipalities, universities and institutions such as prisons, according to the American Federation of State, County and Municipal Employees.

So there is no good reason America, the richest country in the world, should remain an underdeveloped, overworked country anymore.

Harlan Green © 2015

Follow Harlan Green on Twitter: https://twitter.com/HarlanGreen

Monday, June 29, 2015

Consumers Earn and Spend More This Year

Financial FAQs

The consumer came to life in May, boosted by a 0.5 percent rise in personal income and helping to support a 0.9 percent surge in personal outlays that reflects heavy spending on autos and retail goods. The spending surge will also boost housing, already showing much better numbers, and the rest of the economy this year.

This is while the gains are not inflationary, at least yet, based on the very closely watched core Personal Consumption Expenditure (PCE) price index which edged only 0.1 tenth higher in May and is at a very benign 1.2 percent year-on-year rate which is actually down a tenth from an upward revised April.

Also, consumer optimism is absolutely as strong as it gets well beyond forecasts to 96.1, according to the University of Michigan consumer sentiment index. The expectations component, reflecting strong optimism for the jobs market, is an absolute standout, at 97.8 for a 12-year high and an 11.0 point surge from mid-month and a 13.6 point surge from final May, said Econoday. The survey is now back to early 2000 levels in this graph that dates back to 1978 and five recessions.

image

Graph: Calculated Risk

And such increased household incomes and employment have boosted housing construction and permits, which in turn boosts lots of ancillary sectors, such as Professional Services, Insurance, and Banking. Housing starts came in at a 1.036 million rate in May which is down 11.1 percent from the April rate, as we reported – but the April rate, which was already one for the record books, was revised even  higher to 1.165 million for, and this is no misprint, a 22.1 percent gain from March.

image

Graph: Econoday

Increased consumer optimism has to be why we see the gigantic surge in permits, up 11.8 percent to 1.275 million following a 9.8 percent gain in April, which means future construction growth. Permits are the leading indicator in the report and the latest permit rate is the best since way back in August 2007. Based if nothing else than on permits, the housing sector, following the heavy weather of the first quarter, is moving to the top of the economy.

For home buying, the 30 to 39 age group (blue line) is important in this Calculated Risk graph.  The population in this age group is increasing, and will increase significantly over the next 10 plus years.   From roughly 2020 this predominately home buying age group will outnumber all the other age groups in this graph that projects out to 2060.

image

Graph: Calculated Risk

This increase in the demand for goods and services, including housing, is in fact because of the millennial generation, as I’ve said in past columns. Its numbers have now surpassed their parents’ baby boomer generation, and will continue to expand as more become adults, enter the workforce, and raise families.

Harlan Green © 2015

Follow Harlan Green on Twitter: https://twitter.com/HarlanGreen

Wednesday, June 24, 2015

Why Lower Growth, but Higher Corporate Profits?

Popular Economics Weekly

First-quarter economic growth wasn’t as bad as expected, yet corporate profits were much better than expected. So what are corporations doing with their profits, rather than investing in future growth?

The second revision to first-quarter GDP came in at minus 0.2 percent. Exports were near the top of the negative side, reflecting the strong dollar's negative effect on foreign demand. A rise in imports was the quarter's biggest negative, and consumer spending on services the biggest positive. Personal Consumption (PCE) grew 2.1 percent annually, reflecting happier consumers, and residential investment surged to 6.5 percent, as growing new and existing-home sales show the housing market in recovery.

image

Graph: Econoday

This is while corporate profits continued their record ways, up 9 percent annually. So where are the profits going, with most Fortune 500 corporations paying much less than the nominal fed tax rate of 35 percent? Analyst estimates show total S&P 500 capex (i.e., capital expenditure) spending could dip 11 percent to $641.6 billion in 2015 from actual 2014 spending of $718.1 billion, marking the lowest level since 2011's $591.5 billion, according to Thomson Reuters data.

image

Graph: Econoday

“U.S. corporate spending on capital projects could fall this year to the lowest level since 2011, with steep reductions by the energy industry and companies in other sectors cutting spending amid broad concerns about global growth,” said the Thomson Reuters report. That could translate to lower job growth and weakness in the technology and industrial companies that typically benefit from capital spending.

So then what do corporations do with their excess cash? S&P 500 companies still have record levels of cash on their balance sheets—somewhere between $3.5 to $5 trillion from 2012 to 2014, according to the St. Louis Fed—as spending on stock buybacks and dividend payments has come at the expense of capex for many companies.

image

Graph: St. Louis Fed

In fact, this has been to the detriment of both profits and growth of those companies that have hoarded their cash reserves, according to a Deloitte LLP report, The Cash Paradox: How Record Cash Reserves Are Influencing Corporate Behavior . “Critically, a divergence in share price between the cash hoarders and the spenders has emerged,” says Iain Macmillan, partner and head of M&A and New Growth for Deloitte LLP in the U.K.

“Since 2000, the share price performance of the small cash holding companies has outperformed their large cash holding counterparts, growing by an astonishing 632 percent compared to 327 percent for their larger cash holding counterparts. Remarkably, the gap widened even more after the financial downturn. This suggests that in the long run, the markets are rewarding companies that take a more bullish attitude toward growth.”

image

Graph: Deloitte LLP

That should be a no-brainer for corporate heads (large corporation growth is red line on graph). So it seems that cash buybacks and dividend payments are not the way to spend profits to increase market share and overall growth. Corporate CEOs now make on average 300 times their employees’ average income, much of it in stock options that tend to increase in value with stock buybacks and increased dividends.

It is no longer a secret that CEO compensation has reached stratospheric levels. The AFl-CIO Union website catalogues those compensation levels—with the majority from stock holdings, rather than outright salaries. JP Morgan Chase CEO Jamie Dimon earned a $1.5 million salary in 2014, but more than $20 million in stock compensation, for example.

The Economic Policy Institute revealed Monday that the average total compensation of CEOs at the 350 largest firms was $16.3 million in 2014, roughly 303 times the average pay of their workers, reports CNN. The divide between CEO and worker pay has increased every year since 2009, when CEO salaries dropped to 196 times the average work, according to the report. While CEO pay has risen 997 percent since 1978, the average employee pay has grown 10.9 percent.

So why not raise their employees’ wages and benefits with some of the cash hoard—for instance, retirement and healthcare benefits? Then, instead of enriching themselves, those CEOs would see an increase in demand for their products and services.

This is standard aggregate demand theory, and once again obvious to those concerned with our poor economic growth record, economic growth that has been steadily declining since 1980. Consumers make up some 70 percent of economic activity these days, ergo if corporate CEOs paid their employees more, consumers wouild spend more, thereby further enhancing corporate balance sheets, needless to say!

Harlan Green © 2015

Follow Harlan Green on Twitter: https://twitter.com/HarlanGreen

Tuesday, June 23, 2015

Housing Beginning to Bloom

The Mortgage Corner

Ultra-low interest rates are finally beginning to pay off.  The housing season is beginning to bloom—for first-time homebuyers, in particular. The National Association of Realtors reports total existing-home sales, which are completed transactions that include single-family homes, townhomes, condominiums and co-ops, rose 5.1 percent to a seasonally adjusted annual rate of 5.35 million in May from an upwardly revised 5.09 million in April, largely because of the surge in first time buyers. Sales have now increased year-over-year for eight consecutive months and are 9.2 percent above a year ago (4.90 million).

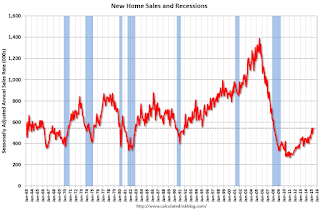
And new-home sales also soared. New single-family homes in the U.S. sold at an annual rate of 546,000 in May, hitting the fastest pace since February 2008, with growth in two of four regions, reports the U.S. Census Bureau this morning. And it revised April's rate to 534,000. May's sales rate was up 19.5 percent from a year earlier, signaling a healthy pick up, though recent sales rates remain below long-term averages.

image

Graph: Calculated Risk

This graph shows existing-home sales, on a Seasonally Adjusted Annual Rate (SAAR) basis since 1993. Sales in May (5.35 million SAAR) were 5.1 percent higher than last month, and were 9.2 percent above the May 2014 rate.

Lawrence Yun, NAR chief economist, says May home sales rebounded strongly following April's decline and are now at their highest pace since November 2009 (5.44 million). "Solid sales gains were seen throughout the country in May as more homeowners listed their home for sale and therefore provided greater choices for buyers," he said. "However, overall supply still remains tight, homes are selling fast and price growth in many markets continues to teeter at or near double-digit appreciation. Without solid gains in new home construction, prices will likely stay elevated — even with higher mortgage rates above 4 percent."

The percent share of first-time buyers rose to 32 percent in May, up from 30 percent in April and matching the highest share since September 2012. A year ago, first-time buyers represented 27 percent of all buyers.

"The return of first-time buyers in May is an encouraging sign and is the result of multiple factors, including strong job gains among young adults, less expensive mortgage insurance and lenders offering low down payment programs," said Yun. "More first-time buyers are expected to enter the market in coming months, but the overall share climbing higher will depend on how fast rates and prices rise."

The huge jump in existing-home sales means more demand for new homes, as we said last week. The median price of new homes fell 1 percent to $282,800 compared with May 2014, also a good sign for the first-time homebuyers. But there are still not enough homes for sale. The supply of new homes was 4.5 months at May's sales pace, down from 4.6 months in April.

New Home Sales

Graph: Calculated Risk

This is also why housing starts came in at a 1.036 million rate in May. Though down 11.1 percent from the April rate, which was already one for the record books. But April is now revised higher to 1.165 million, a 22.1 percent gain from March. Sealing matters is another gigantic surge in permits, up 11.8 percent to 1.275 million following a 9.8 percent gain in April.

And this is buttressed by builder confidence in the market for newly built, single-family homes in June up five points to a level of 59, according to the National Association of Home Builders/Wells Fargo Housing Market Index (HMI). This is the highest reading since September 2014, and in fact returns the index to pre-bubble (2001-02) levels.

Why the huge construction increase in June? This is while mortgage rates are rising, up some 0.375 percent since their most recent lows to 3.875 percent for 0 points in origination fees for a 30-year fixed rate conforming loan.

Firstly, it means consumers are confident enough in their future to begin to look for housing to support their growing families.  And the millennial generation aged 18 to 36 years has already surpassed their parents’ baby boomer population size, and will exceed it by 2020, according to demographers. This has to be why household formation is finally returning to normal levels of 1 million plus new households being formed per year, as the so-called echo boomers move out of their parents’ homes and or leave college to make their own nests.

So forecasters will probably be revising their second-quarter GDP estimates higher following the better housing numbers, not to mention their estimates for Thursday's index of leading economic indicators where permits are one of the components, as we said last week.

Harlan Green © 2015

Follow Harlan Green on Twitter: https://twitter.com/HarlanGreen

Thursday, June 18, 2015

Janet Yellen and Interest Rate Futures

Financial FAQs

The consensus of economists from Fed Chairperson Janet Yellen’s press conference was that the Fed is in no hurry to raise interest rates. Why should they with employment growing, but not wages? Because workers aren’t getting their fair share of the economic pie (i.e., of increases in productivity and profits), and future economic growth still looks dicey.

“I did say when we agreed that labor markets slack has diminished to some extent, in the inter-meeting period and clearly over a longer span of time over the last several years, obviously we have made considerable progress in moving towards our goal of maximum employment,” said Dr. Yellen. “So in spite of the fact that there is some progress on that front the committee wants to see some further progress before feeling that it will be appropriate to raise rates.”

For starters, economic growth is still not sufficient to boost salaries. First quarter U.S. GDP growth was negative -0.7 percent, though it may eventually be revised upward with more data. This is while wage growth in the first quarter was just 2.3 percent, when it is above 3 percent with normal full employment.

image

Graph: Trading Economics

And there is very little if any inflation because of low wage growth, which takes up two-thirds of product costs. The Consumer Price Index has had zero growth over the past year—yes zero retail inflation, as the Econoday graph makes abundantly clear.

image

Graph: Econoday

So what is Janet Yellen’s Federal Reserve to do in such a case? It has to continue to wait for a number of economic factors and trends to develop. For instance, Europe is teetering on the edge of its third recession since 2009, and Greece about to exit the Eurozone. The ensuing economic uncertainty can only hurt exports, since Europe accounts for 25 percent of U.S. exports, and our strong dollar is making U.S. exports less competitive everywhere (though it has meant cheaper oil and gas prices, and a lower trade deficit).

image

Graph: Trading Economics

Europe is definitely hurting, in other words. “The Gross Domestic Product (GDP) In the Euro Area expanded 0.40 percent in the first quarter of 2015 over the previous quarter,” says Trading Economics. GDP Growth Rate in the Euro Area averaged 0.36 percent from 1995 until 2015, reaching an all-time high of 1.30 percent in the second quarter of 1997 and a record low of -2.90 percent in the first quarter of 2009.

“We can only do what is in our power to attempt to minimize needless volatility that could have repercussions for other countries or financial stability more generally and that is to attempt to communicate as clearly as we can about our policy decisions, what they will depend on and what we are looking at,” said Yellen.

She couldn’t be clearer on the need to pay attention to what is happening in the rest of the world as well as with US, in other words.

Harlan Green © 2015

Follow Harlan Green on Twitter: https://twitter.com/HarlanGreen

Wednesday, June 17, 2015

Housing Construction Soars

The Mortgage Corner

Housing construction is taking off, as I predicted two weeks ago. The numbers show actual construction starts accelerating as well as building permits for future construction. It is also boosting builder confidence to a level that signals continued growth in new construction.

As Econoday reported, “Don't let the headline fool you (i.e., slight drop in June), the housing starts & permits report points to solid strength for the housing sector.” Though the Calculated Risk graph shows how far the housing market is from a true recovery. It is only now returning to the lows of the 1990 recession.

image

Graph: Calculated Risk

Housing starts came in at a 1.036 million rate in May, down 11.1 percent from the April rate but the April rate, which was already one for the record books, is now revised higher to 1.165 million, a 22.1 percent gain from March. Sealing matters is another gigantic surge in permits, up 11.8 percent to 1.275 million following a 9.8 percent gain in April.

And builder confidence in the market for newly built, single-family homes in June rose five points to a level of 59, according to the National Association of Home Builders/Wells Fargo Housing Market Index (HMI). This is the highest reading since September 2014, and in fact returns the index to pre-bubble (2001-02) levels.

image

Graph: Calculated Risk

“The HMI indices measuring current and future sales expectations are at their highest levels since the last quarter of 2005, indicating a growing optimism among builders that housing will continue to strengthen in the months ahead,” said NAHB Chief Economist David Crowe. “At the same time, builders remain sensitive to consumers’ ability to buy a new home.”

All three HMI components posted healthy gains in June. The component gauging current sales conditions jumped seven points to 65, the index charting sales expectations in the next six months increased six points to 69, and the component measuring buyer traffic rose five points to 44, said the press release.

Why the huge construction increase in June? This is while mortgage rates are rising, up some 0.375 percent since their most recent lows to 3.875 percent for 0 points in origination fees for a 30-year fixed rate conforming loan. Firstly, it means consumers are confident enough in their future to begin to look for housing to support their growing families.

And this is, of course, the millennial generation aged 18 to 36 years that has already surpassed their parents’ baby boomer population size, and will exceed it by 2020, according to demographers.

image

Graph: CNBC

Also, household formation is finally returning to normal levels of 1 million plus new households being formed per year, as the so-called echo boomers move out of their parents’ homes and or leave college to make their own nests.

Household formation has been unusually low over the past seven years, averaging 577,000 new households. Whereas, there are approximately 15 million new households per decade being formed during normal times.

So, "there's a ton of people living in basements," Tommy Lee of Fundstrat Global Advisors said in an interview with CNBC's "Trading Nation." "Two quarters of pretty decent household formation isn't getting everybody out of the basement. I think this means we have multiple years where household formations are well over 1.3 million, 1.4 million."

Forecasters will be revising their second-quarter GDP estimates higher following today's report, says Econoday, not to mention their estimates for Thursday's index of leading economic indicators where permits are one of the components.

Harlan Green © 2015

Follow Harlan Green on Twitter: https://twitter.com/HarlanGreen

Tuesday, June 16, 2015

Higher Retail Sales + Consumer Confidence = Growth

Popular Economics Weekly

The consumer showed a lot of life in May, driving up retail sales 1.2 percent with gains sweeping nearly all components. A leading component in the month was motor vehicle sales which jumped 2.0 percent, excluding which retail sales still rose a very strong 1.0 percent. Another component showing special strength was gasoline sales which got a boost from higher prices.

Still, excluding both of these components, retail sales ex-auto ex-gas gained a very solid 0.7 percent. These results offset weakness in April, when total sales rose only 0.2 percent (upward revised from no change).

image

Graph: Econoday

Consumer sentiment is also up, jumping nearly 4 points to 94.6 which is well above expectations for 91.2. The gain is centered in the current conditions component, up 6.0 points to 106.8, which offers an early signal for June-to-May consumer strength. The expectations component shows a smaller but still healthy gain, up 2.6 points to 86.8. The gain here points to confidence in the jobs outlook.

image

Graph: Econoday

What does all this mean? Apart from vehicles and gasoline, building materials & garden equipment stores, were up 2.1 percent in what is a good sign for the housing sector. Clothing & accessories stores rose 1.5 percent while non store retailers rose 1.4 percent. Department stores, which sank a steep 2.9 percent in April, rebounded with a 0.8 percent gain.

And, there were solid upward revisions to the two prior months with total sales in April moving from unchanged to plus 0.2 percent and March moving from plus 1.1 percent to 1.5 percent. The May burst and April revision have forecasters raising their second-quarter GDP estimates while the March revision has them raising their first-quarter revision estimates.

This should mean we will see much better GDP growth for the rest of 2015, and maybe into 2016, which is a Presidential election year, let us not forget, as the unemployment rate continues to fall. And Presidential years have historically shown better growth, for some reason.

Harlan Green © 2015

Follow Harlan Green on Twitter: https://twitter.com/HarlanGreen

Tuesday, June 9, 2015

Friday’s Unemployment Report Was Gangbusters!

Popular Economics Weekly

Why start with motor vehicle sales, I said yesterday? Because jobs are created these days only when consumers buy more, and they will only grow their purchases when incomes are rising.

So the good news in Friday’s BLS employment report is that wages and salaries are finally ticking up, in spite of corporation efforts to offshore even skilled work with the so-called H-1B visa program that allows corporations to bring in cheaper paid foreign workers that are now replacing American workers.

image

Graph: Marketwatch

The U.S. pumped out a robust 280,000 jobs in May, showing that companies are still on the prowl for new workers despite what appears to have been a temporary slowdown in economic growth earlier this year.

The increase in hiring — the biggest since December — was widespread and suggests the economy has regained momentum. High-tech firms, health-care providers, hotels, home builders and retailers all added workers.

And the Index of Small Business Optimism increased 1.4 points to 98.3,  another sign of increased hiring, since small businesses create some two-thirds of new jobs.  May is the best reading since the 100.4 December reading but nothing to write home about, said the NFIB. The 42 year average is 98.0.  Eight of the 10 Index components posted improvements.

Small Business Optimism Index

Graph: Calculated Risk

So small businesses posted another decent month of job creation in May, a string of 5 solid months of job creation. On balance, owners added a net 0.13 workers per firm over the past few months.... Twenty-nine percent of all owners reported job openings they could not fill in the current period, up 2 points, revisiting the February reading, and the highest reading since April 2006.

What will increase GDP growth, and even more jobs, is that exports were up 6.5 points to 55.0 in a reading that highlights yesterday’s big service-sector surplus in the April trade report. Second-quarter GDP looks to be getting a lift by a decline in imports, which are a negative number in the GDP report since they are subtracted from exports. Exports are a positive measure that indicates how much is domestically produced. Imports fell 3.3 percent in April to $230.8 billion at the same time that exports were up 1.0 percent to $189.9 billion.

Note there was special strength for arts/entertainment/recreation and management & support services in the ISM report said Econoday, the latter one of the strongest export industries for the nation. And, both real estate and construction show strength. The only one of 18 industries to contract in the month was, once again, mining which is being hurt by low commodity prices (meaning cheaper gas and oil).

Another indicator of improved hiring was in the government sector, often overlooked. Gallup's U.S. Job Creation Index reached a new high of plus 32 in May, up from plus 31 in April. And “perceived” job creation in the government sector was at a new high, when government job creation has been the lagging indicator holding back overall employment. Within the government sector, the Job Creation Index score reached plus 25 in May. This is up from plus 22 in April and the previous high of plus 23 in August 2014.

image

Graph: Calculated Risk

This is extremely important, because the Obama administration has the worst record in recent history of government job creation, and the loss of some 800,000 government jobs is the major reason employment has grown so slowly post-Great Recession (though Obama is now second-best in overall private sector job creation, according to Calculated Risk).

The public sector grew during Mr. Carter's term (up 1,304,000), during Mr. Reagan's terms (up 1,414,000), during Mr. G.H.W. Bush's term (up 1,127,000), during Mr. Clinton's terms (up 1,934,000), and during Mr. G.W. Bush's terms (up 1,744,000 jobs).

However the public sector has declined significantly since Mr. Obama took office (down 688,000 jobs). These job losses have mostly been at the state and local level, but more recently at the Federal level.  This has been a significant drag on overall employment, as we said.

Harlan Green © 2015

Follow Harlan Green on Twitter: https://twitter.com/HarlanGreen

Friday, June 5, 2015

Where’s the Outrage, Mr. President?

Financial FAQs

Where’s the outrage, Mr. President, when the New York Times just reported that at least 250 Disney World employees have been discharged, with many forced to train their own foreign replacements that have temporary H-IB work visas? Those are visas that are supposed to supply foreign workers where no American workers can be found. Yet Disney discharged those supposedly ‘irreplacable’ American data managers, in order to replace them with foreign workers.

Where’s the outrage when this is not even a “loophole” as characterized by the NYTimes, but flagrant violation of federal guidelines for the H-1B visas? And this during a jobless recovery from the worst depression since the Great Depression?

The Times reported the legal requirements for eligibility of such work visas.  According to federal guidelines, the visas are intended for foreigners with advanced science or computer skills to fill discrete positions when American workers with those skills cannot be found.

Their use, the guidelines say, should not “adversely affect the wages and working conditions” of Americans. Because of legal loopholes, however, in practice, companies do not have to recruit American workers first or guarantee that Americans will not be displaced.

“The program has created a highly lucrative business model of bringing in cheaper H-1B workers to substitute for Americans,” said Ronil Hira, according to the Times article, a professor of public policy at Howard University who studies visa programs and has testified before Congress about H-1B visas.

As if to compound the hurt for American workers, former employees said “many immigrants who arrived were younger technicians with limited data skills who did not speak English fluently and had to be instructed in the basics of the work.”

This is not the first time you didn’t speak out for American workers, Mr. President. You were also conspicuously silent during the reelection of Wisconsin Governor Scott Walker, when he turned Wisconsin into a right to work state and banned collective bargaining of public workers, which has reduced union membership drastically.

This is even though Wisconsin was one of the first states to establish unions and the right to collective bargain, which should be the right of every worker employee.

So when will you finally begin to lead the support for working Americans whose incomes haven’t really risen since the 1970s (when inflation factored in), and wealth virtually destroyed from the busted housing bubble?

“Many American companies use H-1B visas to bring in small numbers of foreigners for openings demanding specialized skills, according to official reports,” said the Times. “But for years, most top recipients of the visas have been outsourcing or consulting firms based in India, or their American subsidiaries, which import workers for large contracts to take over entire in-house technology units — and to cut costs. The immigrants are employees of the outsourcing companies.”

You should be lauded for Obamacare, and the many other programs you support for the poorest Americans, but what about skilled American workers that are still losing their jobs through no fault of their own?

And now you want U.S. workers to trust your word that the Trans-Pacific Partnership trade agreement will be good for American workers, not just American corporations?

Harlan Green © 2015

Follow Harlan Green on Twitter: https://twitter.com/HarlanGreen

Thursday, June 4, 2015

Big Surge In Vehicle Sales, Service Sector, ADP Employment

Popular Economics Weekly

Why start with motor vehicle sales? “Consumers weren't holding back in May when it came to buying cars and trucks which sold at a 17.8 million annual rate for a whopping 7.9 percent gain from April,” said Econoday re Tuesday’s motor vehicle report. Because it’s a sign consumers are more confident, ergo they must be feeling better about their jobs, ergo tomorrow’s U.S. Labor Department employment report should be very strong.

It’s the strongest vehicle sales since July 2005, believe it or not. And not due just to incentives and 100 percent financing offers, which have been available really since the end of the Great Recession. Until now consumers haven’t been spending what they are earning. April retail sales were punk. But the huge jump in vehicle sales should mean the start of the buying season for consumers, at last. Vehicle sales had declined four times over the past 6 months, as have sales in almost every economic sector.

Another hint at stronger employment growth ahead is the monthly ADP private sector employment report out yesterday. Automatic Data Processing estimates that private payrolls rose a moderate 201,000 in May. For comparison, the consensus for private payroll growth in Friday's BLS employment report is a bit higher, at 215,000 with the low estimate at 185,000. It is another sign of employment growth that anticipates Friday’s more ‘official’ Labor Department unemployment report, in other words, which includes government as well as private sector jobs.

image

Graph: Econoday

And perhaps the best indicator of future growth is the ISM non-manufacturing, or service sector index, which came in at 55.7, down from last month’s 57.8 percent, but showed improvement in exports and future hiring. New orders at 57.9 and business activity at 59.5 were particularly strong. Employment also slowed, down 1.4 points to 55.3 but it still points to employment growth.

Exports were up 6.5 points to 55.0 in a reading that highlights yesterday’s big service-sector surplus in the April trade report. Second-quarter GDP looks to be getting a lift by a decline in imports, which are a negative number in the GDP report since they are subtracted from exports. Exports are a positive measure that indicates how much is domestically produced. Imports fell 3.3 percent in April to $230.8 billion at the same time that exports were up 1.0 percent to $189.9 billion.

Note there was special strength for arts/entertainment/recreation and management & support services in the ISM report said Econoday, the latter one of the strongest export industries for the nation. And, both real estate and construction show strength. The only one of 18 industries to contract in the month was, once again, mining which is being hurt by low commodity prices (meaning cheaper gas and oil).

Another indicator of improved hiring was in the government sector, often overlooked. Gallup's U.S. Job Creation Index reached a new high of plus 32 in May, up from plus 31 in April. And “perceived” job creation in the government sector was at a new high, when government job creation has been the lagging indicator holding back overall employment. Within the government sector, the Job Creation Index score reached plus 25 in May. This is up from plus 22 in April and the previous high of plus 23 in August 2014.

image

Graph: Calculated Risk

This is extremely important, because the Obama administration has the worst record in recent history of government job creation (blue line in graph).  The loss of some 800,000 government jobs is the major reason employment has grown so slowly post-Great Recession (though Obama is now second-best in overall private sector job creation, according to Calculated Risk).

The public sector grew during Mr. Carter's term (up 1,304,000), during Mr. Reagan's terms (up 1,414,000), during Mr. G.H.W. Bush's term (up 1,127,000), during Mr. Clinton's terms (up 1,934,000), and during Mr. G.W. Bush's terms (up 1,744,000 jobs).

However the public sector has declined significantly since Mr. Obama took office (down 688,000 jobs). These job losses have mostly been at the state and local level, but more recently at the Federal level.  This has been a significant drag on overall employment, as we said.

Lastly, Jobless claims continue to run very low, down 8,000 in the May 30 week to 276,000 which is right at the Econoday consensus. The 4-week average is up slightly to 274,750 and is running about 5,000 lower than the month-ago comparison.

All these readings are at or near 15-year lows and indicate that the unemployment side of the labor market is very favorable.  So look for a gangbusters employment report tomorrow, dare we say?

Harlan Green © 2015

Follow Harlan Green on Twitter: https://twitter.com/HarlanGreen

Tuesday, June 2, 2015

Pending Home Sales In Record Territory

The Mortgage Corner

Pending home sales hit a 9-year high in April, according to data released last Friday by the National Association of Realtors. This is an early sign that housing construction and sales will come out of their winter hibernation, as consumers begin to spend again.

The NAR’s Pending Home Sales Index rose for the fourth consecutive month in April, increasing 3.4 percent to 112.4 – a 14 percent increase over April 2014 and the largest annual increase since September of 2012. The index is now at its highest level since May of 2006.

image

Graph: Econoday

NAR chief economist Lawrence Yun said that there have been steady gains in contract activity each month this year, indicating strong buyer demand. “Realtors are saying foot traffic remains elevated this spring despite limited – and in some cases severe – inventory shortages in many metro areas,” he said. “Homeowners looking to sell this spring appear to be in the driver’s seat, as there are more buyers competing for a limited number of homes available for sale. As a result, home prices are up and accelerating in many markets.”

That has to be why construction spending is surging, as I predicted last week. Higher pending sales mean increased demand for new homes with too few existing homes available for sale at reasonable prices.

image

Graph: Calculated Risk

The U.S. Census Bureau of the Department of Commerce just announced that construction spending during April 2015 was up at a seasonally adjusted annual rate of $1,006.1 billion, 2.2 percent above the revised March estimate of $984.0 billion, and 4.8 percent above the year ago estimate of $960.3 billion.

Private non-residential spending looks very strong, up 3.1 percent and led by the power and office sectors. Public spending is also strong with a large gain for highways & streets, and a surge in educational building. Though the gain in public spending came entirely from the state and local governments as federal construction spending declined for a second straight month.

And personal incomes are beginning to show some life, which may be the underlying reason consumers are feeling more confident. Personal income increased $59.4 billion, or 0.4 percent in April, according to the Bureau of Economic Analysis, though personal consumption expenditures (PCE) decreased just $2.6 billion, or less than 0.1 percent. But we see spending also increasing with increased consumer confidence in future prospects, according to the confidence surveys.

image

Graph: Econoday

The Conference Board’s Consumer Confidence gauge is rising to pre-recession highs; another reason why both new and existing-home sales have been stronger of late. The consumer confidence report for May came in at 95.4, slightly higher than April. Income expectations are up slightly and buying plans are higher across the board, including for autos, homes, and especially for appliances.

The U. of Michigan’s consumer sentiment report also showed strength, ending May at 90.7 vs the mid-month flash of 88.6. The implied reading for the last two weeks of the month is about 93 which, though down from April's 95.9 and January's peak over 98, is still very solid, according to Econoday.

Harlan Green © 2015

Follow Harlan Green on Twitter: https://twitter.com/HarlanGreen
Monday, June 1, 2015

IRS Data Theft and Russia’s Red Notice

Financial FAQs

It has to be more than a coincidence that the recent cyber theft of IRS tax data has been traced to Russian criminals. IRS investigators believe the identity thieves who stole the personal tax information of more than 100,000 taxpayers from an IRS website are part of a sophisticated criminal operation based in Russia, two officials told the Associated Press.

In fact, the connection between fraudulent tax refunds and actual officials of the Russian government has been well-documented by former Russian Hedge Fund Manager Bill Browder in his new book, Red Notice, which provides evidence of how Russian government officials were able to steal back $280,000,000 in taxes paid by his hedge fund, Hermitage Capital, which managed $4.5 billion in assets at the time.

“The information was stolen as part of an elaborate scheme to claim fraudulent tax refunds, IRS Commissioner John Koskinen told reporters. Koskinen declined to say where the crime originated,” said the AP report.

But this has happened in Russia. Russian officials have even stolen from their own government. It was Russia’s FSB Secret Police, successor to their KGB, that did the dirty deed in 1993, according to Browder. They had raided his Russian offices, and literally stole the corporate seals and legal documents of the corporations he managed that had paid $280 million in taxes the year before President Putin kicked him out of Russian.

When Russian officials found they couldn’t confiscate his assets—he had been able to sell all his Russian assets—they literally changed the ownership of his corporations and re-filed fraudulent tax returns. The refiled returns then reported sufficient losses that they could claim a refund for all of the $280 million in taxes his companies had paid to the Russian government.

This was so blatant a financial fraud that we can be sure our IRS must be aware of Russian government complicity. How? Because Browder was able to document the fraud, which resulted in a new U.S. law, the Sergei Magnitsky Act, which named the actual perpetrators of the tax theft —some 35 Russian government officials at last count—from ever entering the U.S. and freezing their assets.

Yet it seems even the IRS can be fooled. “In 2012, the IRS sent a total of 655 tax refunds to a single address in Lithuania, and 343 refunds went to a lone address in Shanghai, according to a report by the agency's inspector general. The IRS has since added safeguards to prevent similar schemes, but the criminals are innovating as well,” said the AP report.

The amount of rampant criminal fraud in Russia cannot have happened without Putin’s knowledge or assent. We know this because the very same perpetrators of the Browder-Hermitage Capital tax fraud were awarded medals by Putin for their ‘heroism’ in the scheme, believe it or not.

The Russian government then charged Bill Browder with the theft, which resulted in a call for his arrest by Interpol, and the resulting Red Notice—a notice the Russian government put out to Interpol for his arrest. They have put out a Red Notice 3 times to date, and 3 times Interpol has rejected their request because of the overwhelming evidence that the Russian government was behind the theft.

This shows the lengths corrupt officials have gone to cover up their thefts. That’s why we should have no illusion about the IRS tax return thefts. It’s a new cold war, of sorts. They want to continue stealing tax refunds from US taxpayers as they have done in Russia.

We also know this because Sergei Magnitsky, Bill Browder’s Russian attorney, was imprisoned and beaten to death by the same perpetrators for his refusal to recant the evidence of theft that defrauded the very same Russian people.

Harlan Green © 2015

Follow Harlan Green on Twitter: https://twitter.com/HarlanGreen