Showing posts with label industrial production. Show all posts

Monday, May 26, 2025

Manufacturing Not the Problem

 Popular Economics Weekly

“In April, U.S. manufacturing activity slipped marginally further into contraction after expanding only marginally in February. Demand and output weakened while input strengthened further, conditions that are not considered positive for economic growth.” ISM Manufacturing
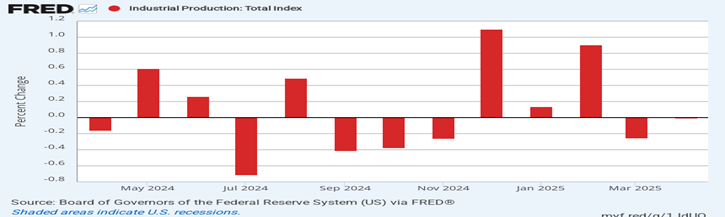
U.S. industrial production has stalled. Manufacturers are producing more than they can sell (higher input vs. output/demand). Unable to export the excess production, the Federal Reserve’s measure of industrial production showed seven months of zero or negative growth since last April.

What does that tell us? That manufacturing is no longer as important to our economy. We are now a mostly consumer-driven society that shops until we drop (and savings are exhausted), do lots of leisure things like travel and services that cater to us, such as healthcare, education, professional services (lawyers, doctors, engineers, etc.) construction, transportation and warehousing, and financial services.

But we also develop and export lots of software; information technologies, AI, ChatGPT and the like. This is all part of the service sector that really drives our economy. So, when President Trump says we need to bring back manufacturing, there’s not much manufacturing to bring back that would improve growth.

Also, we don’t have enough workers to fill the manufacturing jobs we have now. NyTimes’ David Brooks in an excellent Op-ed piece on our manufacturing history, said manufacturers can’t find enough workers today. There are almost 500,000 vacancies in manufacturing jobs. Trump is leading us down a blind path that only benefits him and Republicans, in other words.

This is while the service sector is still growing and will continue to grow even with more tariff threats if consumers will keep spending. The financial markets are more uncertain about future growth with higher tariffs because it means higher interest rates. We shouldn’t forget that former Fed Chair Alan Greenspan’s “irrational exuberance” speech warning that the financial markets were oversold, was four years before the Dot-com bubble burst and a recession ensued in 2000.

The Institute of Supply Management’s report on the service sector remains optimistic. “Economic activity in the services sector expanded for the 10th consecutive month in April, say the nation's purchasing and supply executives in the latest Services ISM® Report On Business®. The Services PMI® registered 51.6 percent, indicating expansion for the 56th time in 59 months since recovery from the coronavirus pandemic-induced recession began in June 2020.”

The take from this news is that Trump will make up any story to justify higher tariffs. He is thereby raising import taxes on the one hand for consumers and Main Street because we import so much, while cutting taxes for the wealthiest with the other hand via renewal of his tax cut bill that will cost more than $3trillion, according to government watchdog agencies.

Add the Medicaid and benefit cuts to the tariff costs, while firing those workers that run social security, Medicare; services that benefit all of us; and we can see the huge transfer of wealth to the oligarchs that Republicans’ budget deficits are engineering.

Harlan Green © 2025

Follow Harlan Green on Twitter: https://twitter.com/HarlanGreen

Tuesday, June 18, 2024

Retail Sales Falter--What Can Follow?

 Financial FAQs

American consumers are tiring after two years of no relief from higher prices and interest rates. They are now looking for bargains everywhere in the latest retail sales report from the Census Bureau.

It’s the second month of the second quarter that sales have disappointed, and consumer spending is a large part of Q2 growth.

“Advance estimates of U.S. retail and food services sales for May 2024, adjusted for seasonal variation and holiday and trading-day differences, but not for price changes, were $703.1 billion, up 0.1 percent (±0.4 percent) * from the previous month, and up 2.3 percent (±0.5 percent) above May 2023,” said the U.S. Census Bureau.

This was in part because gas prices had declined -2.2 percent. Revised April retail sales had declined -0.2 percent. The retail report is going to boost both stock and bond prices, which means interest rates should continue to decline. It also means consumers are spending less on travel and entertainment, parts of the service sector that have been powering most of the economic growth to date.

The biggest negative in the May retail report was a 0.4% decline in spending at restaurants. Restaurant spending has fallen in four of the past six months for the first time since the pandemic. Sales also fell at home centers, grocery stores and stores that sell furniture — a residue of rising housing prices and high mortgage rates.

Yet sales rose at internet retailers, clothing outlets and big-box electronics stores, suggesting Americans still have some money left over to pay for so-called discretionary goods, or things people want, rather than need, to buy.

But manufacturing is taking up some of the slack as overall industrial production rose 0.9% in May, the Federal Reserve also reported on Tuesday. That is the biggest gain since last July. The manufacturing component rose 0.9% in May after a 0.4% fall in the prior month.

Part of the boost was from motor vehicles and parts output that jumped 0.6% after a 1.9% drop in the prior month. Excluding cars, total industrial output increased 0.7%, so auto sales are helping to boost growth.

What does it mean for Q2 economic growth? Estimates are still all over the map. The latest data was good enough to keep the Atlanta Fed’s GDPNow estimate of Q2 growth at 3.1 percent, up from 2.6 percent on June 6. It remained above 3 percent because a drop in PCE (consumer spending) was outweighed by a rise in second-quarter real gross private domestic investment growth (i.e., replacing inventory and buying new equipment) and second-quarter real government spending growth (on such as combatting climate change and modernizing the American economy).

Fed officials now must decide if they want to slow economic growth even more, and maybe risk a downturn come the fall. Do they want to spoil the holidays for shoppers by not cutting interest rates? I wonder if they will dare in this election year.

Harlan Green © 2024

Harlan Green on Twitter: https://twitter.com/HarlanGreen

Friday, June 2, 2023

Huge Employment Surprise In May

 Popular Economics Weekly

MarketWatch

How can 339,000 jobs have been created in May when a recession is supposed to happen later this year? And the unemployment rate have risen to 3.7 percent from 3.4 percent last month, confounding all the pundits and many bankers?

Because we are about to enter another industrial age, using a term coined by Christopher Smart in a recent Barron’s Magazine article, a former Senior Treasury official who sees a “golden age of industrial policy” in upcoming years due to a new coordination of economic policies among western developed countries to combat global warming and a new cold war.

The increase in hiring was in all sectors except for manufacturing—in its own recession—and information services. The increases were led by Education & Health (97,000), followed by Professional businesses (64,000). Hiring was also strong in government (56,000), and bars and restaurants (33,000). Employment even rose by 25,000 in construction, a sector that has struggled to find workers, as the real estate sector has also been growing again.

Employment gains in April and March were a combined 93,000 higher than previously reported. The economy averaged a robust 283,000 new jobs in the past three months, but that’s down from 344,000 in the same period in 2022. 

The new debt ceiling agreement might give us some of the answer to the May jobs report. It preserved both the Infrastructure and Jobs and Inflation Reduction Acts, for starters and lifted the debt ceiling for another two years; until after the 2024 election.

The Inflation Reduction Act (IRA) is the third piece of legislation passed since late 2021 that seeks to improve US economic competitiveness, innovation, and industrial productivity. The Bipartisan Infrastructure Law (BIL), the CHIPS & Science Act, and IRA have partially overlapping priorities and together introduce $2 trillion in new federal spending over the next ten years.

I said last week after a sputtering start, it looks like the U.S. economy is picking up steam. First Quarter GDP growth was revised upward from 1.1 to 1.3 percent in the BEA’s second estimate and Q2 growth is expected to be around 2 percent.

The slump in manufacturing activity may not last long, either. Orders for U.S. manufactured goods jumped 1.1 percent in April largely because of the military, but business investment also rose sharply in a positive sign for the economy. Manufacturing output had been shrinking in the last six months.

And I mentioned in an earlier piece that business investment rose a sharp 1.4 percent. What are corporations seeing that induces them to invest more? They are also expecting economic growth to improve.

It really seems to me that this is a prosperity train leaving the station that will be difficult to stop, whatever the continuing Federal Reserve interest rate policy. There are too many players that want to see a better world ahead.

Harlan Green © 2023

Follow Harlan Green on Twitter: https://twitter.com/HarlanGreen

Friday, May 6, 2022

Why call A Recession Now??

 Popular Economics Weekly

NBER.org

We are at a classic top of the business cycle when the demand for products is sky high and all the factors that restrict supply are causing red hot inflation numbers. The Federal Reserve then must per its mandate to balance employment with price stability step in to restrict credit by raising short-term interest rates, among other measures.

What happens next will determine how high the Fed pushes interest rates to ‘tame’ the inflation tiger, and whether it causes another recession.

What the pundits who predict such things seem not to keep in mind is there are many parts that make a recession, which take a lot of time to happen (see wide spacing between gray bars that indicate recessions in NBER employment graph.).

For instance, there was no recession between 1983 to 1991, and the record 10-year expansion from 1991 to 2001. The expansion from 2009 to 2020 ended by the pandemic also lasted 10+ years.

The National Bureau of Economic (NBER) is the actual arbiter of recessions, and it says: “The determination of the months of peaks and troughs is based on a range of monthly measures of aggregate real economic activity published by the federal statistical agencies.”

And most of the indicators, including employment, consumer spending and industrial production, don’t indicate much of an impending slowdown.

 MarketWatch

The unemployment rate remained unchanged at 3.6 percent and 428,000 more jobs were created in April, according to the US Labor Dept., so no real sign of weakening employment, one of the first signs of a recession. Industrial production and business investments are also high and show little signs of slowing. Consumer spending is red hot and may suffer most from rising interest rates.

But the real test will be if many of the supply chain shortages can be circumvented, from chip makers who failed to predict the soaring demand for motor vehicles, to a war in Ukraine causing food shortages. And we still have the tail end of the coronavirus pandemic affecting China, a supplier of much of the world’s cheap products.

Under Chairman Greenspan, the Fed raised its rates 16 times over two years, after holding rates below the inflation rate for too long in early 2000, causing in part the housing bubble while allowing the negative interest ‘liar’ mortgages that brought down Lehman Brothers and caused the Great Recession.

And the number of job openings is at a series high of 11.5 million on the last business day of March, although little changed over the month, the U.S. Bureau of Labor Statistics reported on Tuesday. Hires, at 6.7 million, were also little changed while total separations edged up to 6.3 million.

So recessions take a long time to happen, in general, and there are much more important priorities now, including aiding Ukraine in its war with Russia and continuing to fight the pandemic.

Harlan Green © 2022

Follow Harlan Green on Twitter: https://twitter.com/HarlanGreen

Wednesday, December 4, 2019

Economic Growth...Watch Out--Part II

Popular Economics Weekly


It is obvious from the above graph that manufacturing activity is contracting, whereas the service industries continue to grow.  Exports that depend mostly on manufactured goods are therefore declining, while imports that depend on consumers are increasing. This also means slowing economic growth, since shrinking exports add less to GDP growth, while much larger import totals actually subtract from growth.
November was the fourth consecutive month of PMI® contraction, at a faster rate compared to the prior month, said Timothy R. Fiore, Chair of the Institute for Supply Management® (ISM®) Manufacturing Business Survey Committee. “Demand contracted, with the New Orders Index contracting faster, the Customers’ Inventories Index remaining at ‘too low’ levels and the Backlog of Orders Index contracting for the seventh straight month (and at a faster rate). The New Export Orders Index returned to contraction territory, likely contributing to the faster contraction of the New Orders Index.”
Manufacturing is in recession, in other words. The Philadelphia Inquirer reports that Kentucky’s steel industry has suffered because of steel and aluminum tariffs that have in fact slowed demand for its products. The result is steel prices have dropped by more than 40 percent since last summer.

“They have been hurt by tepid domestic demand for steel production amid a U.S. manufacturing recession and a global slowdown in economic growth, among other things,” reports the Inquirer.
Demand for steel in the U.S. grew 2.1 percent in 2018. But this year, a slowdown in American construction and automobile production helped diminish demand to just 1 percent, and it is projected to grow just 0.4 percent in 2020, the World Steel Association said this month, per the Inquirer.
And “Global trade remains the most significant cross-industry issue,” said ISM’s Fiore. “Among the six big industry sectors, Food, Beverage & Tobacco Products remains the strongest, while Fabricated Metal Products is the weakest. Overall, sentiment this month is neutral regarding near-term growth,” says Fiore.
Why the decline in manufacturing? It has to be the Trump administration’s trade policies, as manufacturing depends on foreign trade for many of its components, and foreign demand for many of its products.

This is while the Trump administration has just announced new tariffs on steel and aluminum products from Brazil and Argentina, further hurting global trade.

We also know overall Industrial Production is declining. Total industrial production was 1.1 percent lower in October than it was a year earlier. Capacity utilization for the industrial sector decreased 0.8 percentage point in October to 76.7 percent, a rate that is 3.1 percentage points below its long-run (1972–2018) average.

Last week’s revised Q3 GDP report was upped to 2.1 from 1.9 percent, with a slight increase in consumption and inventories. But it won’t help an even weaker Q4 GDP which is predicted to barely grow due to declining exports, as I said last week.


Manufacturing and consumer spending are really the two main components of economic growth. Stock prices of the largest steel companies have declined as much as 50 percent, also according to the Inquirer. And with steel prices down, their earnings have begun to decline.

So trade wars seem to be wreaking as much havoc to economic growth as other geopolitical concerns, such as growing civil unrest in the Middle East and Asia (Hong Kong). Continuing to wage trade wars in the name of national security is really becoming a danger to our national security, as well as economic growth.

Harlan Green © 2019

Follow Harlan Green on Twitter: https://twitter.com/HarlanGreen

Friday, October 18, 2019

Slower Retail Sales Hint at Lower Q3 Growth

Popular Economics Weekly


U.S. retail sales that mirror consumer spending, which powers some two-thirds of U.S. GDP growth, fell for the first time in seven months in September, raising fears that a slowdown in the American manufacturing sector could be starting to bleed into the consumer side of the economy.

The Commerce Department said Wednesday that retail sales dropped 0.3 percent last month as households slashed spending on building materials, online purchases and especially automobiles. The decline was the first since February.

Retail sales have increased 2.3 percent year-over-year, which is not a good number, as can be seen in the above graph dating from 2015. It averaged closer to 4 percent from 2010 to 2015, before falling to its current level.

And manufacturing has been hurting this year, as manufacturing production fell 0.5 percent, in the Fed’s latest Industrial Production report, after rising 0.6 percent in August due to a strike at General Motors. U.S. industrial output overall dropped 0.4 percent from a month earlier in September 2019.  

That was the sharpest decline in industrial output since April. For the third quarter as a whole, industrial production rose at an annual rate of 1.2 percent following declines of about 2 percent in both the first and the second quarters, per the below graph, with brown bars in graph showing negative growth. 

Tradingeconomics.com

Hence economic growth is looking weaker for the third quarter, with GDP growth now forecast at just 1.5 percent, according to a projection by CNBC and Moody’s Analytics.
“Weak consumer spending and inventory data caused economists responding to the Rapid Update tracker to lower their collective GDP projections by one-tenth of a percentage point to 1.5 percent, the lowest level yet for Q3,” said CNBC.
Consumers must keep spending more than they are saving to keep this economic afloat, in other words. The University of Michigan sentiment survey says consumers are optimistic on that score.

Econoday commented that last Friday’s U of Michigan survey bounced sharply higher in October, to a much stronger-than-expected 96.0 that easily exceeds Econoday's consensus range.
“The assessment of current conditions is the strong point in October's report, up nearly 5 points to 113.4 in what is a positive indication for consumer spending this month. Expectations are also higher, up 1.4 points to 84.8 and together with the jump in current conditions, suggest that the impeachment inquiry of President Trump is not having a significant impact on the consumer. In fact, the report notes that the ongoing GM strike was mentioned by respondents nearly twice as much as the impeachment.”
The GM strike has reportedly been settled, but the trade wars haven’t, so it remains to be seen whether consumers can remain this optimistic about their future.

Harlan Green © 2019

Follow Harlan Green on Twitter: https://twitter.com/HarlanGreen

Thursday, May 16, 2019

Oh, Oh, Retail Sales Also in Decline?

Popular Economics Weekly

The effects of the Trump administration’s trade wars are already slowing down consumer spending; not a good sign if Trump maintains tariffs for a longer period, as promised.


The US Census Bureau is now reporting a sharp decline in retail sales. A 1.1 percent decline in auto sales (signaled by the prior release of unit sales at manufacturers, says Econoday) is no surprise and neither is a 1.8 percent jump at gasoline stations, due to rising gas prices. A big surprise, however, is the 1.3 percent drop at electronics & appliance stores that follows a 4.3 percent tumble in March.

Weakness here hints at lower prices for consumer electronics and also lower spending on home improvements, reports the Census Bureau. Furniture sales also hint at trouble for residential investment, coming in unchanged following March's 3.1 percent decline, as do sales of building materials which fell 1.9 percent in April following, however, a 1.2 percent rise in March.

Lower Q2 consumer spending is also bringing down the consensus Q2 GDP growth into the 2 percent range, after the 3.1 percent Q1 GDP growth update, says CNBC chief economist Steve Liesman.

 Why? I maintain that Trump’s belligerent trade talks are turning off new investments, as manufacturers also batten down the hatches for a prolonged trade war. Prices are rising everywhere, and the U.S. is just beginning to see the effects of the various trade wars, including a threatened increase in auto tariffs that has unsettled European markets as well.


Industrial production overall is plunging, the Federal Reserve reports, down 0.5 percent in April. Motor vehicles and parts, where consumer sales have been mostly soft this year, fell 2.6 percent in April for a second monthly decline and year-over-year contraction of 4.4 percent. (Note this is a direct effect of higher import tariffs being passed on to vehicle manufacturers.)

Business equipment fell 2.1 percent in the month for yearly growth of only 0.1 percent which doesn't point to acceleration for business investment. Consumer goods also fell, down 1.2 percent in the month with construction supplies up only 0.1 percent that follows March's 1.7 percent dip in readings that don't point to strength for construction in general. Selected hi tech is a positive for April, up 0.6
percent with annual growth here at 3.2 percent. 

Who will put a stop to Trump’s trade war nonsense? Iowa farm state Senator Chuck Grassley, Chairman of the Finance Committee, is just one Republican beginning to sound the alarm on the harm it is already doing to Midwest farmers.
“It’s going to have some impact on the elections, of course,” said Grassley to reporters. “So far, I haven’t seen farmers abandoning Trump, but it’s going to have some impact.”
But Trump isn’t listening to him, he says, so he may have to put his warnings in writing.  (Is that a threat?)  There will be many more Republicans opposing the tariffs. Trump can’t afford to lose the support of those ‘free trade’ Senators or their Midwest supporters, in other words.

Harlan Green © 2019

Follow Harlan Green on Twitter: https://twitter.com/HarlanGreen

Monday, January 21, 2019

Conflicting Growth Signals?

Popular Economics Weekly


How do we reconcile the fact that industrial production in 2018 was very good, probably due to producers stocking up before more new tariffs are announced, and consumer sentiment has plunged to a 2-year low because of the government shutdown?

A surge in motor vehicle production together with construction supplies along with a strong gain for business equipment caused a 1.1 percent December increase in manufacturing production that far surpasses Econoday’s consensus range where the top estimate was only 0.4 percent.

Consumers power most economic activity with their spending, so when they grow worried about future prospects, spending and economic growth slow down. Hence the reduced growth expectations in 2019, as there is a growing consensus that a prolonged government shutdown will begin to harm large and small businesses.

Trump’s chief economic advisor Kevin Hasselt reports the shutdown has cost $1.2 billion in economic activity per week in just the first three weeks of 2019, and could cost much more if the shutdown continues.


In what is the first major economic indication of trouble tied to the government shutdown, the consumer sentiment index plunged to a 90.7 reading that is far below consensus estimates of 95.5. The expectations component fell nearly 9 points to 78.3 with current conditions also taking a hit, down more than 6 points to 110.0.

Richard Curtin, chief economist of the U. of Michigan sentiment survey, reported “Consumer sentiment declined in early January to its lowest level since Trump was elected. The decline was primarily focused on prospects for the domestic economy, with the year-ahead outlook for the national economy judged the worst since mid-2014. The loss was due to a host of issues including the partial government shutdown, the impact of tariffs, instabilities in financial markets, the global slowdown, and the lack of clarity about monetary policies. Aside from the direct economic impact from these various issues on the economy, the indirect effect meant that half of all consumers believed that these events would have a negative impact on Trump's ability to focus on economic growth."

Another casualty of the shutdown was that some government statistics, such as retail sales, haven’t reported for December. December sales are expected to be healthy, but then we have the usual January letdown as consumers retrench while waiting for their tax refunds that may also be delayed because of the shutdown.

So consumers are beginning to recognize the record shutdown length is affecting this year’s economic prospects,. And we shouldn’t forget what happened the last time higher tariffs were enacted. It was just prior to the 1929 stock market plunge. The Smoot-Hawley Tariff Act of 1930 raised import tariffs by an average 20 percent, which helped to turn it into the Great Depression.

Are we about to repeat that history?

Harlan Green © 2019

Follow Harlan Green on Twitter: https://twitter.com/HarlanGreen

Friday, May 18, 2018

April Retail Sales, Consumer Spending Just Ok

Popular Economics Weekly


Consumers have to do better, if GDP growth is to exceed 3 percent, as the recent tax cut bill promised. Consumer spending was weak in the first quarter and the first look at the second quarter is no better than moderate. Total retail sales rose an as-expected 0.3 percent in April. That still means retail sales are increasing almost 5 percent annually, but that can’t continue with such small monthly increases.

Vehicle sales, despite a decline in previously reported unit sales, posted a rise of 0.1 percent in the month which is very respectable given the oversized comparison with March when sales jumped 2.1 percent. Gasoline sales rose 0.8 percent on higher prices in the month and when excluding both vehicles and gas, retail sales matched the 0.3 percent showing at the headline level.

And manufacturing is picking up for the second straight month. Industrial production rose 0.7 percent in April, the Federal Reserve said Wednesday. Strength is the message from industrial production which rose 0.7 percent in April on top of an upward revised 0.7 percent gain in March, which should boost Q2 GDP growth above the 1.9 percent Q1 initial estimate. But that won’t get us to 3 percent GDP growth, either. Manufacturing production moved 0.5 percent higher. Mining once again leads the gains with a 1.1 percent surge in the month with utility output also positive at a 1.9 percent gain.


Details throughout the retail report were mixed: furniture, which offers a reading on housing demand, extended recent strength with a 0.8 percent gain but restaurants, and their indication on discretionary spending, fell 0.3 percent but following a sharp gain in February, reports Econoday. Building materials rose 0.4 percent in another positive sign for residential investment while nonstore retailers, the report's strongest component, posted a solid 0.6 percent gain.

Today’s new-home construction report was also positive, as housing demand remains robust, but the jury is still out on whether the massive tax cuts will boost consumer spending at all, and so economic growth past the 2 percent plus annual rate that has prevailed since the end of the Great Recession.

Harlan Green © 2018

Follow Harlan Green on Twitter: https://twitter.com/HarlanGreen

Wednesday, May 17, 2017

Increase Industrial Production Sign Higher Growth?

Popular Economics Weekly

Industrial production in April grew at the fastest monthly rate in more than three years on the back of broad-based gains in the manufacturing sector, reports the Federal Reserve. Industrial production grew 1 percent in April led by a 5 percent increase in motor vehicle production. It was because business investment is up sharply, as is consumer spending.

Business equipment, in a positive indication for second-quarter business investment, rose a very sharp 1.2 percent, reports Econoday, which could be a sign of a badly needed business expansion. “Production of consumer goods was even stronger, up 1.5 percent. Two negatives are hi-tech industries with a small decline and also construction supplies which posted a second straight dip that offers a reminder of this morning's disappointing housing starts report.”
There’s an obvious reason for the surge in business investment. Businesses need more automation, as they can’t find enough qualified workers to fill the 5.743 million, job openings reported in the Labor Department’s latest JOLTS report, much more plentiful than total hirings of 5.260 million in April, a gap of 483,000.

That also means an ultimate surge in badly needed Labor Productivity that has been lagging of late. From the first quarter of 2016 to the first quarter of 2017, productivity increased just 1.1 percent, reflecting increases in output and hours worked of 2.4 percent and 1.3 percent, respectively, said the BLS.

And without higher labor productivity, the US economy can’t grow more than the current 2 percent GDP growth rate. What was the rate during periods of higher growth? Until 2000, economic growth averaged more than 3 percent, while productivity averaged 2.5 percent until 2007.

 But then something happened. Average productivity plunged to 1.2 percent from 2010 onward. Why? Businesses stopped investing, for starters. This was partly due to the plunge in oil prices (from $100 to $30 per barrel last year), and consequent plunge in industrial production.

But our population also began declining, the other component to GDP growth (besides labor productivity). Until 2000, the U.S. population grew more than 1 percent, but since 2000 average population growth halved to about 0.5 percent.

Graph: CBO

The Congressional Budget Office estimates that we would need 2.8 million new workers per year to reach the 3 percent growth rate that Trump and Repubs want. Where will they come from? New immigrants, as the U.S. currently generates just 600,000 new job entrants per year, on average.

The baby boom is gone, in other words, and even the record-breaking millennial generation won’t fill the bill.  So we need more immigrants, not less, as well as higher labor productivity, if Repubs are to boost economic growth.

Harlan Green © 2017

Follow Harlan Green on Twitter: https://twitter.com/HarlanGreen

Friday, November 18, 2016

Record Retail Sales, Higher Growth Ahead?

Financial FAQs

It looks like Q4 GDP could be higher than the Third Quarter’s initial estimate of 2.9 percent growth. That’s because retail sales and wholesale inventories, both major contributors to growth, are surging.
Retail sales jumped 0.8 percent in October with September revised 4 tenths higher to plus 1.0 percent. The consumer started the fourth-quarter better than expected and finished the third-quarter even stronger than that, according to BEA’s revision.


The data show wide gains for both months led by the most important component of all, autos which rose 1.1 percent in October on top of September's 1.9 percent surge. Building materials & garden equipment are also very strong, up 1.1 percent following September's 1.8 percent gain with both pointing to strength for residential investment. Non-store retailers are also a standout and reflect strength in e-commerce, up 1.5 percent and up 0.9 percent in the two months.


And manufacturing activity was also strong, Year-on-year, all vehicle production is up a very solid 5.0 percent and eclipsed only by the 6.7 percent gain for the selected hi-tech component which rose 1.0 percent in October to extend its run of impressive gains, according to Econoday. Another positive is a 0.2 percent gain for business equipment which has otherwise been weak most of the year.

Midwest manufacturing is also doing better. Kansas City Federal Reserve manufacturing activity report said, “This was the second consecutive month of rising factory activity in the Tenth District, the first time that has happened in nearly two years,” according to Kansas Fed chief economist Chad Wilkerson.

But what will happen with rising interest rates and a stronger dollar? Long term bond rates have jumped almost 1 percent since P-Elect Trump announced his very ambitious infrastructure upgrades, but which Fed Chair Yellen threw some cold water on yesterday in congressional testimony. She asked, Where will the workers come from to build it when we are already at full employment?

Another economic indicator reported the U.S. is growing at a moderate pace and is likely to do so through early 2017, according to the Conference Board’s Index of Leading Economic Indicators (LEI). The LEI is an index that measures the nation’s future economic health. It rose 0.1 percent in November after a 0.2 percent gain in the prior month, the Conference Board said Friday.

“Although its six-month growth rate has moderated, the index still suggests that the economy will continue expanding into early 2017,” said Ataman Ozyildirim, economist at the board. Its measure of current economic conditions rose 0.1 percent, the “lagging” index of past activity increased 0.2 percent, meaning current activity has slowed.

We therefore believe that Q4 will shape up to have perhaps 3 percent plus GDP growth. Will this extend into next year? It depends on how extensive and expensive will be the Trump infrastructure plans, because it will certainly boost long term rates and inflation.

But rising interest rates and higher inflation are actually signs of higher economic growth.  Fed Chair Yellen seemed to remain cautious about the need to boost Federal Reserve short term rates in her latest congressional testimony, even though higher inflation and growth seem inevitable.

Harlan Green © 2016
Follow Harlan Green on Twitter: https://twitter.com/HarlanGreen

Monday, August 22, 2016

Much More Housing Needed

The Mortgage Corner

There’s an exception to the current low inflation prognostications echoed in my column on the San Francisco Fed John Williams. It’s in housing, which is struggling to meet the surging demand for both new homes and apartments that our newest millennial generation and immigrants need. The result is housing prices are rising faster than inflation, some 5 to 6 percent.

But if Janet Yellen and her Fed Governors give in to the cry by inflation hawks for higher interest rates just because Q3 and Q4 growth may be slightly higher than the horrid current GDP growth (how about 1.2 percent?), the housing rally (if you can call it that) would be nipped in the bud. It’s only because of the record low mortgage rates that housing is becoming more affordable for those that can afford to buy—which is the diminished American middle class. We will know more when both new and existing-home sales come out this week.

Millennials are the new baby boomers (as well as their offspring) in being the largest population group in history. And they are coming of age, all 80 million of them, of which the oldest now are 36 years of age and forming households.

 Graph: NAHB.org

This increased demand for housing is reflected in new home construction and higher builder optimism, reflected in the Wells Fargo Housing Market Index that measures home builders sentiment, and has been positive since January 2014.


 July housing starts rose a strong 2.1 percent to a 1.211 million annualized rate which comes on top of June's 5.6 percent surge. Starts for single-family homes, the most important category in terms of economic growth, rose a very respectable 0.5 percent in July but were dwarfed by a 5.0 percent surge for multi-family homes. These results point to ongoing strength for construction, as well.

Other signs point to faster growth, such as industrial production, which is finally expanding after contracting for more than one year? July production jumped 0.7 percent to give a big one half point lift to the capacity utilization rate which is at 75.9 percent, according to the Federal Reserve. And the Chicago Fed’s National Economic Activity Index that attempts to measure overall US growth rose to a 12-month high this week.


Manufacturing output rose 0.5 percent in the month which follows a downward revised but still very respectable 0.3 percent gain in June. Vehicle production was exceptionally strong in June and was also very solid in July though other manufacturing industries were also strong contributors to the latest month's gain.
Hi-tech was also strong in the month and a look at market groups shows 0.6 percent monthly gains for both consumer goods and business goods, the latter a plus given the persistent weakness in business investment.

The pundits are saying that Fed Governor Yellen will hint at a boost in the Fed’s short term rates from 0.5 percent, but that would be a mistake. There is no really affordable housing being built at present, which means rents and rental housing will have to carry the burden of new household formation.

And the result is that rents are now rising at record rates throughout the country. In fact, RealtyTrac, (www.realtytrac.com) “the nation’s leading source for comprehensive housing data,” released its 2016 Rental Affordability Analysis in January, which shows that buying is still more affordable than renting in 58 percent of U.S. housing markets despite home price appreciation outpacing rent growth in 55 percent of markets. The report also shows that the rise in rents is outpacing weekly wage growth in 57 percent of markets, per Realtytrac.

Harlan Green © 2016

Follow Harlan Green on Twitter: https://twitter.com/HarlanGreen

Friday, July 15, 2016

Retail Sales Augur Better Economic Growth Ahead

Popular Economics Weekly

Many signs are pointing to better growth ahead, led by consumer, or retail spending. Ex-auto ex-gas offers a gauge on underlying trends in consumer spending, as non-store retailers popped a 1.1 percent surge in the month which follows even stronger gains in prior months.


Additionally, department stores, up 0.9 percent, show a big comeback in the month with sporting goods & hobbies strong for a second month. There was also a large 3.9 percent surge in building materials & garden equipment, a component that had been lagging. This is because of surging housing sales—both new and existing homes are now topping 6 million units per year and back to pre-recession (though not housing bubble) levels.

Graph: Econoday

And industrial production is reviving. Industrial production in June grew at the fastest monthly rate in eleven months, on the back of strong auto and utility output, but analysts said the sector was still likely to face headwinds in coming months.

The Federal Reserve said Friday that industrial production grew 0.6 percent in June, topping the economists’ consensus for 0.5 percent growth. This is the fastest growth since last July.

The production of motor vehicles & parts surged 5.9 percent in June following a 4.3 percent drop in May. Year-on-year, this component tops the list with 7.8 percent growth compared to only 0.4 percent growth for manufacturing as a whole. Only due to vehicles, manufacturing managed to put in a good showing in June, up 0.4 percent on the month to reverse a revised 0.3 percent decline in May.

In other words, the numbers look good enough to augur 3 percent GDP growth in Q2. Retail sales in particular are a major plus for the second-half economic outlook not to mention coming data on the second quarter (sales for April, after the second revision, are at a standout plus 1.2 percent, for instance). Monthly core retail sales were up a very large 0.7 less volatile auto and gas sales which translates to a 8.6 percent annual sales rate, but averages out to a 4 percent increase year to date.

So the job market (and so economic growth) is healthy and the consumer alive and spending.

Harlan Green © 2016

Follow Harlan Green on Twitter: https://twitter.com/HarlanGreen

Friday, December 19, 2014

Conference Board’s Leading Economic Indicators Near Highs

Financial FAQs

The Conference Board Leading Economic Index® (LEI) for the U.S. increased 0.6 percent in November to 105.5 (2004 = 100), following a 0.6 percent increase in October, and a 0.8 percent increase in September.

It is a further sign of strong U.S. growth in the months ahead, maybe as high as 4 percent over the next 2 quarters. GDP growth has already averaged 4.25 percent over the last 2 quarters.

image

Graph: Trading Economics

“The increase in the LEI signals continued moderate growth through the winter season,” said Ken Goldstein, Economist at The Conference Board. “The biggest challenge has been, and remains, more income growth. However, with labor market conditions tightening, we are seeing the first signs of wage growth starting to pick up.”

image

Graph: Econoday

“Widespread and persistent gains in the LEI point to strong underlying conditions in the U.S. economic expansion,” said Ataman Ozyildirim, Economist at The Conference Board. “The current situation, measured by the coincident economic index, has been improving steadily, with employment and industrial production making the largest contributions in November.”

image

Graph: Calculated Risk

Much of the better job numbers come from industrial production that increased 1.3 percent in November after edging up in October. Manufacturing output increased 1.1 percent, with widespread gains among industries. Factory output was well above its average monthly pace of 0.3 percent over the previous five months and was its largest gain since February. It is up 13.2 percent from its low point in 2009, according to Calculated Risk.

Janet Yellen’s Federal Reserve also helped to boost growth prospects with her post-FOMC press conference in which she said that the Fed’s rates would not increase until long term job and wage growth showed a sustained pickup.

Nobelist Paul Krugman believes the Fed might wait even longer to raise their rates. “Basically, while growth and job creation have finally been pretty good lately, there is so far no sign whatever that the economy is overheating. Core inflation remains below the Fed’s target (the Fed focuses on a different measure that usually runs lower than the CPI, so this report is actually fairly far below target.)

“In fact, the opposite is happening. Domestic and worldwide inflation continues to fall, largely because of falling oil prices, which signals less use of petroleum products, ergo slowing business activity in other parts of the world. The U.S. seems to be the exception, in what we have come to call a ‘goldilocks economy’—growth without overheating.”

So we seem to have returned to a goldilocks economy much like that the 1990s that sustained high job and economic growth with little or no inflation, thanks to plentiful oil supplies that are projected to last for several years, at least.

Harlan Green © 2014

Follow Harlan Green on Twitter: https://twitter.com/HarlanGreen

Tuesday, July 23, 2013

Inflation Is Not The Problem

Popular Economics Weekly

All the talk that QE3 is about to end centers on when the Fed believes inflation will become a problem. Fed Chairman Bernanke doesn’t believe inflation will be a problem, as long as wages aren’t growing. And wages can’t even keep up with inflation at present, as he said in his latest congressional Q&A.

“There's a distinction between prices being high and prices rising...(cost of living) isn't going up, it's high, it's not going up. In other words, real wages are going down because even though inflation is very low wages have been growing slower than inflation.”

clip_image002

Graph: Econoday

This is substantially below the Fed’s target inflation rate of 2 to 2.5 percent, which is the level that shows sustained economic growth, according to the Fed. The reason for the spike in monthly CPI was energy prices, and the summer driving season. By major components outside the core, energy spiked 3.4 percent, following a partial rebound of 0.4 percent in May.  Gasoline surged 6.3 after no change in May.  The food component rebounded 0.2 percent, following a dip of 0.1 percent in May.

The Conference Board’s Index of Leading Economic Indicators (LEI) also mirrors the ongoing weak economic growth. The weak portions were in stagnant stock prices and building permits, while the positive contributors were higher long term interest rates (which predicts future growth), the leading credit index (more debt), lower average weekly initial claims for unemployment insurance, higher average consumer expectations for business conditions and manufacturers’ new orders for consumer goods and materials.  The factory workweek was a zero contribution.

clip_image004

Graph: Econoday

Right now, therefore, industrial production seems to be the main culprit, rather than the service sector, because of subdued exports. The Empire State and Philly Fed manufacturing surveys were slightly positive, but overall production has trended downward.

clip_image006

Graph: Econoday

So we can say that inflation should not be a problem for some time. Real inflation could even be years away, given that overall household incomes have shrunk 10 percent since 2000.  That means the decline in wages and salaries is the real problem holding back sustainable domestic growth.  Then the question becomes how to gain back some of that wealth?

Harlan Green © 2013

Follow Harlan Green on Twitter: www.twitter.com/HarlanGreen

Thursday, January 24, 2013

2013 U.S. Economy Finally In Recovery

Popular Economics Weekly

With tax rates returning to more normal levels from the rollback of Bush era tax cuts, and Republicans giving up on denying debt ceiling increases until April that would force more cuts in government spending, there seem to be very few domestic factors to hold back more robust growth in 2013.

The “No Budget, No Pay-Act” bill could also open a path to a longer term increase: It would require the House and Senate to each agree by April 15 to a budget resolution for fiscal year 2014. And such a measure, which is intended to set spending and revenue levels for the next five to ten years, might include debt ceiling increases, say congressional staffers.

We are already seeing signs higher growth is happening—maybe even approaching 3 percent GDP growth in 2013. The Conference Board’s Index of Leading Economic Indicators (LEI) just jumped 0.5 percent in December, industrial production is rising again, and retail sales are surging. This and increased housing production are sure to increase hiring. Weekly initial jobless claims have already fallen to 330,000, close to the longer term average.

clip_image002

Graph: Calculated Risk

The drop in jobless claims was the biggest factor in the LEI increase that predicts future growth. Conference Board economist Ken Goldstein said: “The latest data suggest that a pickup in domestic growth is now more likely, compared to a few months ago. Housing, which has long been a drag, has turned into a positive for growth, and will help improve consumer balance sheets and strengthen consumption. However, for growth to gain more traction we also need to see better performance on new orders and an acceleration in capital spending.”

What will help capital spending is surprising strong industrial production, with the manufacturing component up 0.8 percent following an increase of 1.3 percent the prior month.  Motor vehicle production was strong with a 2.6 percent rise after a 5.8 percent boost in November, along with other sectors.  Excluding motor vehicles, manufacturing output increased 0.7 percent after a 0.9 percent rebound in November.

clip_image004

Graph: Econoday

And retail sales are increasing 5 percent per year, almost back to early 2000 levels. Gains were led by furniture & home furnishings, food services & drinking places, and health & personal care.  A decline was seen in electronics & appliance stores. Overall consumer spending was moderately healthy in December and likely will lead many economists to bump up their fourth quarter GDP forecast (which had been nudged down last week from a negative international trade report).

clip_image006

Graph: Econoday

More housing construction in particular will boost growth this year, as it leads directly to new construction jobs, as well as boosts the financial sector. The jump in December housing starts was led by the multifamily component although single-family starts also were up notably.  Multifamily starts jumped 20.3 percent after a 6.3 percent decline in November.  The single-family component gained 8.1 percent in December after decreasing 3.2 percent the prior month.

The lesson seems to be that for all the political quarreling, there are fundamental factors driving growth. Increased hiring is driving up the demand for goods and services. Record low interest rates are boosting housing and stimulating exports due to the weaker dollar. The U.S. economy seems finally to be out of intensive care, and government is now aiding, rather than obstructing better growth.

Harlan Green © 2013

Follow Harlan Green on Twitter: www.twitter.com/HarlanGreen

Tuesday, December 18, 2012

Q4 GDP Growth Improving

Financial FAQs
We are seeing faster economic growth in the fourth quarter, even after the upward revision of Q3 GDP growth to 2.7 percent from 2.0 percent. The reason? The 146,000 jump in November payroll jobs, soaring retail sales, and the Fed’s determination to maintain QE3 with $45 Billion per month in bond purchases for several more years, if necessary, to boost employment. 
This is in spite of Hurricane Sandy that shut down much of the east coast. We can therefore expect that Q4 growth might exceed 3 percent, putting us back on the path to a more normal growth pattern.
Retail sales is leading the growth. Motor vehicle sales rebounded 1.4 percent after a 1.9 percent decrease in October.  Earlier in the month, unit new motor vehicle sales pointed to an even stronger increase but the Commerce Department’s sample size is not as good and all Personal Consumption Expenditure spending may be even stronger.
clip_image002
Graph: Econoday
And industrial production rebounded in November with notable help from Hurricane Sandy and a boost in auto assemblies, up 1.1 percent, following a decline of 0.7 percent in October (originally down 0.4 percent).  The market consensus was for a 0.3 percent gain. Capacity utilization for total industry rose to 78.4 percent from 77.7 percent in October.
The bottom line is that manufacturing has seen sharp swings over the last two months due to Hurricane Sandy.  But net for the period, this sector is still soft.  The clearly positive news is that consumers are out shopping for new cars, which is good news for manufacturing.  It suggests that while consumers are in a bad mood about the pending fiscal cliff, potential tax increases, they are spending despite survey recorded glum views, said Econoday .
clip_image004
And inflation is falling.  Year-on-year, overall CPI inflation came in at 1.8 percent versus 2.2 percent in October (seasonally adjusted). The core rate eased to 1.9 percent in November from 2.0 percent the prior month.
clip_image006
Lastly, the Federal Reserve just announced a new policy at its last FOMC meeting of the year.  It voted to continue with QE3, the $45 Billion in securities’ purchases per month until either the unemployment rate falls to 6.5 percent from its current 7.7 percent, and/or inflation tops 2.5 percent per year. 
Since it looks like inflation has been subdued, and the Fed believes it will take until 2016 to bring down the unemployment rate to its new target, the Fed could maintain easy credit for several more years, which is the best of all conditions for economic growth to continue.
Harlan Green © 2012

Tuesday, October 2, 2012

Jobs Picture Much Better Than Forecast

Popular Economics Weekly

The Bureau of Labor Statistics gave markets a shot of good news recently, when it revised the one year March-to-March 2012 jobs totals upward by 32,000 per month. This was huge and showed much better jobs growth than initially forecast by the Labor Dept., with the private sector providing 453,000 additional jobs March-to-March Q1, and a 386,000 net total with government job losses included. We have to wait until this Friday to know if September’s unemployment report more accurately reflects the current unemployment picture.

clip_image002

Graph: Calculated Risk

In fact, we may be seeing the BLS under estimating job formation again this year, as Q2 job growth was less, but all indicators are that it will improve this fall. For instance, weekly initial jobless claims fell a very sharp 26,000 to 359,000 in the week of Sept. 22, while consumers are spending more going into the holidays and the latest manufacturing report was very positive with increased hiring. The largest upward revisions were in Trade, Transportation, and Utilities, followed by Construction, Leisure and Hospitality jobs.

The ISM manufacturing index saw a huge boost after 3 down months to a 51.5 percent reading for manufacturing activity.

clip_image004

Graph: Econoday

Details back the optimism with new orders, at 52.3, showing solid growth. Employment is the big plus in the September report, rising 3.1 points to a 54.7 level that indicates a surprisingly brisk pace of hiring. Negatives include a fourth month of contraction for new export orders, which reflects weak global markets, and a sixth straight contraction in total backlog orders.

Another sign of improving jobs picture was the jump in consumer optimism. The Conference Board’s consumer confidence index showed the consumer mood improved in September, jumping a very strong nine points to 70.3. This was the best reading since February and the third best reading of the whole recovery, said Econoday.

clip_image006

This report stressed the consumer's improved assessment of the jobs market. Those saying jobs are currently hard to get fell seven tenths to 39.9 percent, which is the best reading since April. Those saying that jobs are plentiful rose, up 1.1 percentage points to a still however very modest 8.3 percent. Backing up these current readings was strength in the consumer's outlook for the jobs market where more see more jobs ahead and substantially fewer see fewer jobs.

So we have reason to believe both jobs and economic growth will accelerate in the coming months. Then there is the Federal Reserve’s commitment to keep interest rates at historic lows for as long as it takes to bring the unemployment rate down to more acceptable levels, such as 6 percent. This will not be easy, with Bernanke warning that the deadlocked Congress needs to provide some fiscal stimulus as well. We know austerity doesn’t work from the European example.

Harlan Green © 2012

Thursday, July 26, 2012

Why the Summer Growth Slowdown?

Financial FAQs

The summer growth numbers seem weak, and pundits are saying it’s due to the European recession (so lower exports), the ‘fiscal cliff’(employers uncertain about future growth), and consumers with too much debt. But the numbers really show a repeat of last summer, when hiring slowed due to basically the same worries but picked up again in the fall (due to the Japanese Tsunami instead of euro, and debt cap stalemate that downgraded U.S. debt).

However, overall growth is still weak because so much income has been transferred to the wealthiest; particularly since 2000 and the Bush tax breaks, leaving middle class earners with even less income than in 2000. In fact, middle incomes have not even kept up with inflation since 2000. And middle income earners—i.e., most consumers—have been the main engine of U.S. growth since World War II.

clip_image002

Graph: CBPP

The good news is the Conference Board’s Index of Leading Economic Indicators which seems to alternate in up and down months, still shows moderate growth prospects for the rest of the year.

clip_image004

Graph: Econoday

For instance, since July 2011 growth in the Coincident Indicators that tracks GDP growth has been positive 8 of the past 12 months, with huge spikes in October and December 2011 and only 1 negative month in March 2012. The Leading Indicator that attempts to predict growth over the next 6 months was more negative with 4 contractions in 12 months. But in fact, the Leading Indicator has grown 1 percent in the past 6 months, up from 0.5 percent over the prior 6 months, signaling better prospects for growth.

So why all the fears of a dismal rest of the year? Could it be the 24/7 news cycle that exaggerates both the good and bad news? That is what causes most ‘bubbles’, according to Robert Shiller of Irrational Exuberance fame. We are literally being showered with too much economic data that even economists are hard put to understand.

For instance, other indicators also point to better growth in the fall. By major components, June industrial production gained 0.7 percent after falling 0.7 percent in May, according to the Fed. Motor vehicles output added significantly to manufacturing, rebounding 1.9 percent in June after a 2.2 percent decline in May. Manufacturing excluding motor vehicles was quite strong also gaining 0.6 percent in June, following a 0.5 percent drop in May.

clip_image006

Graph: Econoday

So once again growth far outnumbers contraction in the manufacturing sector, with just 4 contractions in the past 17 months. So it seems rumor drives much of business and consumer confidence, as Europe’s problems seem to be affecting U.S. growth, but know one knows how much. So it is all about ‘momentum”, the magic word that spurred so much inflated stock values in the last decade, but now seems to deflate expectations for future growth!

What to do about this? Firstly, we need to counter the pessimists with greater stimulus spending, which more than pays for itself in increased activity. It can even be revenue neutral. For the real reason growth has been so tardy is most of the profits from the past 10 years of growth have gone to the wealthiest, thanks both to record corporate profits, and record tax cuts for the investor class, as I said—the lowest tax rates since the 1920s—that have drastically lowered tax revenues and increased the federal deficit.

So right now, it is the intransigence of many of the richest among us (such as Mitt Romney with his tax havens) who refuse to divert some of their wealth to provide more stimulus during a time of record income inequality. It is their refusal to return to the pre-Bush, Clinton-era taxation levels of 1992-2000 when most growth occurred and most jobs were created, in other words, that is holding back a real recovery.

Harlan Green © 2012