Popular Economics Weekly
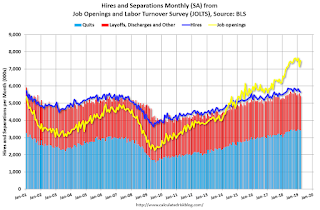
The number of job openings rose to 7.5 million on the last business day of March, the U.S. Bureau of Labor Statistics reported today. Over the month, hires and separations were little changed at 5.7 million and 5.4 million, respectively.
But the miniscule change in hires and separations doesn’t tell us the real employment story. This Calculated Risk graph shows the huge separation between the yellow line (Job openings) and blue line (Hires). It’s now almost 2 million.
The actual difference was because job openings surged 4.8 percent in the month to 7.488 million at the same time that hires fell 0.6 percent to 5.660 million, according to Econoday. “The gap between the two stands at a new record of 1.828 million, signifying a huge demand for workers that isn’t being met.”
Year-on-year, openings are up 8.6 percent vs. only a 0.6 percent rise for hires. The gap between total openings in March relative to the 6.211 million unemployed actively looking for a job in the month was 1.277 million.
This tells us how complex is the hiring process, since it’s becoming ever more difficult to match those looking for work with the advertised job openings. How can we fix the problem from the mismatch?
One hint is we know from last week’s unemployment report almost 500,000 fewer workers were available for work in the Household Survey, shrinking the labor pool, even though job hirings were up in the seasonally adjusted Establishment Survey that reports actual payroll numbers.
I believe those either leaving the workforce, or still looking for work, are waiting for better job prospects. Most do not want Amazon warehouse or Walmart jobs that pay barely above minimum wages.
The largest hires in the April unemployment report were all in the services sector. Professional services, education and health services led, with Leisure/Hospitality and construction hiring next—all in the lower-paying service sector.
Only 4,000 manufacturing jobs were created, according to the BLS, with the utilities and mining sector losing jobs.
Both the Institute of Supply Management’s (ISM) manufacturing and service sector activity surveys also declined in March, with manufacturing activity the weakest in 2 years. It was mainly due to the decline in new orders, possibly due to the trade uncertainty.
The 3.2 percent increase in the initial Q1 GDP growth estimate was a pleasant surprise, as I said last week, but it was largely because spending by local governments picked up due to the partial federal government shutdown and a “turnaround in investment, most notably in construction of highways and streets,” said the BEA.
Local and state governments may have been waiting to see if the Trump administration would chip in to boost needed infrastructure upgrades, and since that didn’t happen states decided to implement the needed projects.
The buildup in unsold inventories, and fewer imports also increased GDP numbers. That’s because import prices are rising as the recent tariff increases are being passed on to the consumer, contrary to what administration officials are saying.
And rising prices will put a cap on growth, as well as future hiring. So we are waiting to see if more are willing to work, or are still waiting for the right job so they can afford to pay for those higher prices.
Harlan Green © 2019
Follow Harlan Green on Twitter: https://twitter.com/HarlanGreen


No comments:
Post a Comment