Thursday, December 23, 2021

Here's To a Lasting Housing Recovery!

The Mortgage Corner

Since it is the holidays, I want to propose a New Year’s toast to a lasting housing recovery.

Firstly, home builders are beginning to play catch up with the housing shortage that has plagued those wanting a place to live since the end of the Great Recession and busted housing bubble. That’s when construction ground to a halt because one million more homes were built than were needed at the time.

Does this mean the housing market could begin a decade-long recovery as has happened in the past? It’s possible. Consumers are flush with cash from the pandemic aid and the personal savings rate is still at a post-recession high (6.9 percent).

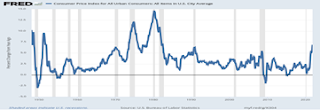
More than 1,800,000 housing units per year were constructed during the height of the housing bubble in 2006 (see below graph), which fell to just 400,000 units annually during the Great Recession in 2008 (gray bar), which is part of the reason for the current housing shortage.

The last two recoveries lasted approximately 10 years. So why not toast the possibility that this may be a housing recovery that might last, if the other roadblocks to a housing recovery, labor material shortages should ease next year?

CalculatedRisk

Construction is booming, which should begin to fill the very low inventory of homes for sale, despite the labor and material shortages.

“Single‐family housing starts in November were at a rate of 1,173,000; this is 11.3 percent above the revised October figure of 1,054,000. The November rate for units in buildings with five units or more was 491,000,” according to the Census Bureau.

Calculated Risk

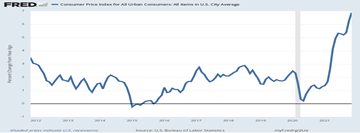
Rising existing-home sales are helping to fill the housing need. Existing-home sales rose 1.9 percent to a seasonally adjusted annual rate of 6.46 million in November, the National Association of Realtors said Wednesday. That is the third straight monthly gain. And there is room to grow more sales.

More than 7 million existing homes were sold in 2005 at the height of the housing bubble, per the above existing-home sales graph but sales declined to 4 million in 2008 during the Great Recession (gray bar in graph).

Unsold inventory is at a 2.1-month supply in November, the lowest since January. That’s down from 2.3 in the same month last year, and a 4 to 6 month supply of homes for sale during more normal times.

“Supply-chain disruptions for building new homes and labor shortages have hindered bringing more inventory to the market,” said NAR chief economist Lawrence Yun. “Therefore, housing prices continue to march higher due to the near record-low supply levels.”

There’s better economic news as well that may help to cure the housing crunch. Third quarter GDP growth was revised up slightly to 2.3 percent, and Q4 growth is projected to be even higher.

Consumer confidence is also on the rise again with the holidays. The index of consumer confidence rose to 115.8 in December from a revised 111.9 in the prior month, The Conference Board said Wednesday.

Lynn Franco, Senior Director of Economic Indicators at The Conference Board said, “The Present Situation Index dipped slightly but remains very high, suggesting the economy has maintained its momentum in the final month of 2021. Expectations about short-term growth prospects improved, setting the stage for continued growth in early 2022. The proportion of consumers planning to purchase homes, automobiles, major appliances, and vacations over the next six months all increased.”

So this is the best time to raise a toast to a continued housing recovery—and a Happier New Year!

Harlan Green © 2021

Follow Harlan Green on Twitter: https://twitter.com/HarlanGreen


Monday, December 20, 2021

This Inflation Can't Last

Financial FAQs

FREDcpi

Why the feverish speculation that higher inflation could last beyond next year, and dampen economic growth, when the American economy should otherwise return to a semblance of normalcy? The COVID-induced recession of 2020 lasted just two months and caused one of the deepest economic contractions in history.

The recovery is also one of the fastest in history, so it is causing a temporary climb in inflation. Firstly, consumers and businesses are flush with cash for the holidays. Why wouldn’t they want to spend it now, regardless of the rising prices sure to follow? Expectations are usually high during the holidays.

In May 2020 the CPI, seasonally adjusted inflation rate for consumers was a mere 00.22 percent and in November 2021 had risen to 6.9 percent, seasonally adjusted. But there is usually a New Year drop off in spending because consumers want to pay down their credit bills and save for the April tax season. So prices should also subside substantially, as most retail businesses know after the holiday shopping splurge.

There are a few caveats to this forecast, however. The Biden administration is not helping to lower inflation by reducing the Trump trade tariffs. Raising tariffs made more sense when the economy was booming before the pandemic, and we wanted to repatriate U.S. businesses to our homeland to boost American jobs.

But if the supply-chain slowdown is to be improved, smart economic policy says that tariffs should be lowered to increase the flow of international trade, and ease the supply bottlenecks.

Also, Biden’s ‘Buy America”, and “Made in the USA” emphasis will certainly keep prices from falling faster with products made in the USA, as it’s more expensive to produce things in America, vs. overseas.

But is that a reason for markets to panic, so that the Federal Reserve may overreact by raising interest rates too soon next year? I don’t think so.

Economists such as Larry Summers worry about what is called “stagflation”, a holdover from the 1970s fast rising prices for oil and other commodities that caused unions to follow suit and the Federal Reserve to maintain policies (such as keeping interest rates low) that tolerated higher wages and salaries.

That’s not the case anymore, mainly because unions are much weaker so that wage and salary increases have been kept down, which is a large part of any inflationary spiral.

So the other causes of higher inflation—supply-chain bottlenecks and a shortage of workers—could still be problems.

Nobel Laureate Paul Krugman cites Biden’s Council of Economic Advisors in a recent NY Times Op-ed who believe that this bout of higher inflation most resembles that of 1946-48, when the American economy hadn’t yet geared up to meet soaring consumer demand when also flush with cash from WWII savings.

But there won’t be such a wholesale conversion from a wartime to a peacetime economy in the pandemic recovery. In fact, we will be fast forwarding to an enhanced digital economy with much more reliance on 5G networks and Artificial Intelligence, and less dependence on workers to produce things.

As if to presage such a future the Conference Board’s latest Index of Leading Economic Indicators predicts good growth ahead, with or without the availability of more workers.

“The Conference Board Leading Economic Index® (LEI) for the U.S. increased by 1.1 percent in November to 119.9 (2016 = 100), following a 0.9 percent increase in October and a 0.3 percent increase in September,” stated its latest press release.

“The U.S. LEI rose sharply again in November, suggesting the current economic expansion will continue into the first half of 2022,” said Ataman Ozyildirim, Senior Director of Economic Research at The Conference Board. “Inflation and continuing supply chain disruptions, as well as a resurgence of COVID-19, pose risks to GDP growth in 2022. Still, the economic impact of these risks may be contained. The Conference Board forecasts real GDP growth to strengthen in Q4 2021 to about 6.5 percent (annualized rate), before moderating to a still healthy rate of 2.2 percent in Q1 2022.”

This prediction of a huge jump in future growth is based on 12 hard data indicators such as stock prices, interest rate spreads, and consumer credit flows, which lends more credence to its prediction of future trends—and to the fact that supply-chain disruptions and future employment trends may not be major factors affecting inflation next year.

So worrying about some kind of long-lasting inflationary spiral doesn’t make sense to me

Harlan Green © 2021

Follow Harlan Green on Twitter: https://twitter.com/HarlanGreen


Saturday, December 11, 2021

Should Interest Rates Remain This Low?

 The Mortgage Corner

Should home buyers worry about the record-low interest rates in the near or distant future?

Because interest rates are at post-World War II lows, the super cheap money is helping to drive up annual home price rates into double digits, resulting in a loss of affordability for many prospective home buyers and even renters.

FRED30yrmortgage

The 30-year conforming fixed mortgage rate favored by most home buyers has hovered around 3 percent since the start of the pandemic and been declining since the early 1980s, per the above Federal Reserve Bank of St. Louis (FRED) graph.

It is a major reason the S&P CoreLogic Case-Shiller U.S. National Home Price NSA Index of single-family, same home, price changes reported a 19.5 percent annual gain in September 2021, though slightly down from 19.8 percent in August. The S&P Index is a 3-month average for 20 metropolitan areas, so in some cities home prices are rising even faster.

“It’s unprecedented for us to get a massive run-up in home prices during a recession,” says Freddie Mac’s chief economist, Sam Khater. “It’s clear that [mortgage] rates matter even more than unemployment rates.”

FREDcpi

And inflation is soaring as well. The retail Consumer Price Index, seen above in the 2nd FRED graph, is up 6.8 percent in November Y-o-Y when it has averaged just 2 percent since the Great Recession.

If said inflation remains much higher than interest rates (3 percent vs. 6.8 percent inflation), it means in effect negative interest rates since higher inflation reduces the value of the loan principal over time. And that pours gas on the exploding home prices.

This is not an easy concept to understand, but it happened during the housing bubble when housing prices were also rising in the double digits annually.

Soaring inflation is the other problem, in other words, and that probably won’t decline until the labor and supply-chain shortages subside sometime next year.

So should home buyers wait for this housing price bubble to subside to buy a home? The National Association of Realtors hasn’t much helping advice.

"Home sales remain resilient, despite low inventory and increasing affordability challenges," said Lawrence Yun, NAR's chief economist. "Inflationary pressures, such as fast-rising rents and increasing consumer prices, may have some prospective buyers seeking the protection of a fixed, consistent mortgage payment."

Is there any good news? The Federal Reserve released the Q3 2021 Flow of Funds report on Thursday: Financial Accounts of the United States. It stated that American households’ net worth is at a record high as a percentage of GDP (more than 600 percent of GDP), increasing $2.3 trillion in Q3, thanks to government spending for the COVID pandemic that is approaching $5 trillion to date with more to come when the Build Back Better Act finally passes.

MarketWatch’s Steve Goldstein cites James Knightley, chief international economist at ING, who put a positive spin on the latest report. From the low point of the first quarter of 2020, household wealth has surged by $35.5 trillion. Combine this wealth rise with employment growth, and wage gains, and the U.S. consumer looks to be in good shape.

The “further massive accumulation of wealth only adds to the potential spending ammunition of the household sector, which gives us more confidence that the U.S. economy can expand by more than 4% in 2022,” says Knightley.

But there’s still a housing shortage that some economists predict could last 10 years, even if builders begin to catch up with demand. So this has happened before, and only a concerted effort by governments and home builders will ease the housing crunch.

Harlan Green © 2021

Follow Harlan Green on Twitter: https://twitter.com/HarlanGreen


Wednesday, December 8, 2021

COVID-19 is Making US Richer

Financial FAQs

FREDdisposalbleincome

More Americans are richer, thanks to the COVID-19 pandemic, believe it nor not. The pandemic has spurred congress and the Biden administration to act as if we are coming out of another Great Depression.

The U.S. is growing faster than in other developed countries that haven’t invested as much in the recovery. And those investments are going to Americans that need it the most.

Just since the American Rescue Plan passed in March 2020, 4.3 million more people have found employment. Wages and real disposable income are up, especially for low-wage workers, who are disproportionately women and people of color and who have experienced consistent wage growth since April 2021, say Rose Khattar and Andres Vinelli of the Center For American Progress, a progressive think tank.

It’s the New Deal all over again, but instead of the 1930s and a looming World War Two, congress and the Biden administration have acted to save the U.S. economy from the worst pandemic since the Spanish flu pandemic of 1918.

FREDgdp

“The U.S. is the only leading advanced economy to have exceeded its pre-pandemic levels, according to the Organization for Economic Co-Operation and Development,” say Khattar and Vinelli. “In fact, data from the most recent quarter shows that our real GDP—which is GDP adjusted for inflation—is around 13% larger than the end of the COVID-19 recession.”

It is largely due to Biden’s American Rescue Plan of last March that especially raised the lowest income brackets. Economist Gene Sperling, its White House Coordinator, says such growth not only helps lower-income folk, but children most of all with the child tax credit that alone has halved the child poverty rate.

And don’t forget the $1400 payments sent out to most Americans at a time when the pandemic lockdowns were in full force.

More evidence of the record post-pandemic growth is that service-oriented businesses making up two-thirds of economic activity---such as banks, retailers and drug stores—grew in November at the fastest pace on record, even as companies grappled with major shortages of labor and supplies.

The Institute for Supply Management’s services PMI climbed to 69.1 percent last month from 66.7 percent in October, when 50 percent is break-even growth, marking the biggest increase on record.

In a rarity, all 18 of the service sectors tracked by ISM said they grew in November. The biggest problem is supplying all the services that customers want. Companies can’t find enough people to fill a near-record number of open jobs. They’ve also struggled to obtain badly needed supplies.

“It goes back to the pent-up demand,” said Anthony Nieves, Chair of the Institute for Supply Management® Services Business Survey Committee. “You can look at other tangible things such as mall traffic and online distribution increasing, which are contributing factors to business activity being up. Many people are going back to work, and consumer confidence is up.”

And if the newest Omicron variant proves less deadly, as initial test results are showing, then there’s nothing to hold back consumers and businesses from building America back better than ever.

Harlan Green © 2021

Follow Harlan Green on Twitter: https://twitter.com/HarlanGreen


Friday, December 3, 2021

We are Nearing Full Employment

 Popular Economics Weekly

Calculated Risk

Are we nearing full employment, at least among of those that want to return to work? That may be a strange question to ask when the just-arrived Omicron COVID variant is creating more uncertainty about future US job growth.

But the latest unemployment surveys out today showed that the unemployment rate dropped to 4.2 percent from 4.6 percent, and 537,000 more workers joined the labor force.

I like the Calculated Risk graph above that portrays where we are in the job recovery from 2020 peak employment (red line). We are fast approaching what was full employment then, as opposed to the slow job recovery from the 2007 Great Recession (blue line).

However, just 210,000 new payroll jobs were added to payrolls in the separate Establishment survey, which is seasonally adjusted, and means 210,000 more jobs were created above what is normal for this time of year.

“Total nonfarm payroll employment rose by 210,000 in November, and the unemployment rate fell by 0.4 percentage point to 4.2 percent, the U.S. Bureau of Labor Statistics reported today. Notable job gains occurred in professional and business services, transportation and warehousing, construction, and manufacturing. Employment in retail trade declined over the month.”

But the change in total nonfarm payroll employment for September was revised up by 67,000, from +312,000 to +379,000, and the change for October was revised up by 15,000, from +531,000 to +546,000, so employment in September and October combined is 82,000 higher than previously reported.

We are nearing full employment because most of the job increase was in leisure and hospitality, which had lagged job creation in the durable goods sector earlier in the recovery.

The leisure and hospitality sector gained 23,000 jobs in November. In March and April of 2020, leisure and hospitality lost 8.22 million jobs, and are now down 1.33 million jobs since February 2020. It has now added back about 84 percent of the jobs lost in March and April 2020, says BLS.

MarketWatch

Construction employment increased 31,000, and manufacturing also added 31,000 jobs. State and Local education lost 16,000 jobs, seasonally adjusted, which was a major reason fewer Establishment survey jobs were created.

Nonfarm employment has increased by 18.5 million since April 2020 but is down by 3.9 million, or 2.6 percent, from its pre-pandemic level in February 2020.

So which of the two Labor Department’s surveys—the Establishment vs. the Household surveys—is the most accurate picture of U.S. employment? The Household survey also showed a much larger 1.14 million people found work in November, though it is a smaller survey than the Establishment survey and isn’t seasonally adjusted.

The Labor Department also reported that In November, 3.6 million persons had been unable to work because their employer closed or lost business due to the pandemic--that is, they did not work at all or worked fewer hours at some point in the four weeks preceding the survey due to the pandemic.

So COVID-19 is still putting a big dent in the employment picture, and we must now wait to see what happens this winter with new variants, and whether the COVID-19 pandemic is tamed.

Harlan Green © 2021

Follow Harlan Green on Twitter: https://twitter.com/HarlanGreen

Wednesday, December 1, 2021

Americans are Returning to Work

 Financial FAQs

FREDselfemployed 

Why aren’t more Americans returning to their old jobs? Many are becoming self-employed, thanks to the pandemic that encourages more work from home, and the Internet with its many marketing opportunities.

The Wall Street Journal reports that 10.2 million workers in October, seasonally adjusted, have become self-employed.

“That is the highest total since the financial-crisis year 2008, except for this summer. The total amounts to an increase of 6% in the self-employed, while the overall U.S. employment total remains nearly 3% lower than before the pandemic,” says WSJ.

So maybe the problem isn’t so much that many Americans are retiring, or holding out for better jobs, but many are finding different career paths. More than 50 percent of Millennials aged 18-22, for instance, have begun their careers self-employed, according to Upwork, Inc.

The use of remote freelancing has also dramatically increased because of the pandemic and will continue to rise in the future, says Upwork. The change to fully remote workforces has led to changes across organizations, far beyond where their workforce is located.

In fact, 67 percent of businesses reported that there were more changes to long-term management practices than a normal year, excluding temporary pandemic-led changes.

"Remote work has become, what economists call, a general-purpose technology," says Upwork Chief Economist Adam Ozimek. "It has a wide range of uses that is embraced across the economy and creates a variety of spillover effects and we are already seeing the signs of these effects. The embrace of a more fully remote workforce has enabled businesses to embrace new technology, reimagine how they onboard and train, and even allowed hiring managers to embrace the use of freelancers."

FRED

And today’s ADP payroll report said private sector employment increased by 534,000 jobs from October to November according to the November ADP® National Employment ReportTM.

This could be a predictor of the official Labor Department report on nonfarm payrolls out this Friday. The above graph show there hasn’t been much variance between the ADP and BLS government reports. If Friday’s BLS report is similar, it is more good news for the recovery.

“The labor market recovery continued to power through its challenges last month,” said Nela Richardson, chief economist, ADP. “November’s job gains bring the three-month average to 543,000 monthly jobs added, a modest uptick from the job pace earlier this year. Job gains have eclipsed 15 million since the recovery began, though 5 million jobs short of pre-pandemic levels. Service providers, which are more vulnerable to the pandemic, have dominated job gains this year. It’s too early to tell if the Omicron variant could potentially slow the jobs recovery in coming months.”

All-in-all, contrary to the pundits that are predicting another downturn because of rising inflation (or the latest Omicron variant), more American workers are returning to work, either as employees or self-employed.

And supply chains are easing, according to various reports, with anchored shipping waiting to offload to the LA and Long Beach ports down more than 20 percent in just the last week, according to the White House, which will ease supply-chain and inflation worries as well.

Harlan Green © 2021

Follow Harlan Green on Twitter: https://twitter.com/HarlanGreen

Tuesday, November 23, 2021

Does America Care Again?

 Financial FAQs

PEW Research

The American Rescue Plan, The Infrastructure Investment and Jobs Act, and the soon to pass Build Back Better Plan show that the American ‘can do’ spirit is alive, the innate generosity and optimism that is so much a part of the American spirit is returning.

Will a revival of that spirit last, in spite of the ongoing pandemic, red vs. blue state civil war, and still record joblessness?

The truest expressions of Americans’ character have come out during past catastrophes, such as the Great Depression and World War Two. And almost 10 years of unparalleled growth followed the horrors of World War One and the 1918 Spanish Flu pandemic. 

The coronavirus pandemic is bringing about a similar transformation of character and culture that was always there but sometimes hidden when times were good.

And record economic growth is following the coronavirus pandemic, with Q1 and Q2 2021 GDP up more than 6 percent, and the fourth quarter possibly growing at the same pace after the third quarter pause due to the Delta variant surge.

Americans are showing that they care for each other with these bills—that lifting children and the poorest out of poverty also lifts themselves. That renewing our roads, bridges, energy grids; and confronting the greatest threat to our future, climate change, will ensure a country that our children can be proud of and prosper in.

It’s obvious that the American Rescue Plan saved many lives and livelihoods, and the Infrastructure bill means caring for the planet as well as each other with its $billions spent on climate change and improving health and sanitation.

It’s less obvious what spending on social infrastructure does. Investing in children, improved healthcare, and paid family leave strengthens families, something both political parties should be for, but conservatives have opposed since FDR’s New Deal.

Who will get most of the good jobs in construction from rebuilding our physical infrastructure? Some 80 percent go to less-then-college-educated workers, says the White House in its initial announcement of the Infrastructure Investment and Jobs Act.

In part because of the recovery money already distributed during the pandemic, median household income has resumed its climb for the first time since 2000, as shown in the above PEW research graph. It had dropped from $70,800 in 2000 to $65,100 after the Great Recession.

In 2018, the median income of U.S. households stood at $74,600. This was 49 percent higher than its level in 1970, when the median income was $50,200. (Incomes are expressed in 2018 dollars.)

The pandemic is bringing about a whole transformation of America that will last because it is bringing Americans together again in common cause, and history shows this brings out the best in us.

Harlan Green © 2021

Follow Harlan Green on Twitter: https://twitter.com/HarlanGreen

Thursday, November 18, 2021

Why are So Many Quitting?

Popular Economics Weekly

Calculated Risk

Several headlines last Friday screamed 4.4 Million Workers Quit Their Jobs, as if that was the most important takeaway from the Labor Department’s October JOLTS report.

But there were also 6.5 million hires (dark blue line in graph) and 10.4 million mostly voluntary separations (yellow line).

In fact, many of those quitting were shifting to better jobs, not leaving the workforce. Quits were up 34 percent year-over-year to a new record high. These are voluntary separations that generally mean they are finding better jobs. (see light blue columns for "quits").

Another indication job formation is heading in the right direction is that 4th Quarter GDP growth predictions are between 6 to 8 percent, as we continue to recover from the pandemic, up from the Q3 growth slowdown to 2 percent. 

This is huge and predicates many more job hires as producers race to stock their shelves in the face of shortages. They had better stock up soon, as consumers are buying like never before. Retail and trade sales surged 1.7 percent last month, the government said, and are up 16.3 percent YoY.

That’s the biggest gain since the government last doled out billions of dollars in stimulus money to families with the American Rescue Plan in March that kept many families and businesses solvent. It delivered $1400 to millions of American families, extended enhanced unemployment benefits and boosted funding to ramp up vaccine distribution and reopen schools.

Retail sales rose 4 percent last month at internet retailers, 3.8 percent at electronics and appliance stores and 2.2 percent at department stores to lead the way in October, all strong numbers. Sales also climbed 1.8 percent at auto dealers, but partly because of record prices. Automakers can’t make enough cars to satisfy demand due to a global parts shortage.

If autos and gas are set aside, U.S. retail sales rose a smaller 1.4 percent last month. Those two categories often exaggerate ups and downs in consumer spending and aren’t always good indicators of how much households are willing to spend.

Nor is it a reliable indicator of inflation, as retail sales are not inflation-adjusted. Consumers are pushing up prices because they have so much money to spend, and the supply bottlenecks won’t subside until next year; after the holidays when consumers traditionally become stingier and demand diminishes. 

Inflation is actually a good sign at the moment, because we like to spend during good times and scrimp during a recession, or the expectation of one. So now isn’t the time to fret about inflation. 

CDCCovidTracker

Another pandemic surge is much more worrisome, as infection rates are declining more slowly at the start of cold weather when Americans go indoors, which is a real reason to worry about what may happen next year.

“The current 7-day moving average of daily new cases (70,431) decreased 1.4% compared with the previous 7-day moving average (71,450). A total of 46,180,190 COVID-19 cases have been reported as of November 3, 2021.”

So the best holiday wish for this week is that we all stay as healthy and wealthy as possible!

Harlan Green © 2021

Follow Harlan Green on Twitter: https://twitter.com/HarlanGreen


Monday, November 15, 2021

Where are the Truck Drivers?

 Financial FAQs

@PaulKrugman

If one picture can save 1,000 words, then maybe Nobel Laureate Paul Krugman’s citing of the huge decline in average hourly wages of Production and Non-supervisory Employees in Transportation and Warehousing since the 1970s goes a long way to explaining the current supply-chain bottleneck and concurrent inflation surge.

It explains even more—why so many Americans are refusing to return to their workplaces. The COVID pandemic has exposed the consequences of the overall decline in working Americans’ wages and standard of living that has shrunk the middle class and endangered our democracy.

Of course, the coincidence of declining wages and truck-driver shortages doesn’t necessarily spell causation, but at a time of soaring demand by consumers and producers for the products they deliver, they have one of the most demanding 24/7 jobs for less than college-educated workers.

And there is much anecdotal evidence from independent truckers that confirms the existing pay scale is not worth it. In October, the American Trucking Association said the U.S. needed 80,000 more truck drivers.

Shauntai Robinson, an owner operator out of the ports in South Carolina, in a post on Medium cited by Yahoo News, said that after 16 years in the industry, she was beginning to question the viability of a career as a truck driver.

"There are thousands of valid class A CDL holders, across the United States, who have elected to not drive a truck anymore," Robinson wrote. "These people have not relinquished their credentials. Instead, these valuable people have been forced to seek alternative forms of employment in order to be able to provide for their families."

On average, truck drivers working full time, year-round, earn about $43,252 annually, lower than the median for all full-time workers ($47,016), but exceed those of other blue-collar jobs, says the US Census Bureau.

FREDwages

The huge decline in transportation and warehousing wages actually mirrors the sharp decline in average hourly wages of all production and non-supervisory workers that began in 1980, as can be seen from the above FRED graph (gray bars are recessions).

That was when Big Business began its lobbying campaign to influence economic policies—morphing into what came to be known as trickle-down economic policies with the election of President Ronald Reagan in 1980.

Reaganomics accelerated the deregulation of whole industries that began in the 1970s, with directly suppressing the collective bargaining rights of workers to such an extent that there are now 26 so-called right-to-work (red) states that say a worker can work in a company employing unionized workers, and enjoying its benefits, without having to pay union dues!

The millions of workers holding back from reentering the workforce because of the worst pandemic in 100 years has perhaps awakened more than truck drivers to the need to hold out for a better economic system that has impoverished them since the 1980s, when conservative economic policies took away workers’ rights as well as drastically reduced their incomes.

President Biden’s $1.2 trillion Infrastructure Investment and Jobs Act (IIJA) was passed just in time to make a difference for working families by providing jobs that can support families.

“The bill is a significant down payment on the $2.5 trillion infrastructure investment gap that was identified in the 2021 Report Card and will benefit American businesses and families for years to come,” according to the American Society of Civil Engineers (ASCE), as I reported last week.

The COVID pandemic is bringing about a wholesale transformation of American capitalism, including an opportunity for American workers to have a voice in transforming it.

Harlan Green © 2021

Follow Harlan Green on Twitter: https://twitter.com/HarlanGreen

Wednesday, November 10, 2021

"It's the COVID Pandemic, Stupid!"

Financial FAQs

FREDcpi

Why the supply-chain bottlenecks and soaring inflation? “It’s the pandemic, stupid.” economists and industry leaders are saying.

President Biden’s $1.2 trillion Infrastructure Investment and Jobs Act (IIJA) was passed just in time to slow the inflation climb and make for a merrier Christmas.

Consumers and producers are worried because the consumer price index jumped 0.9% last month, the government said Wednesday. The pace of inflation over the past year marched to 6.2% in October from 5.4% in the prior month. That’s triple the Federal Reserve’s 2% target and is the highest rate since November 1990.

But even the latest price spike following last year’s pandemic-induced recession was barely higher than that following the 2007-9 recession (gray bar), per the above FRED graph of CPI inflation rates.

Economists such as Obama’s chief economic advisor, Austin Goolsby, are saying this is a one-of-a-kind slowdown caused by the pandemic. “The most important thing to watch if you want to understand the economy is, as has been the case for a year and a half now, the progress made against the virus,” said Goolsby in a recent NYTimes Op-ed.

Why will the new infrastructure bill create a merrier holiday season? Because it jump-starts a renewal of public investment in America’s future with the largest spending programs since Roosevelt’s New Deal.

The bill provides $110 billion to repair the nation's aging highways, bridges and roads. According to the White House, 173,000 total miles of America's highways and major roads and 45,000 bridges are in poor condition. And the almost $40 billion for bridges is the single largest dedicated bridge investment since the construction of the interstate highway system, according to the Biden administration.

“The bill is a significant down payment on the $2.5 trillion infrastructure investment gap that was identified in the 2021 Report Card and will benefit American businesses and families for years to come,” says the American Society of Civil Engineers (ASCE).

“The bill represents a historic, once-in-a-generation investment in our roads, bridges, water and wastewater networks, ports, electric grid, dams, and more. It increases funding, makes smart improvements to policy such as streamlining permitting, and it creates new programs targeted at almost all 17 categories in the 2021 Report Card for America’s Infrastructure, according to the ASCE.

Specifically, the IIJA includes a reauthorization of our surface transportation programs, the Drinking Water and Wastewater Infrastructure Act, as well as an additional $559 billion in new spending that is a combination of targeted funds for overdue state of good repair projects, but also forward-looking programs and policy to make our infrastructure more resilient, said ASCE.

These funds include:

  • $110 billion for roads, bridges, and major projects;
  • $66 billion for passenger and freight rail;
  • $65 billion for broadband internet;
  • $46 billion for resilience to help states and cities prepare for droughts, wildfires, climate change, and more;
  • $39 billion for public transit; and
  • $17 billion for ports and waterways.

This is just a down payment on what needs to be done to bring the American economy into the 21st century, according to the Federal Reserve Chair Janet Yellen: “We are now engaged in the most important economic project in recent history: Repairing the broken foundations of our economy, and on top of them, building something stronger and fairer than what came before.”

Consumers will continue to worry about inflation as much as the pandemic in the coming months. But the inflation rate is tied to the infection rate. How? Supply-chain shortages are causing the price hikes. And when millions more return to work (such as truck drivers) once the pandemic subsides sufficiently, this should in turn loosen the supply-chain constrictions, bringing down prices.

So, instead of saying, “It’s the economy, stupid.” we can say, “It’s the pandemic, stupid” that’s holding up the recovery.

Harlan Green © 2021

Follow Harlan Green on Twitter: https://twitter.com/HarlanGreen


Friday, November 5, 2021

October Employment Roars Back

 Popular Economics Weekly

MarketWatch

Who said the labor shortage is holding back job gains? Not for the moment. It looks like the roaring 2020s are beginning to roar in earnest this fall as we slowly exit the pandemic.

Total nonfarm payroll employment rose by 531,000 in October, and the unemployment rate edged down by 0.2 percentage point to 4.6 percent, the U.S. Bureau of Labor Statistics reported today.

“Job growth was widespread, with notable job gains in leisure and hospitality, in professional and business services, in manufacturing, and in transportation and warehousing. Employment in public education declined over the month.”

People are returning to work, in part because 9 million lost jobless benefits in September as the federal extended unemployment insurance program was terminated.

The government revised the number of new jobs created in September to 312,000 from 194,000, based on new information from the businesses surveyed, said MarketWatch. And the job gains in August were raised to 483,000 from 366,000.

A total of 5.6 million payroll jobs have been created this year to date and average hourly wages have increased 4.6 percent. President Biden touted that these numbers showed that the U.S. now had the fastest job growth in the developed world.

Leisure and Hospitality, Education & Health, and Professional/Business added 320,000 jobs, manufacturing and construction added 104,000 jobs, while governments lost 73,000 jobs (from a loss in public education).

The service sector is roaring back, in other words, as restaurants, hotels, theaters and other companies in the hospitality business created 164,000 new jobs last month.

The jump in payroll employment was presaged by a recent poll of senior business executives in service-oriented companies, such as retailers and banks that rebounded to a three-month high of 58.2 from 54.9 in September, IHS Markit said Friday.

A similar survey of manufacturing activity slipped to 59.2 from 60.7, but it was still quite high. Any reading over 50 signals growth and numbers are above 55 are exceptional.

CDC.gov

Another reason for the payroll surge is the COVID infection rate continues to decline. This is in part because 70 percent of Americans have been fully vaccinated, a total of 193 million Americans

“The current 7-day moving average of daily new cases (68,793) decreased 7.4% compared with the previous 7-day moving average (74,290). A total of 45,655,635 COVID-19 cases have been reported as of October 27, 2021,” reported the CDC.

And there is reason to believe even more workers will return to their jobs this fall and winter—especially moms as their children return to schools and become vaccinated with the new children’s’ vaccines.

What could dim this optimistic prediction? Very little, in my opinion. The euro area is also roaring back with an annual growth rate of 9 percent last quarter, according to Nobel Laureate Paul Krugman.

And the rest of the world is slowly recovering from the pandemic. It’s really a matter of continuing to vaccinate the unvaccinated worldwide, which means restoring the supply-chains in this deeply interconnected world.

Is there anything that could prevent it from being restored? Maybe another war with…? Let’s hope not.

Harlan Green © 2021

Follow Harlan Green on Twitter: https://twitter.com/HarlanGreen

Thursday, November 4, 2021

Manufacturing, Service Sector Growth Prolong Recovery

 Financial FAQs

 FREDmanufacturing

U.S. manufacturing and service sector activity continued to climb, despite the price hikes and supply bottlenecks. And we are just at the beginning of the holiday shopping season. Both economic sectors per the ISM supply managers’ indexes show a continuing red-hot demand for goods and services.

Inflation worriers can worry less, as production speeds up. Manufacturing output alone is up 14.8 percent in the second quarter YoY (see FRED graph), reducing price pressures. Eventually resolving supply-chain issues of clogged ports and container shipments will cause supplies to catch up to the demand for goods.

Timothy R. Fiore, ISM Manufacturing Chair, said “Business Survey Committee panelists reported that their companies and suppliers continue to deal with an unprecedented number of hurdles to meet increasing demand. All segments of the manufacturing economy are impacted by record-long raw materials lead times, continued shortages of critical materials, rising commodities prices and difficulties in transporting products. Global pandemic-related issues — worker absenteeism, short-term shutdowns due to parts shortages, difficulties in filling open positions and overseas supply chain problems — continue to limit manufacturing growth potential.”

The ISM services index measuring economic activity in industries such as Retail Trade; Transportation & Warehousing; Real Estate, Rental & Leasing; Arts, Entertainment & Recreation; jumped to an all-time high of nearly 67 in October, the Institute for Supply Management said Wednesday. The Business Activity and New Orders indexes reached 69.8 percent.

This tells us again that retail sales making up some 50 percent of consumer spending will continue strong in the holiday shopping season.

“In October, strong growth continued for the services sector, which has expanded for all but two of the last 141 months,” said ISM chair Anthony Nieves in a statement. “However, ongoing challenges — including supply chain disruptions and shortages of labor and materials — are constraining capacity and impacting overall business conditions.”

Though the huge obstacles to supply are causing some uncertainty, any figure above the 50 percent ISM survey breakeven point shows expansion. This is a sign that businesses are just beginning the replacement cycle of plants and equipment, rather than any imminent slowdown of activity caused by the bottlenecks and labor shortages.

As a side note, the number of Americans who applied for unemployment benefits in late October fell to yet another pandemic low in the latest week, reflecting an urgent need by companies to hold onto to current employees and find new ones. New jobless benefit claims dropped by 14,000 to 269,000 in the seven days ended Oct. 30, the government said Thursday.

Some five million have not returned to work that were employed before the pandemic and there are 10 million job openings, so it’s not yet possible to know when and if the current labor shortage will continue to put a drag on growth.

But, in a way, this might cool demand enough that economic growth doesn’t overheat and bring on another asset bubble, and maybe tame the inflation tiger as well.

Harlan Green © 2021

Follow Harlan Green on Twitter: https://twitter.com/HarlanGreen

Thursday, October 28, 2021

Home Prices Keep Rising

The Mortgage Corner

Calculated Risk

I said last month the housing market was cooling with the fall weather, but maybe not yet. Because housing prices are still rising in double digits, although they may be leveling off.

The S&P CoreLogic Case-Shiller U.S. National Home Price NSA Index of single-family, same-home price changes, covering all nine U.S. census divisions, reported a 19.8 percent annual gain in August, remaining the same as the previous month. It’s a 3-month average for 20 metropolitan areas, so in some cities’ prices are rising even faster.

Phoenix led the way with a 33.3 percent year-over-year price increase, followed by San Diego with a 26.2 percent increase and Tampa with a 25.9 percent increase. Eight of the 20 cities reported higher price increases in the year ending August 2021 versus the year ending July 2021.

How about that for some irrational exuberance in the housing market? Are we seeing a repeat of the housing bubble, when prices rose double-digits in the early 2000s and again in 2014 (see above graph)?

I don’t think so. While Fed Chair Greenspan was pushing interest rates close to zero then to finance GW’s wars on terror, credit conditions today are much tighter and lenders no longer offer so-called liar loans that hid the real interest rate.

It’s not good news for those having difficulty in finding affordable housing, given the low for-sale inventory. But interest rates still remain at record lows, with 30-year conforming and super-conforming fixed rates around 3.0 percent.

Will housing prices eventually stabilize? Only when enough residences are built to satisfy the pent-up demand that came from a steep drop in new housing construction since the end of the Great Recession.

The Commerce Department said sales of new single-family homes surged 14.0 percent to a seasonally adjusted annual rate of 800,000 units in September, so there’s some hope for increasing supply. But sales were as high as 1,400,000 per year during the height of the housing bubble.

Unfortunately, Calculated Risk reports that just 36,000 new homes were available for sale in September, while106,000 new homes have yet to be completed. That leaves a 0.5- month inventory, close to a record low, when 3 to 4 months was the norm.

Calculated Risk

Existing-home sales also rebounded in September after seeing sales wane the previous month, according to the National Association of Realtors®. Each of the four major U.S. regions witnessed increases on a month-over-month basis.

The NAR reported total existing-home sales,1 https://www.nar.realtor/existing-home-sales, completed transactions that include single-family homes, townhomes, condominiums and co-ops, rose 7.0 percent from August to a seasonally adjusted annual rate of 6.29 million in September. However, sales decreased 2.3 percent from a year ago (6.44 million in September 2020).

"Some improvement in supply during prior months helped nudge up sales in September," said Lawrence Yun, NAR's chief economist. "Housing demand remains strong as buyers likely want to secure a home before mortgage rates increase even further next year."

“The housing sector is clearly settling down,” said Yun, who described the surge of home buying in late 2020 and early 2021 as an anomaly.

Home sales last peaked in 2020 at the beginning of the pandemic, but inventories are now at historic lows. Housing prices began their current steep climb at the same time. Unless builders and governments find ways to build more affordable housing, the housing shortage could continue for years and leave a whole generation wanting a home.

Harlan Green © 2021

Follow Harlan Green on Twitter: https://twitter.com/HarlanGreen


Monday, October 25, 2021

No Real Slowdown in US Recovery

 Popular Economics Weekly

FREDgdpgrowth

The latest survey of US growth shows little diminishment of economic activity in the near future. A survey of senior business executives in service-oriented companies, such as retailers and banks, rebounded to a three-month high of 58.2 from 54.9 in September, IHS Markit said Friday.

A similar survey of manufacturing activity slipped to 59.2 from 60.7, but it was still quite high. Any reading over 50 signals growth and numbers are above 55 are exceptional.

So now pundits and some economists worry about overheating and a prolonged inflation cycle that might short circuit long term growth prospects. But consumers are sensing the danger and acting rationally without the need for the Federal Reserve to raise interest rates prematurely; at least according to recent sentiment surveys.

“U.S. private sector businesses recorded a sharp and accelerated upturn in output led by the service sector during October, with growth the strongest for three months, albeit still much weaker than seen earlier in the year,” said IHS Markit’s press release.

GDP grew,+16.75 percent year-over-year in the second quarter 2021. It had declined -8 percent in Q2 2020 from its pre-pandemic high such was the impact of the pandemic lockdowns.

We have seen nothing like this GDP recovery since 1980; the recovery from the decade of the Arab Oil Embargo; or the 1950s recovery from World War Two, as shown in the above graph.

What does such growth mean for American consumers and businesses? Firstly, it means rising wages and benefits for employees. There are currently two million more job vacancies than workers looking for work because the demand for goods and service has grown so quickly since last summer and the decline in infection rates.

Secondly, it should mean a continued high level of growth for several years as businesses ramp up capital expenditures for a rebuild of the American economy transformed by the pandemic.

Am I being rash in predicting such growth? I don’t think so, since all US economic sectors are not only playing catch up because of the pandemic, but they see good prospects for years to come.

The worry about ongoing labor shortages and supply bottlenecks is actually helping to cool down the red-hot demand that is causing the current inflation surge, thus tempering price increases that would put a break on sustained growth.

Conference Board

Hence the recent decline in consumer confidence.

“Consumer confidence dropped in September as the spread of the Delta variant continued to dampen optimism,” said Lynn Franco, Senior Director of Economic Indicators at The Conference Board. “Concerns about the state of the economy and short-term growth prospects deepened, while spending intentions for homes, autos, and major appliances all retreated again.”

This is while actual retail sales are up a huge 12 percent in a year, and home prices are rising in double digits annually. It might be a good thing if consumers retreat slightly, as an antidote to the irrational exuberance that is currently infecting the financial and real estate markets.

Fed Chair Janet Yellen just reported that she sees inflation returning to a more normal level next year.

When asked by CNN’s Jake Tapper when inflation would fall back to around the 2 percent, longer-term target area, Yellen said: “Well, I expect that to happen next year …  On a 12-month basis, the inflation rate will remain high into next year because of what’s already happened. But I expect improvement … by the middle to end of next year, second half of next year.”

Consumers are in fact acting rationally if they pause and allow the markets to cool down. By preventing prolonged overheating (and possible asset bubbles forming), it will prolong this growth cycle.

Harlan Green © 2021

Follow Harlan Green on Twitter: https://twitter.com/HarlanGreen

Wednesday, October 20, 2021

Booming Retail Sales Confirm Holiday Rally

 Financial FAQs


FRED

September retail sales and food services presage a holiday season worth celebrating, despite supply shortages, worker shortages, and the pandemic. Seasonally adjusted retail sales are up 12 percent over last September, which means that the demand for goods and some services is at a historic high.

So the shortages are due to consumers and businesses buying more than ever, more than last year and all the years before, in spite of the supply shortages.

There’s little evidence of production shortages, per se, as much as a slowdown in getting to their destinations in ports such as Los Angeles and Long Beach, where more than half of all imports to the U.S. arrive.

NY Times Paul Krugman put up a FRED graph that illustrates the huge surge in the demand for durable goods—goods like appliances and vehicles that last more than three years. It tells us that said demand can continue above the average dotted trend line into the year end holidays.

FRED

The demand for services such as leisure activities and travel is lagging because the pandemic has kept many consumers at home. But that will pick up as well once the Pandemic is subdued.

And what if the Infrastructure and Build Back Better bills pass would add additional $ trillions to programs that boost businesses and improve consumers’ lives? Then the boost in demand for goods and services could be prolonged for…years.

Should we worry about inflation because too much money is in circulation, driving up prices? Not if it’s put to productive uses, as I’ve been saying. Both physical and so-called social infrastructure spending go into increasing productivity, hence a greater supply of goods and services, not excessive speculation in the financial markets as have past tax cuts from which the wealthiest most benefited.

Studies have shown that parents in such states as California that have some of the social infrastructure proposals in President Biden’s Build Back Better Act, such as paid family leave and child care, allow them more family time and resources to raise their children, thus reducing the number of children trapped in a cycle of poverty.

And better physical infrastructure will help to cure the supply bottlenecks. “In the longer run, investments in infrastructure could help much more: U.S. ports, rail lines and so on are shabby compared with their counterparts in other countries and could be much improved.” says Krugman.

So we really need to grow what one political scientist has termed our social capital as much as physical infrastructure, if we want a sustainable recovery. It can be done by improving people’s lives.

Harlan Green © 2021

Follow Harlan Green on Twitter: https://twitter.com/HarlanGreen

Friday, October 15, 2021

JOLTS Report Confirms Strong Job Market

 Financial FAQs

Calculated Risk

Job openings are plentiful as ever in the Labor Department’s Job Openings and Labor Turnover Survey (JOLTS) report for September. It gives the best picture of job growth, better than last Friday’s punk unemployment report (with just 194,000 new nonfarm payroll jobs), because it reports actual numbers rather than seasonally adjusted figures reporting changes that deviate from a typical month.

There were 10.5 million job openings (yellow line) in September, and employers are begging for workers because they see a rising demand for goods and services.

There were actually 6.3 million new hires, and 6 million separations, which means workers are leaving their current job in droves to find a better job. The so-called (voluntary) Quits rate, for instance, is up 43 percent YoY, an all time high.

The Calculated Risk graph shows that there was a slight drop in job openings and Hires, but because Quits and Layoffs are increasing (light blue and red bars), it’s a sign of an improving jobs market, says the BLS:

“Total separations includes quits, layoffs and discharges, and other separations. Quits are generally voluntary separations initiated by the employee. Therefore, the quits rate can serve as a measure of workers’ willingness or ability to leave jobs.”

Much has been written about workers not returning to work, but that number is slowly declining as the vaccine mandates kick in that have brought down the infection rate.

As evidence, weekly jobless benefit claims sank to a new pandemic low and fell below 300,000 for the first time in a year and a half, amid a frantic effort by companies to hire more workers. New jobless claims sank by 36,000 to 293,000 in the seven days ended Oct. 9 from a revised 329,000 in the prior week, the government said Thursday.

Calculated Risk cites yesterday’s CDC report on the decline in infection rates: “…14 states and D.C. have achieved 60% of total population fully vaccinated: Connecticut at 69.6%, Maine, Rhode Island, Massachusetts, New Jersey, Maryland, New York, New Mexico, New Hampshire, Washington, Oregon, Virginia, District of Columbia,  Colorado, and California at 60.0%.”

Inflation has peaked at the moment with the Consumer Price Index above 5%, but U.S. wholesale prices rose in September at the slowest pace in ninth months, which means the supply-chain slowdown that has caused the spike in raw materials could be easing.

This reinforces my belief that we are about to enter a decade of very good growth with plenty of good, available jobs.

Some say that there could be a temporary slowdown if the Democrats can’t get their act together over the twin infrastructure and build back better social bills, or even a longer-term debt ceiling agreement past December.

But that’s hard to believe when it means so much for the party and our country; whatever the final dollar cost.

Harlan Green © 2021

Follow Harlan Green on Twitter: https://twitter.com/HarlanGreen

Monday, October 11, 2021

Why Weak Jobs Report?

 Popular Economics Weekly

NPR.org

Is hiring cooling off with the cooler weather? We really don’t know, in spite of the punk employment number. Economists don’t agree on why employers added just 194,000 jobs in September, according to the Labor Department’s unemployment report. There is too much mystery in the jobs number.

The NY times’ Ben Casselman posits, “The pandemic’s resurgence delayed office reopenings, disrupted the start of the school year and made some people reluctant to accept jobs requiring face-to-face interaction. At the same time, preliminary evidence suggests that the cutoff in unemployment benefits has done little to push people back to work.”

Also, figures are seasonally adjusted, which means that although government payrolls shrank by -123,000 jobs on an unadjusted basis, mostly in education, federal, state and local government employment actually grew by close to 900,000 workers in September. Because that’s fewer than in a typical September, the seasonal adjustment formula interprets it as a loss in jobs.

Schools are just now re-opening and not yet hiring enough teachers and staff; which has kept more mothers at home; and the Delta variant has cut back on leisure and hospitality services.

And Most people (7 in 8) who lost federal aid in June were not reemployed by early August, according to a paper authored by researchers at Columbia University, Harvard University, the University of Massachusetts Amherst and the University of Toronto last month, cited by CNN.

Census surveys show the number of people who aren't working because they have kids at home has dropped from nearly 8 million in midsummer to about 5 million today.

That's far below the hiring rate earlier in the summer when employers were adding around a million jobs a month, says NPR. And their graph shows we are still five million jobs below the job level at the start of the pandemic in February 2020.

The endurance of the pandemic is still the elephant in the room. A full recovery depends on it being vanquished. The U.S. has been slow to institute vaccine mandates, whereas Canadian federal employees will be required to declare their full vaccination status through an online portal by Oct. 29.

"These travel measures, along with mandatory vaccination for federal employees, are some of the strongest in the world," Canadian Prime Minister Trudeau told reporters recently. "If you've done the right thing and gotten vaccinated, you deserve the freedom to be safe from COVID."

And Canada is back to pre-pandemic employment levels in September, writes David Rosenberg of Rosenberg Research, because 90 percent of eligible Canadians have at least one shot and 82 percent are fully vaccinated.

CDC.gov

The CDC reports the current 7-day moving average of daily new cases (95,448) decreased 11.6 percent compared with the previous 7-day moving average (107,953). A total of 43,997,504 COVID-19 cases have been reported as of October 6, 2021.

The bottom line is that a full jobs recovery and success of President Biden’s Build Back Better agenda now hinge on a full recovery from COVID-19.


Harlan Green © 2021

Follow Harlan Green on Twitter: https://twitter.com/HarlanGreen

Thursday, October 7, 2021

Why Have a Debt Ceiling Debate?

 Financial FAQs

FREDdebtgdp

We might have just been saved from an immediate default on the national debt with all of its consequences. Senate Minority Leader Mitch McConnell late on Wednesday made a new offer to the Democratic-run Senate as lawmakers struggled to end a standoff over the federal borrowing limit.

Republicans will “allow Democrats to use normal procedures to pass an emergency debt limit extension at a fixed dollar amount to cover current spending levels into December,” McConnell, a Kentucky Republican, said in a statement.

But that only kicks the debt ceiling can down the road. Why should there be a congressionally mandated debt ceiling? If the U.S. congress was serious about putting a cap on public spending, then it would require that any new spending be paid for, as has been done in the past.

It is beyond silly to have have a debt ceiling, otherwise. Because the debt incurred is from past spending. But, alas, congress has not been able to agree on an acceptable formula for reinstituting what has been called pay-to-play budget resolutions.

The above FRED graph shows the amount of public debt as a percentage of GDP owed by the federal government is today. The largest growth in U.S. public debt occurred because of the last two recessions (gray columns in graph)—the Great Recession caused by lax regulation of Wall Street lenders that led to the housing bubble, and the COVID-19 pandemic, respectively.

The pandemic recession lasted just two months, and public debt soared mainly because of the $trillions in emergency spending passed by congress during the Trump and Biden administrations that wasn’t paid for. In fact, the Trump administration pushed through massive tax cuts on corporations and lowered the maximum tax rate on personal income in 2017. Some $7.8 trillion was added to the public debt during his term.

Even the current level of public debt ($22.7 trillion) is less of a danger to growth than the debate over raising the debt ceiling.

This is because as Josh Bivens of the Economic Policy Institute points out, and I have discussed in past columns, over the past 25 years debt service payments (required interest payments on debt) shrank almost in half, from 3.0 percent of GDP to 1.8 percent, as the nominal federal debt rose from $5 trillion to $22.7 trillion. And it has averaged 3 percent of GDP, historically.

The main danger to economic growth is that a debt ceiling exists at all. Fed Chairwoman Janet Yellen just warned that the U.S.could fall into a recession if the debt ceiling isn’t raised in congress by October 18.

“It is utterly essential that this be done,” Yellen said, in recent congressional testimony. She called Oct. 18 “the deadline.”

In fact, we are at the beginning of a new growth cycle. Doubts about the direction of growth after the pandemic arise from outdated economic models—models that can be lumped under supply-side, or more derisively, trickle-down economic theories.

Conservative economists tend to be stuck in what has been called the golden years of Reaganomics—or supply-side economics--when stimulating the supply of ever more goods and services by lowering government oversight and reducing taxes was the ticket to prosperity.

But explained simply, having excess aggregate demand, or effective demand, which we have today, stimulates greater growth rather than an excess of supply. And businesses are following that formula with record amounts of private and public investments in capital goods. Total capital expenditures in the second quarter are up 25 percent from a year ago, per the Federal Reserve Bank of St. Louis (FRED).

Lord JM Keynes understood this in the 1930s, which is why he thought it more important to stimulate greater demand with public investments when private investment disappeared during recessions. That was the lesson we learned from the Great Depression.

And it is the lesson we need to carry forward with the current infrastructure legislation winding its tortured way through congress that will stimulate a longer lasting growth cycle.

Then our debt will pay for itself.

Harlan Green © 2021

Follow Harlan Green on Twitter: https://twitter.com/HarlanGreen

Monday, October 4, 2021

U.S. Manufacturing Surging

 Financial FAQs


FREDmanuoutput

Growth in the U.S. manufacturing sector is exploding, according to the Institute for Supply Managers Report on Business. Output is up 17 percent in Q2 2021 YoY (per FRED graph). It is a  sign of good economic growth for the rest of this year, in spite of supply shortages and higher prices for raw materials.

Reporting growth in September were 16 of the 17 manufacturing industries. The top seven — in the following order — were: Furniture & Related Products; Petroleum & Coal Products; Machinery; Electrical Equipment, Appliances & Components; Computer & Electronic Products; and Chemical Products.

“The orders index was unchanged at the prior month’s very high level of 66.7 and the supplier delivery index rebounded by four points to 73.4.  The overall result was a 1.2-point increase to 61.1.  Any number over 50 percent indicates that a majority of those surveyed saw increases, and reaching 60 for any length of time is highly unusual,” according to the ISM survey announcement.

“There have been 15 ISM composite index readings of 60 or more in the past thirty years.  Seven of them have come in the past ten months,” said Reuters. This is in spite of the supply-chain delays and soaring product prices. The ISM Prices Index registered 81.2 percent. In September, 17 of 18 industries reported paying increased prices for raw materials.

Reuters

Even better news is that consumer spending is holding up, which powers some two-thirds of economic activity. This may be because consumers are paying less attention to the pandemic as the infection rate falls and the third Pfizer booster shot becomes available.

This is while Consumer spending grew at a robust 12.0 percent rate in the April-June quarter. The Commerce Department also said construction spending increased 8.9 percent on a year-on-year basis in August. Separately, the University of Michigan's Consumer Sentiment Index rose to a final reading of 72.8 in September from 70.3 in August.

Another sign of robust future growth (as shown in the Reuters graph) is that Disposable income was $2 trillion higher than Personal outlays--$18 billion vs. $16 billion, respectively—which is why the personal savings rate is holding at a high 9.4 percent.

And the NY Times just reported drug maker Merck announced Friday that its pill to treat Covid-19 was shown in a key clinical trial to halve the risk of hospitalization or death when given to high-risk people early in their infections. It probably won’t be available until late next year, however.

The supply-chain delays and healthy consumer pocketbooks show there is a very strong demand for goods and services that should last, even with the ongoing uncertainty over the coronavirus pandemic.

Now let us see what congress will do with the Biden administration proposals for infrastructure and social investments, no matter the final Dollar amount. If passed, I see a very prosperous decade for Americans.

Harlan Green © 2021

Follow Harlan Green on Twitter: https://twitter.com/HarlanGreen

Wednesday, September 29, 2021

What Happened to the Civil War?

 Answering Kennedy’s Call

NPR.org

Removal of the largest Robert E Lee statue from its prominent place in central Richmond, Virginia is a sign of the times.

We are no longer fighting what has been called a ‘cold’ civil war. Not the majority of Americans, anyway. The outcome of California Governor Gavin Newsome’s recall election reaffirmed that our defacto civil war between North and South, red states and blue states, is over by a two-to-one margin.

The LA Times Michael Hiltzick commented on it in a recent column.

“The truth is that America is nothing like a polarized country. Large majorities agree on the most pressing issues of the day: They favor abortion rights, stricter gun controls and more COVID-related restrictions, especially on unvaccinated people. You might not be aware of this if you listen to programs on Fox News or even the average political commentary in our leading newspapers or on CNN.”

California has always given Americans a picture of the future, with the sixth largest economy in the world. Silicon Valley is the most obvious example of our technological future, but California also has one of the best-in-country social welfare programs paid for with higher taxes. That is why California’s latest budget surplus was $76 billion, which it is using to cure its worst-in-the country housing shortage, as well as record poverty levels.

“…depictions of an America wracked by irreconcilable disagreement is daily fare. But they’re not reporting a genuine schism in American politics; they’re reporting on a divide pitting a majority in broad agreement against a boisterous minority,” continues Hiltzick.

So why does this “boisterous minority” still grab headlines? I attribute it to what I have called the Bully Mentality, a state of mind attributed to bullies who want to continue to fight a civil war they have already lost. It is bullying behavior adopted by one political party in recent decades to indoctrinate and intimidate voters—particularly minorities and immigrants—by ‘dumbing down’ their electorate to the real world.

The NY Times put it succinctly in a recent front page article by David Leonhardt that examined the vaccination divide between red and blue states.

“What distinguishes the U.S. (from much of the rest of the world) is a conservative party—the Republican Party—that has grown hostile to science and empirical evident in recent decades.”

Hiltzick attributes this hostility towards facts to President Nixon and Republicans’ switching to culture wars when they began to lose voters. For instance, its anti-abortion stance was an attempt to lure Catholic voters away from Democrats. I remember it happening when many Republicans signed onto Ralph Reeds (Protestant) Christian Coalition, with its denial of evolution and replacement with creationism theories and a literal reading of the Bible.

So why do conservatives continue to even attempt to keep this un-civil war alive? 

I recently mentioned Kennedy economist John Kenneth Galbraith’s answer, in speaking of France’s Ancien Régime that preceded the French Revolution: “The privileged feel that their privileges, however egregious, they may seem to others, are a solemn, basic, God-given right.”

And we know how that revolution turned out.

Harlan Green © 2021

Follow Harlan Green on Twitter: https://twitter.com/HarlanGreen