Sunday, October 31, 2010

Poverty and Economic Growth Not Compatible

Financial FAQs

The U.S. Census Bureau recently reported one in seven Americans are living in poverty, today -- the highest level since 1994. And that is why this is such a deep recession. Economists agree that economic growth is driven by what they call aggregate demand—the sum of government and private sector spending and investment. And since about 70 percent of economic activity is driven by consumers, less money in their pockets means lower demand, ergo, slower growth.

An estimated 43.6 million Americans in 2009 were living off incomes below the federal poverty line, or around $11,000 for an individual under 65 or $22,000 for a family of four. The total number, an increase of 3.7 million over 2008, is the largest in 51 years, since the government first started tracking poverty data. And that is why we are so slow to recover.

"The deterioration in the labor market from 2008 to 2009 was the worst we've ever seen," said economist Heidi Shierholz of the Economic Policy Institute. "When you see a big deterioration in the labor market, poverty rises. The vast majority of people in this country depend on the labor market for their income."

A loss of medical insurance is a big factor in the rising poverty, which isn’t projected to come down for several years, according to CBPP, The Center for Budget and Policy Priorities. "The number and percentage of Americans without health insurance rose sharply in 2009. The number of uninsured jumped by 4.3 million, to a total of 50.7 million. The percentage of Americans without coverage rose from 15.4 percent to 16.7 percent, which means one of every six Americans was uninsured last year. These are the sharpest year-to-year increases since the Census Bureau began collecting these data in 1987.”

With news from the National Bureau of Economic Research that the Great Recession actually ended in June 2009, those consumers with jobs might improve. The consumer is opening his wallet wider as the pace of retail sales has picked up. Although auto sales led a September gain, strength is broad based. Overall retail sales in September advanced 0.6 percent, following a 0.7 percent gain in August (revised up from 0.4 percent) and a 0.5 percent increase in July (previously 0.3 percent).

clip_image002

The NBER has said there will be no double dip, and that any future downturn will mean a new recession and not continuation of the present one. Two side-by-side recessions haven’t happened since Ronald Reagan’s tenure—in 1981 and 1983, when interest rates were still in the double digits—not the case now.

A consumer sector that is posting moderate gains in spending will likely support continued modest growth in the recovery. It's certainly not gangbusters, but the news is welcome relief for those worried about the economy becoming too sluggish or turning negative again.

And consumer debt may be plummeting to a level that makes them comfortable to spend again. Consumer credit contracted for the sixth month, down $3.6 billion in July. Revolving credit fell $4.4 billion, offset in part by a $0.8 billion rise in nonrevolving credit that got a boost from July's strength in car sales. Yet the secular decline in revolving credit is what's most important, reflecting the fundamental shift in the consumer who, hit by a weak labor market and lack of confidence in the economy, is less able and less inclined to fund discretionary purchases with a credit card.

clip_image004

The key is total debt to household income ratios that the Fed publishes. It has dropped to the Q3 of 2002 level—now 15.93 percent of household income, from 17.64 percent in Q1 of 2008. And in fact absolute household debt has contracted even faster, as household incomes (the denominator of equation) have been declining as well.

Another sign of increased hiring, is that initial claims for unemployment insurance are now down to 434,000, as of October 23, the lowest total since July. The four-week average posted its sharpest decrease of the year, down 39,000 to a 445,000, while continuing claims for the October 16 week fell 122,000 to a two-year low of 4.356 million. This comparison points to strength for monthly payrolls.

clip_image006

That, and other indicators show a tremendous pent-up demand for skilled workers is developing. For example, the international accounting firm Deloitte-Touche just announced they will be hiring 50,000 new employees per year over the next five years. With 169,000 people in over 140 countries, Deloitte member firms already serve more than 80 percent of the world's largest companies as well as large national enterprises, public institutions and successful fast-growing companies, says its website.

Much of consumer behavior is controlled by their feelings—consumer confidence, in a world where the future is becoming harder to predict. And with poverty levels so high due to the slack labor market, those feelings are mainly determined by what consumers see as their job prospects.

So we can only hope that initial jobless claims continue to drop, which can only help those record numbers having to live at the poverty level. Only more emphasis on job creation can bring those improvements.

Harlan Green © 2010

Friday, October 29, 2010

Rock Bottom Mortgage Rates Increase Sales

Financial FAQs

It seems that the lowest mortgage rates since the 1950s are making a difference. New-home sales rose 6 percent and existing-home sales increased 10 percent in September, “affirming that a sales recovery has begun”, said the National Association of Realtors. This can mean interest rates have finally come down to levels that match consumers’ diminished incomes—a vindication of the Fed’s efforts to lower interest rates in their fight against deflation.

Housing starts and construction spending are also beginning to rise, which means housing prices are in the affordable range, in line with lower reduced personal incomes.

One measure of housing prices not usually reported is the housing price-to-rent ratio that we have discussed in past columns. It is a good measure because rents are more closely tied to actual incomes—and so what households can actually afford—whereas housing prices can fluctuate wildly based on irrational expectations, as we know. So its ratio is a measure of how much prices rise or fall in relation to rents. Today, that ratio has almost declined to historical levels, indicating that housing prices are bottoming out.

clip_image002

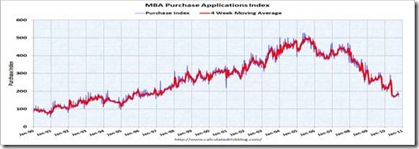
Mortgage purchase applications increased in the latest week, according to the Mortgage Bankers Association, another sign that record low interest rates are spurring purchases. Conforming 30-yr fixed rates are at 4 percent with a 1 point origination fee. The Refinance Index increased 3.0 percent; the seasonally adjusted Purchase Index increased 3.9 percent from one week earlier.

clip_image004

And construction outlays rebounded 0.4 percent, mostly in the public sector, following a revised 1.4 percent decrease in July. The August number was much better than the consensus forecast for a 0.4 percent decrease.

clip_image006

The comeback in August was led by a 2.5 percent boost in public outlays. Meanwhile, private residential spending dipped another 0.3 percent in August, though this number should improve with the uptick in housing starts. On a year-ago basis, overall construction outlays improved to minus 10.0 percent in August from down minus 10.3 percent in July, which means we will probably have to wait until next year’s selling season before construction spending actually turns positive.

clip_image008

Calculated Risk gives us a reason for the decline in construction spending. The tremendous oversupply of existing homes on the market, including bank-owned foreclosures, are depressing prices and undercutting new home sales.

The existing-home overhang increased 8.9 percent in the month, even though months of supply dropped to 11 percent, due to the higher sales rate. “The year-over-year increase in inventory is very bad news because the reported inventory is already historically very high (around 4 million)”, said Calculated Risk, “and the 10.7 months of supply in September is far above normal.”

“Vacant homes and homes where mortgages have not been paid for an extended number of months need to be cleared from the market as quickly as possible, with a new set of buyers helping the recovery along a healthy path,” said NAR chief economist Lawrence Yun. “Inventory remains elevated and continues to favor buyers over sellers. A normal seasonal decline in inventory is expected through the upcoming months.”

clip_image010

And housing affordability conditions today are 60 percentage points higher than during the housing boom, so it has become a very strong buyers’ market, especially for families with long-term plans. “The savings today’s buyers are receiving are not a one-time benefit. Buyers with fixed-rate mortgages will save money every year they are living in their home – this is truly an example of how homeownership builds wealth over the long term,” said NAR President Vicki Cox Golder.

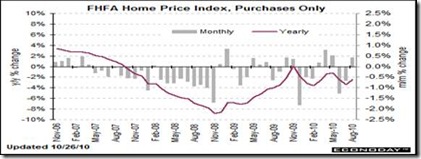
The latest Federal Housing Finance Authority same-home prices for Government agency financed homes—confirm that prices are firming at the lower price levels. The FHFA purchase index actually rose 0.4 percent, after a long string of declines.

clip_image012

The Mortgage Bankers Association asserted that fixed mortgage rates wouldn’t go lower at its annual conference, and in fact predicted they would rise above 5 percent next year, mainly because the MBA sees sales rising—with new-homes sales up 20 percent in 2011 and 40 percent in 2012 to make up for the current lack of new-home inventory.

But this will only happen if the Fed keeps downward pressure on interest rates, such as with their proposed QE2 purchase of more Treasury securities, to keep mortgage rates at such low levels that they conform with consumers’ reduced buying power.

Harlan Green © 2010

Wednesday, October 27, 2010

Real Estate Recovery Beginning

The Mortgage Corner

Both Existing and new-home sales rose again in September, “affirming that a sales recovery has begun”, said the National Association of Realtors. The surge seemed to come from both lower prices, and record-low interest rates. It was welcome news, as it also put a dent in the for sale inventory.

Existing-home sales, which are completed transactions that include single-family, townhomes, condominiums and co-ops, jumped 10.0 percent to a seasonally adjusted annual rate of 4.53 million in September from a downwardly revised 4.12 million in August, but remain 19.1 percent below the 5.60 million-unit pace in September 2009 when first-time buyers were ramping up in advance of the initial deadline for the tax credit last November.

And new home sales for September confirm expectations that the post-stimulus housing sector is now stabilizing. New home sales rose 6.6 percent to a 307,000 annual rate. Yet strength isn't evenly balanced as the month's gain is heavily centered in the Midwest. The Northeast and South do show gains though sales contracted noticeably in the West.

The report's price readings are mixed which is a plus given some indications that prices are contracting, says Econoday. The median price for a new home rose 1.5 percent to $223,800, up an on-year 3.3 percent. The average price, a reading that's sensitive to change at the very high-end of the market, fell 1.2 percent to $257,500 for an 11.3 year-over-year contraction.

clip_image002

NAR chief economist Lawrence Yun said the housing market is in the early stages of recovery. “A housing recovery is taking place but will be choppy at times depending on the duration and impact of a foreclosure moratorium. But the overall direction should be a gradual rising trend in home sales with buyers responding to historically low mortgage interest rates and very favorable affordability conditions,” he said.

The national median existing-home price for all housing types was $171,700 in September, which is 2.4 percent below a year ago. Distressed homes accounted for 35 percent of sales in September compared with 34 percent in August; they were 29 percent in September 2009.

NAR President Vicki Cox Golder said, “A decade ago, mortgage rates were almost double what they are today, and they’re about one-and-a-half percentage points lower than the peak of the housing boom in 2005,” she said. “In addition, home prices are running about 22 percent less than five years ago when they were bid up by the biggest housing rush on record.”

And housing affordability conditions today are 60 percentage points higher than during the housing boom, so it has become a very strong buyers’ market, especially for families with long-term plans. “The savings today’s buyers are receiving are not a one-time benefit. Buyers with fixed-rate mortgages will save money every year they are living in their home – this is truly an example of how homeownership builds wealth over the long term,” Golder added.

A major question mark is the inventory overhang, which increased 8.9 percent in the month, even though months of supply dropped to 11 percent, due to the higher sales rate. “The year-over-year increase in inventory is very bad news because the reported inventory is already historically very high (around 4 million)”, said Calculated Risk, “and the 10.7 months of supply in September is far above normal.”

“Vacant homes and homes where mortgages have not been paid for an extended number of months need to be cleared from the market as quickly as possible, with a new set of buyers helping the recovery along a healthy path,” Yun said. “Inventory remains elevated and continues to favor buyers over sellers. A normal seasonal decline in inventory is expected through the upcoming months.”

clip_image004

That may be so, but since the percentage total of distressed home sales has been stable, it could very well be that banks are working through their foreclosure inventory more quickly, which is good news. In fact, there is now a shortage of under $500,000 homes on the market in higher-priced areas.

The latest Federal Housing Finance Authority same-home prices for Government agency financed homes—which are just those moderately-priced homes—confirm that lower supply is driving up its prices. The FHFA index actually rose 0.4 percent, after a long string of declines.

clip_image006

Single-family home sales increased 10.0 percent to a seasonally adjusted annual rate of 3.97 million in September from a pace of 3.61 million in August, but are 19.5 percent below the 4.93 million level in September 2009. The median existing single-family home price was $172,600 in September, down 1.9 percent from a year ago.

Existing condominium and co-op sales rose 9.8 percent to a seasonally adjusted annual rate of 560,000 in September from 510,000 in August, but are 16.2 percent lower than the 668,000-unit level one year ago. The median existing condo price was $165,400 in September, down 6.2 percent from September 2009.

Sales for existing and new-homes increased in all regions, except the West’s 9.9 percent decline in new-home sales. So once again it looks like an uneven RE recovery, with coastal and economically stable Midwest regions showing the most improvement.

Harlan Green © 2010

Saturday, October 23, 2010

Redistributing Wealth—Not a Zero Sum Game

Popular Economics Weekly

No one wants to talk about the elephant in the room during this election season, wealth redistribution. Yet that is guiding policy makers on both sides of the political spectrum. Democrats are trying to restore middle class incomes by preserving the so-called middle class Bush II tax cuts for those incomes below $250,000, for example. Repubs meanwhile want to preserve all of the tax cuts, including for the wealthiest.

That is just one example of the mentality of both sides. In their minds, this economy is a zero-sum game, and so why discuss it? It is an I Win-You Lose world, in other words, which is fueled by the fear that many will miss out on a barely recovering economy. Yet that doesn’t have to be so.

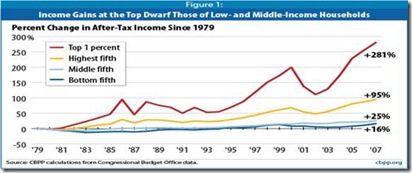
Wealth redistribution should be discussed, since most income segments have seen a decline in their real (after inflation) incomes since the 1970s—except for the top one percent income bracket. And we cannot afford such growing income inequality, now the greatest since 1929, since economists are discovering that it was a main cause of the 2007-09 Great Recession as well.

clip_image002

The largest share of the nation’s income now goes to the wealthiest households. For example, according to the Center on Budget Policy and Priorities, between 1979 and 2007:

  • The top 1 percent’s share of the nation’s total after-tax household income more than doubled, from 7.5 percent to 17.1 percent.
  • The share of income going to the middle three-fifths (or 60 percent) of households shrank from 51.1 percent to 43.5 percent.
  • The share going to the bottom fifth of households declined from 6.8 percent to 4.9 percent.
  • The share going to the bottom four-fifths (80 percent) of the population declined from 58 percent to 48 percent.

Yet overall, the long term, historical personal income rate of increase is 5.6 percent per year. So the I win-You lose mentality is a fallacious (and even specious) economic argument. In fact, modern economic theory says just the opposite—when income is more fairly distributed via progressive taxation and other wealth equalizing policies (including universal health care).

Put more money into consumers’ pockets (i.e., the lower and middle class income brackets that spend the most), and we all win. Mainstream economic theory states that it creates greater aggregate demand for all—i.e., demand for not only more goods and services, but investments that create jobs. And demand can be created from either the public or private sector.

This win-win policy is a well-known truth most explicitly formulated by John Maynard Keynes, the economic theorist most reviled by conservatives who oppose most forms of government spending—except for defense, of course.

Conservatives don’t like social security or universal health care either, of course, because conservatives wish to preserve their wealth—won over many years of hard fought battles with unions and progressive liberals under President Reagan’s “government is the problem” mantra. And with Ayn Rand disciple Alan Greenspan running the Federal Reserve during this time, the floodgates were opened to allow the so-called ‘free market’ rewards to flow to those most able to exploit its opportunities.

Of course the call to more individual freedom that Ayn Rand espoused has to be enabled by smaller government, which also meant lesser regulation. President Reagan’s mantra is good for a world of entrepreneurs in a Darwinian dog-eat-dog world of global competition, in which the lowest wage earning companies and countries with least environmental safeguards end up being the producers, while the rest of us become consumers.

The problem with producing less and consuming more, however, is that consumers also have to make a decent living if they are to spend more, which is impossible with declining wage and working standards. Only those at the top—the most educated and entrepreneurial, in a word—are able to exploit those opportunities. Clinton-era Labor Secretary Robert Reich has explored this in his, “The Future of Success”, and subsequent books.

There is another disadvantage to such growing inequality, as well. It leads to more severe recessions, as we have said. The greatest periods of income inequality, 1928-9 and 2007-08, also led us into the severest economic downturns—the Great Depression and Great Recession. There is no good economic or political reason for such inequality to continue, if we want more sustainable—and predictable--growth.

Harlan Green © 2010

Friday, October 22, 2010

Zero Inflation Won’t Help Economy Grow

Financial FAQs

Fed Chairman Ben Bernanke in his most recent speech said that more Quantitative Easing may be necessary, in order to comply with the Fed’s longer-run sustainable rate of unemployment and the mandate-consistent inflation rate. The longer-run sustainable rate of unemployment is the rate of unemployment that the economy can maintain without generating upward or downward pressure on inflation. .

Bernanke maintained, “The longer-run inflation projections in our Summary of Economic Projections (SEP) indicate that FOMC participants generally judge the mandate-consistent inflation rate to be about 2 percent or a bit below. In contrast, as I noted earlier, recent readings on underlying inflation have been approximately 1 percent. Thus, in effect, inflation is running at rates that are too low relative to the levels that the Committee judges to be most consistent with the Federal Reserve's dual mandate in the longer run.”

Why such a fear of too low inflation? Because it stymies growth. If prices are stagnant, then so are wages. And stagnant wages mean stagnant consumer spending, which leads to job layoffs in the highly competitive global economy.

clip_image002

Bernanke’s fears are well-known on this subject, as he has studied the lost decades of the Japanese economy, as well as our Great Depression. The Japanese recession and deflationary spiral was caused by the bursting of both its stock market and real estate bubbles. And it has never recovered from the resultant deflation.

clip_image004

U.S. Headline inflation at the consumer level since 2008 is eerily similar. Although September’s positive retail sales report should have made the Fed happy, the CPI numbers will have the Fed still worried about inflation being too low. Year-on-year, overall CPI inflation slipped to 1.1 percent (seasonally adjusted) from 1.2 percent in August. The core rate in September edged down to 0.8 percent from 1.0 percent the prior month. The core year-ago pace is the lowest since February 1961 when it stood at 0.7 percent.

clip_image006

The downtrend in the core has been heavily dependent on low inflation or even deflation for the shelter component as fallout from the depressed housing market. On an unadjusted year-ago basis, the headline number was up 1.1 percent in September while the core was up 0.8 percent.

A good sign for growth is that overall retail sales in September advanced 0.6 percent, following a 0.7 percent gain in August (revised up from 0.4 percent) and a 0.5 percent increase in July (previously 0.3 percent). Although auto sales led a September gain, strength is broad based.

clip_image008

The gain in September was led by motor vehicle sales and electronics & appliance stores, up 1.6 percent and 1.5 percent, respectively.  On a positive note, there actually has been notable improvement in housing related components with furniture & home furnishings and building materials & garden equipment rising for three consecutive months.

The bottom line is that rising inflation is a sign of rising demand, whereas falling inflation—or deflation—is a sign of stagnation, or recession. The Fed is accomplishing two immediate objectives by keeping interest rates at rock bottom. The cheaper dollar stimulates exports and so jobs in domestic export industries such as aircraft, at the same time subsidizing record low mortgage rates, thus stabilizing home prices. We hope that businesses get the message. It is better for them to invest in the potential for growth than sit on hoards of cash earning zero interest.

Harlan Green © 2010

Sunday, October 17, 2010

What Explains So Many Foreclosures?

The Mortgage Corner

The delinquency rate for mortgage loans on one-to-four-unit residential properties dropped to a seasonally adjusted rate of 9.85 percent of all loans outstanding as of the end of the second quarter of 2010, a decrease of 21 basis points from the first quarter of 2010, and an increase of 61 basis points from one year ago, according to the Mortgage Bankers Association’s (MBA) National Delinquency Survey. But is it only the recession that explains such horrendous numbers, the worst since the 50 percent default rate of the Depression?

Of course the recent recession and burst housing bubble have contributed to much of the foreclosure problem, but studies by the FDIC have shown deeper, underlying causes. In fact, the foreclosure rate has been rising since the 1970s, when it was as low as 0.2 percent.

“These latest delinquency numbers contain a mixture of somewhat good news and somewhat bad news.  The good news is that foreclosure starts are down and the inventory of homes anywhere in the process of foreclosure fell for the first time since 2006 and had the largest drop since 2005.  The fact that both the 90+ delinquency rate fell and the foreclosure start rate fell means that a significant number of these seriously delinquent loans have been successfully modified and reclassified as performing, current loans,” said Jay Brinkmann, MBA’s chief economist.

So-called underlying causes are worth studying because many factors go into the foreclosure pot besides the usual reasons of divorce and job loss. And though underlying causes may not directly precipitate a foreclosure, they make economic shocks such as job losses incurred during recessions harder to weather. There is of course a direct correlation between job losses and unemployment. Florida and Nevada with 12 and 14 percent unemployment rates, respectively, also have the highest delinquency rates.

clip_image002

The most obvious underlying trend studied by the FDIC is the rise in loan amounts as a percentage—or loan-to-value (ltv)—of the purchase price. The ltv for new mortgages has risen to almost 80 percent, from as low as 58 percent in the 1950s. This has particularly hurt homeowners whose housing values have plunged during this recession.

Another startling fact is the rise of mortgages not serviced by their lenders—i.e., that have been sold to investors. Today, 60 percent of new mortgages are sold to investors in the so-called secondary markets, when it was below 20 percent in the 1970s, according to the FDIC. This larger percentage of so-called service-released mortgages correlates with higher delinquency rates, probably because the originating lender (who is no longer responsible for servicing the loan) has in many cases loosened their underwriting standards—especially for the no income/no documentation subprime mortgages.

Today on a seasonally adjusted basis, the overall delinquency rate has decreased, driven by decreases in the rate for fixed rate loans and VA loans. However, ARM and FHA loans saw increases this quarter, said the MBA survey. The seasonally adjusted delinquency rate stood at 5.98 percent for prime fixed loans, 13.75 percent for prime ARM loans, 25.19 percent for subprime fixed loans, 29.50 percent for subprime ARM loans, 13.29 percent for FHA loans, and 7.79 percent for VA loans.

“Ultimately the housing story, whether it is delinquencies, homes sales or housing starts, is an employment story.  Only when we see a consistent increase in employment will we see an increase in sales and starts, and a sustained improvement in the delinquency numbers.  Until we see the increase in the number of households that comes with an increase in the number of paychecks, all measures of the health of the housing industry will continue to be weak,” said MBA’s Brinkmann.

The study’s conclusion is that “shocks to individual lifestyles or “trigger events,” such as divorce or job loss, have increased the risk of default. But “…the (overall) risk posture of individuals has increased, especially as individuals increasingly leverage their homes as part of a broader strategy of managing their overall wealth portfolio.”

And though during good times such underlying factors may not surface as proximate causes, they increase the risk of foreclosure during economic downturns.

Harlan Green © 2010

Tuesday, October 12, 2010

When Will Hiring Improve?

Financial FAQs

All eyes are focused on the jobs market as September’s unemployment report showed progress in private hiring, but a loss of 50,000 education jobs, as states and local governments sliced more than 159,000 jobs off their payrolls. When will it get better?  On the positive side, national private nonfarm employment continued to rise, advancing 64,000 in September, following a revised increase of 93,000 the prior month.

Private service-providing jobs gained 86,000 after an 83,000 increase in August.  The rise was led by a 38,000 boost in leisure & hospitality jobs.  Other increases were scattered by category.  Temp help services advanced another 17,000 after gaining 18,000 in August.  This category typically is a leading indicator for permanent job hires or layoffs but companies are still more skittish than usual about adding permanent positions.

clip_image002

The jobs deficit from this recession is much larger than those in previous recessions.  The economy would have to create an average of over 300,000 jobs a month for two years just to return to the December 2007 level of employment — and even more to restore full employment, since the population and potential labor force are now larger. Most forecasters expect the economy to grow much more slowly than that, especially as the stimulus from the Recovery Act winds down.

Why is job formation so slow, when record corporate profits and a stock market rally pushing the DOW above 11,000? It has to do with the so-called “output gap” between potential and actual economic growth (measured as Gross Domestic Product, or GDP), which can be self-perpetuating without fiscal or monetary stimulus. The Great Recession has the greatest output gap since the 1930s, in part because of the busted asset bubbles, which reduced asset values without reducing debt.

clip_image004

In the second quarter of 2010, the demand for goods and services (actual GDP) was about $890 billion (7 percent) less than what the economy was capable of supplying (potential GDP) said the nonpartisan Center on Budget and Policy Priorities. This large output gap, which is manifested in a high rate of unemployment and substantial idle productive capacity among businesses, is the legacy of the Great Recession. Congressional Budget Office projections show the gap closing slowly over the next several years as actual GDP grows only moderately faster than potential GDP.

The real issue is how to stimulate that demand, which is the sum of consumer spending, private and public investments and net exports, as we have said in past columns. Since many consumers are tapped out, and businesses are waiting to see if there is any demand for their goods and services, government has to step in with investments—either by hiring more people, or investing in infrastructure, or in education and research.

And stimulus spending does work. The problem is there isn’t enough of it to bridge the $trillions in lost output since 2008. Paul Krugman once estimated that up to $6 trillion in stimulus spending was needed. Government has maybe $3 trillion to date in direct spending, including ARRA and TARP programs, along with total Federal Reserve securities’ purchases to keep interest rates at record lows. The Congressional Budget Office estimates the stimulus has created or saved up to 3 million jobs to date, which means it has kept the unemployment rate from climbing even higher.

clip_image006

It is not possible to know for sure what would have happened if policymakers had not responded to the economy’s problems with significant financial stabilization and fiscal stimulus measures. However, Former Federal Reserve Vice Chairman Alan Blinder and Mark Zandi of Moody's Economy.com have done an econometric analysis which finds it would have been far worse with no policy response.

clip_image008

Blinder and Zandi say, the government’s policy response “probably averted what could have been called Great Depression 2.0.” They estimate that without TARP and the Recovery Act, GDP would have been nearly $1.4 trillion (in 2005 dollars) lower in the second quarter of 2010 than it actually was.

clip_image010

The question still is when that gap will be closed. One clue is the behavior of consumers. They are saving more while paying down debt in record amounts, so that debt-to-household income levels have dropped substantially. And, with wages and salaries increasing—which make up 80 percent of personal incomes—this should mean better growth and hiring prospects in the New Year.

Harlan Green © 2010

Friday, October 8, 2010

What Will Additional Fed Easing Do?

Financial FAQs

The Federal Reserve is contemplating additional stimulus measures, called Quantitative Easing (QE2), in a bid to keep economic activity from sinking further. The main reason is their fear that we could end up in a Japanese-style deflationary spiral, when both wages and prices fall.

New York Fed Prez William Dudley spelled out their reasoning:

“Currently, my assessment is that both the current levels of unemployment and inflation and the timeframe over which they are likely to return to levels consistent with our mandate are unacceptable. In addition, the longer this situation prevails and the U.S. economy is stuck with the current level of slack and disinflationary pressure, the greater the likelihood that a further shock could push us still further from our dual mandate objectives and closer to outright deflation.”

Banks are now sitting on more than $1 trillion in excess reserves—i.e., reserves in excess of what they need to keep at the Federal Reserve, and the Fed wants them to begin to lend that money to businesses who want to expand.

clip_image002

Why the huge reserves? It wasn’t because banks were waiting to see the new consumer regulations in the Dodd-Frank Wall Street Reform Act that became law in July, but because there just isn’t enough demand for their business. Large corporations are sitting on mountains of cash because of record profits—from $1 to $2 trillion, depending on who is doing the calculations—and consumers are reducing their debt load because of diminished incomes.

Will additional QE2 cause unacceptable inflation? Not so, according to the inflation indicators. The Personal Consumption Expenditure indicator measures the most general price levels and it currently shows falling inflation, though not yet outright deflation.

clip_image004

The latest numbers are why the Fed worries that inflation is too low. Year-ago headline PCE inflation held steady at 1.5 percent.  Year-ago core PCE inflation was unchanged at 1.4 percent.  These numbers are either at or below the bottom of the Fed’s implicit inflation target of 1-1/2 to 2 percent.  Some Fed officials are now describing the “desired” range as 1-3/4 to 2 percent.

The Fed says it will begin purchasing more long term Treasury securities in order to keep interest rates low. It just purchased $5 billion at the latest Treasury bond offering, for instance. What would so-called ‘QE2’ accomplish? Fed Chairman Bernanke says,

“For a sustained expansion to take hold, growth in private final demand--notably, consumer spending and business fixed investment--must ultimately take the lead. On the whole, in the United States, that critical handoff appears to be under way...(but) the pace of that growth recently appears somewhat less vigorous than we expected. ... Incoming data on the labor market have remained disappointing. ... Overall, the incoming data suggest that the recovery of output and employment in the United States has slowed in recent months, to a pace somewhat weaker than most FOMC participants projected earlier this year.”

In other words, the Fed is trying to find ways to encourage more hiring. The latest Small Business Lending Bill provided $30B in SBA loans + other provisions to businesses with less than 500 employees. Community banks with less than $10B in assets are eligible to administer the funds.

Additional access to capital will be provided by increasing certain SBA loan limits.  The maximum SBA guarantee on 7(a) loans is increased to 90 percent, and fees for 7(a) and 504 programs are temporarily eliminated.  Also, maximum loan amounts are increased:  Section 7(a) loans from $2 million to $5 million; Section 504 loans from $2 million to $5 million; and SBA microloans from $35,000 to $50,000.   The SBA Express program limitation would be increased from $350,000 to $1 million for one year.

One interesting employment statistic for overall hiring is the monthly JOLTS (Job Openings and Layoff Turnover Summary) put out by the Labor Dept. August’s numbers say that approximately 4.20 million jobs were lost, and 4.14 million created in the month. Its most important component is the number of job openings, which has been rising of late. There were 3.2 million openings in August, with the number of job openings up by 863,000 (37 percent) since the most recent series trough of 2.3 million in July 2009, according to JOLTS.

clip_image006

Therefore we should see a private sector pickup in hiring. It means some businesses will be adding jobs—particularly in the service sector (e.g., retailers and restaurants for the holidays). Challenger and Gray expects a 600,000 retail jobs increase this season, up 20 percent from last year’s 501,400.

Harlan Green © 2010

Wednesday, October 6, 2010

Pending Sales Show Housing Improvement

The Mortgage Corner

The NAR’s Pending Home Sale Index, a forward-looking indicator of existing-home sales, rose 4.3 percent to 82.3 based on contracts signed in August from 78.9 in July. The data reflects contracts and not closings, which normally occur with a lag time of one or two months.

The NAR’s chief economist Lawrence Yun said the latest data is consistent with a gradual improvement in home sales in upcoming months. “Attractive affordability conditions from very low mortgage interest rates appear to be bringing buyers back to the market,” he said. “However, the pace of a home sales recovery still depends more on job creation and an accompanying rise in consumer confidence.”

Job creation was helped by the latest Institute of Supply Management’s service sector index, which showed month-to-month strength in September, an important indication for second-half economic growth. The ISM's non-manufacturing composite rose more than 1-1/2 points to 53.2, right in line with the year's trend which is 53.6. New orders had been slowing but picked up nicely, 2-1/2 points to 54.9.

clip_image002

The employment index in particular picked up 2 points as did supplier deliveries, while both new export and import orders soared, with export orders up a whopping 12 points in the index. A significant slowing in delivery times is a definitive sign of strength in this report, at 55.0 for the highest reading in more than two years. The non-manufacturing sector shows plenty of activity, in other words, news that should boost September’s employment report.

clip_image004

Another boost could come from consumers. Despite sluggish job growth, the combination of modest growth in average hourly earnings, private employment, and steady or firming weekly hours is gradually boosting wages and salaries—at least in the private sector.  Personal income in August advanced a healthy 0.5 percent, as we said last week, following a 0.2 percent rise the month before and beating the market estimate for a 0.3 percent rise.

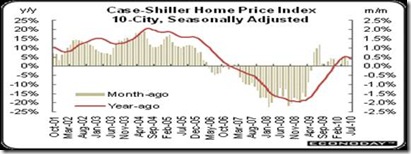
Does the increase in pending home sales mean prices will stabilize? The S&P Case-Shiller (same) Home Price Index was still positive, but not as positive as in the spring, before the April expiration of the homebuyers’ tax credit.

clip_image006

The unadjusted data show strength, up 0.8 percent for the composite 10 for a fourth straight solid gain. But seasonal patterns play a big role in home prices and summer is a seasonally a busy time for the market with higher demand providing some lift for unadjusted prices.

The Pending Home Sale Index declined 2.9 percent in the Northeast to 60.6 in August, while it rose in all other regions. It rose 2.1 percent in the Midwest increased 6.7 percent in the South to an index of 90, and rose 6.4 percent in the West.

Will an improving economy boost employment? The signs are there, with falling labor productivity in Q2 indicating the existing workforce cannot produce more, and real estate showing a bit of life, in spite of the foreclosure backlog. It really looks like RE prices have bottomed out—in fact have been stuck in a range for more than one year—since May 2009, according to Case-Shiller.

So there is no reason for homebuyers to put off buying. It looks like employers are at least willing to boost the incomes and benefits of those 90 percent who are employed, in return for their longer hours.

Harlan Green © 2010

Friday, October 1, 2010

Consumers Push Third Quarter Economic Growth

Popular Economics Weekly

The Great Recession was officially over in June 2009, and we now know there won’t be a ‘double-dip’ recession—since the economy has been growing since then. While the debate rages on how much more to stimulate demand, there is a consensus that the third quarter will show higher growth—more than the final 1.7 percent growth rate estimate of Q2.

clip_image002

Buried in the second quarter statistics was that so-called final demand of domestic purchases rose 4.3 percent, though much of it was from imports. That is the total amount bought by U.S. citizens, and shows consumer spending is recovering. But domestic durable goods and industrial production are also rising, which feeds exports and should boost GDP growth further.

Though new factory orders for durable goods in August dipped 1.3 percent, following a 0.7 percent rebound in July, new orders excluding highly volatile transportation orders gained a large 2.0 percent. This series has risen in three of the last four months and in five of the last seven.

clip_image004

And the consumer made a comeback in August-in both income and spending. Despite sluggish job growth, the combination of modest growth in average hourly earnings, private employment, and steady or firming weekly hours is gradually boosting wages and salaries-at least in the private sector. Personal income in August advanced a healthy 0.5 percent, following a 0.2 percent rise the month before. This report is not stellar but it is welcome news that the consumer sector bounced back and should help support overall economic growth.

clip_image006

And the Fed still has plenty of room to continue with quantitative easing as core inflation is still below the Fed's implicit target range. It was an 18-month recession, as we said last week, the longest in fact since the 1929-33 first Great Depression that lasted 43 months. So Fed policy has to put more money in consumers’ pockets—because the Middle Class lost much of its earning power over the last 3 decades.

There are many reasons for this, as Clinton Labor Secretary Robert Reich catalogues in his new book, “Aftershock”. With wide-open globalization of labor markets, it is more profitable to ship some jobs overseas these days. This benefits CEOs, their shareholders, and the financial institutions who lend and invest in them, but not domestic workers. It is primarily why the investor class of top 1 percent income-earners now earn 23.5 percent of total household income, just like in 1929.

clip_image008

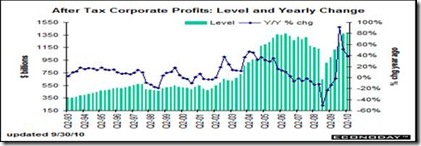
The result is that corporate profits in the second quarter are soaring, up an annualized 3.8 percent, following a 54.1 percent surge the prior quarter. Profits are up 38.7 percent on a year-on-year basis, compared to up 50.8 percent in the first quarter.

The latest personal income report clearly is good news as consumers are seeing income growth-especially in the private sector. And spending continues to be moderately healthy. Thus far, the numbers indicate a strengthening in third quarter GDP from the anemic second quarter pace.

Harlan Green © 2010