Tuesday, November 23, 2021

Does America Care Again?

 Financial FAQs

PEW Research

The American Rescue Plan, The Infrastructure Investment and Jobs Act, and the soon to pass Build Back Better Plan show that the American ‘can do’ spirit is alive, the innate generosity and optimism that is so much a part of the American spirit is returning.

Will a revival of that spirit last, in spite of the ongoing pandemic, red vs. blue state civil war, and still record joblessness?

The truest expressions of Americans’ character have come out during past catastrophes, such as the Great Depression and World War Two. And almost 10 years of unparalleled growth followed the horrors of World War One and the 1918 Spanish Flu pandemic. 

The coronavirus pandemic is bringing about a similar transformation of character and culture that was always there but sometimes hidden when times were good.

And record economic growth is following the coronavirus pandemic, with Q1 and Q2 2021 GDP up more than 6 percent, and the fourth quarter possibly growing at the same pace after the third quarter pause due to the Delta variant surge.

Americans are showing that they care for each other with these bills—that lifting children and the poorest out of poverty also lifts themselves. That renewing our roads, bridges, energy grids; and confronting the greatest threat to our future, climate change, will ensure a country that our children can be proud of and prosper in.

It’s obvious that the American Rescue Plan saved many lives and livelihoods, and the Infrastructure bill means caring for the planet as well as each other with its $billions spent on climate change and improving health and sanitation.

It’s less obvious what spending on social infrastructure does. Investing in children, improved healthcare, and paid family leave strengthens families, something both political parties should be for, but conservatives have opposed since FDR’s New Deal.

Who will get most of the good jobs in construction from rebuilding our physical infrastructure? Some 80 percent go to less-then-college-educated workers, says the White House in its initial announcement of the Infrastructure Investment and Jobs Act.

In part because of the recovery money already distributed during the pandemic, median household income has resumed its climb for the first time since 2000, as shown in the above PEW research graph. It had dropped from $70,800 in 2000 to $65,100 after the Great Recession.

In 2018, the median income of U.S. households stood at $74,600. This was 49 percent higher than its level in 1970, when the median income was $50,200. (Incomes are expressed in 2018 dollars.)

The pandemic is bringing about a whole transformation of America that will last because it is bringing Americans together again in common cause, and history shows this brings out the best in us.

Harlan Green © 2021

Follow Harlan Green on Twitter: https://twitter.com/HarlanGreen

Thursday, November 18, 2021

Why are So Many Quitting?

Popular Economics Weekly

Calculated Risk

Several headlines last Friday screamed 4.4 Million Workers Quit Their Jobs, as if that was the most important takeaway from the Labor Department’s October JOLTS report.

But there were also 6.5 million hires (dark blue line in graph) and 10.4 million mostly voluntary separations (yellow line).

In fact, many of those quitting were shifting to better jobs, not leaving the workforce. Quits were up 34 percent year-over-year to a new record high. These are voluntary separations that generally mean they are finding better jobs. (see light blue columns for "quits").

Another indication job formation is heading in the right direction is that 4th Quarter GDP growth predictions are between 6 to 8 percent, as we continue to recover from the pandemic, up from the Q3 growth slowdown to 2 percent. 

This is huge and predicates many more job hires as producers race to stock their shelves in the face of shortages. They had better stock up soon, as consumers are buying like never before. Retail and trade sales surged 1.7 percent last month, the government said, and are up 16.3 percent YoY.

That’s the biggest gain since the government last doled out billions of dollars in stimulus money to families with the American Rescue Plan in March that kept many families and businesses solvent. It delivered $1400 to millions of American families, extended enhanced unemployment benefits and boosted funding to ramp up vaccine distribution and reopen schools.

Retail sales rose 4 percent last month at internet retailers, 3.8 percent at electronics and appliance stores and 2.2 percent at department stores to lead the way in October, all strong numbers. Sales also climbed 1.8 percent at auto dealers, but partly because of record prices. Automakers can’t make enough cars to satisfy demand due to a global parts shortage.

If autos and gas are set aside, U.S. retail sales rose a smaller 1.4 percent last month. Those two categories often exaggerate ups and downs in consumer spending and aren’t always good indicators of how much households are willing to spend.

Nor is it a reliable indicator of inflation, as retail sales are not inflation-adjusted. Consumers are pushing up prices because they have so much money to spend, and the supply bottlenecks won’t subside until next year; after the holidays when consumers traditionally become stingier and demand diminishes. 

Inflation is actually a good sign at the moment, because we like to spend during good times and scrimp during a recession, or the expectation of one. So now isn’t the time to fret about inflation. 

CDCCovidTracker

Another pandemic surge is much more worrisome, as infection rates are declining more slowly at the start of cold weather when Americans go indoors, which is a real reason to worry about what may happen next year.

“The current 7-day moving average of daily new cases (70,431) decreased 1.4% compared with the previous 7-day moving average (71,450). A total of 46,180,190 COVID-19 cases have been reported as of November 3, 2021.”

So the best holiday wish for this week is that we all stay as healthy and wealthy as possible!

Harlan Green © 2021

Follow Harlan Green on Twitter: https://twitter.com/HarlanGreen


Monday, November 15, 2021

Where are the Truck Drivers?

 Financial FAQs

@PaulKrugman

If one picture can save 1,000 words, then maybe Nobel Laureate Paul Krugman’s citing of the huge decline in average hourly wages of Production and Non-supervisory Employees in Transportation and Warehousing since the 1970s goes a long way to explaining the current supply-chain bottleneck and concurrent inflation surge.

It explains even more—why so many Americans are refusing to return to their workplaces. The COVID pandemic has exposed the consequences of the overall decline in working Americans’ wages and standard of living that has shrunk the middle class and endangered our democracy.

Of course, the coincidence of declining wages and truck-driver shortages doesn’t necessarily spell causation, but at a time of soaring demand by consumers and producers for the products they deliver, they have one of the most demanding 24/7 jobs for less than college-educated workers.

And there is much anecdotal evidence from independent truckers that confirms the existing pay scale is not worth it. In October, the American Trucking Association said the U.S. needed 80,000 more truck drivers.

Shauntai Robinson, an owner operator out of the ports in South Carolina, in a post on Medium cited by Yahoo News, said that after 16 years in the industry, she was beginning to question the viability of a career as a truck driver.

"There are thousands of valid class A CDL holders, across the United States, who have elected to not drive a truck anymore," Robinson wrote. "These people have not relinquished their credentials. Instead, these valuable people have been forced to seek alternative forms of employment in order to be able to provide for their families."

On average, truck drivers working full time, year-round, earn about $43,252 annually, lower than the median for all full-time workers ($47,016), but exceed those of other blue-collar jobs, says the US Census Bureau.

FREDwages

The huge decline in transportation and warehousing wages actually mirrors the sharp decline in average hourly wages of all production and non-supervisory workers that began in 1980, as can be seen from the above FRED graph (gray bars are recessions).

That was when Big Business began its lobbying campaign to influence economic policies—morphing into what came to be known as trickle-down economic policies with the election of President Ronald Reagan in 1980.

Reaganomics accelerated the deregulation of whole industries that began in the 1970s, with directly suppressing the collective bargaining rights of workers to such an extent that there are now 26 so-called right-to-work (red) states that say a worker can work in a company employing unionized workers, and enjoying its benefits, without having to pay union dues!

The millions of workers holding back from reentering the workforce because of the worst pandemic in 100 years has perhaps awakened more than truck drivers to the need to hold out for a better economic system that has impoverished them since the 1980s, when conservative economic policies took away workers’ rights as well as drastically reduced their incomes.

President Biden’s $1.2 trillion Infrastructure Investment and Jobs Act (IIJA) was passed just in time to make a difference for working families by providing jobs that can support families.

“The bill is a significant down payment on the $2.5 trillion infrastructure investment gap that was identified in the 2021 Report Card and will benefit American businesses and families for years to come,” according to the American Society of Civil Engineers (ASCE), as I reported last week.

The COVID pandemic is bringing about a wholesale transformation of American capitalism, including an opportunity for American workers to have a voice in transforming it.

Harlan Green © 2021

Follow Harlan Green on Twitter: https://twitter.com/HarlanGreen

Wednesday, November 10, 2021

"It's the COVID Pandemic, Stupid!"

Financial FAQs

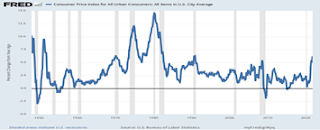
FREDcpi

Why the supply-chain bottlenecks and soaring inflation? “It’s the pandemic, stupid.” economists and industry leaders are saying.

President Biden’s $1.2 trillion Infrastructure Investment and Jobs Act (IIJA) was passed just in time to slow the inflation climb and make for a merrier Christmas.

Consumers and producers are worried because the consumer price index jumped 0.9% last month, the government said Wednesday. The pace of inflation over the past year marched to 6.2% in October from 5.4% in the prior month. That’s triple the Federal Reserve’s 2% target and is the highest rate since November 1990.

But even the latest price spike following last year’s pandemic-induced recession was barely higher than that following the 2007-9 recession (gray bar), per the above FRED graph of CPI inflation rates.

Economists such as Obama’s chief economic advisor, Austin Goolsby, are saying this is a one-of-a-kind slowdown caused by the pandemic. “The most important thing to watch if you want to understand the economy is, as has been the case for a year and a half now, the progress made against the virus,” said Goolsby in a recent NYTimes Op-ed.

Why will the new infrastructure bill create a merrier holiday season? Because it jump-starts a renewal of public investment in America’s future with the largest spending programs since Roosevelt’s New Deal.

The bill provides $110 billion to repair the nation's aging highways, bridges and roads. According to the White House, 173,000 total miles of America's highways and major roads and 45,000 bridges are in poor condition. And the almost $40 billion for bridges is the single largest dedicated bridge investment since the construction of the interstate highway system, according to the Biden administration.

“The bill is a significant down payment on the $2.5 trillion infrastructure investment gap that was identified in the 2021 Report Card and will benefit American businesses and families for years to come,” says the American Society of Civil Engineers (ASCE).

“The bill represents a historic, once-in-a-generation investment in our roads, bridges, water and wastewater networks, ports, electric grid, dams, and more. It increases funding, makes smart improvements to policy such as streamlining permitting, and it creates new programs targeted at almost all 17 categories in the 2021 Report Card for America’s Infrastructure, according to the ASCE.

Specifically, the IIJA includes a reauthorization of our surface transportation programs, the Drinking Water and Wastewater Infrastructure Act, as well as an additional $559 billion in new spending that is a combination of targeted funds for overdue state of good repair projects, but also forward-looking programs and policy to make our infrastructure more resilient, said ASCE.

These funds include:

  • $110 billion for roads, bridges, and major projects;
  • $66 billion for passenger and freight rail;
  • $65 billion for broadband internet;
  • $46 billion for resilience to help states and cities prepare for droughts, wildfires, climate change, and more;
  • $39 billion for public transit; and
  • $17 billion for ports and waterways.

This is just a down payment on what needs to be done to bring the American economy into the 21st century, according to the Federal Reserve Chair Janet Yellen: “We are now engaged in the most important economic project in recent history: Repairing the broken foundations of our economy, and on top of them, building something stronger and fairer than what came before.”

Consumers will continue to worry about inflation as much as the pandemic in the coming months. But the inflation rate is tied to the infection rate. How? Supply-chain shortages are causing the price hikes. And when millions more return to work (such as truck drivers) once the pandemic subsides sufficiently, this should in turn loosen the supply-chain constrictions, bringing down prices.

So, instead of saying, “It’s the economy, stupid.” we can say, “It’s the pandemic, stupid” that’s holding up the recovery.

Harlan Green © 2021

Follow Harlan Green on Twitter: https://twitter.com/HarlanGreen


Friday, November 5, 2021

October Employment Roars Back

 Popular Economics Weekly

MarketWatch

Who said the labor shortage is holding back job gains? Not for the moment. It looks like the roaring 2020s are beginning to roar in earnest this fall as we slowly exit the pandemic.

Total nonfarm payroll employment rose by 531,000 in October, and the unemployment rate edged down by 0.2 percentage point to 4.6 percent, the U.S. Bureau of Labor Statistics reported today.

“Job growth was widespread, with notable job gains in leisure and hospitality, in professional and business services, in manufacturing, and in transportation and warehousing. Employment in public education declined over the month.”

People are returning to work, in part because 9 million lost jobless benefits in September as the federal extended unemployment insurance program was terminated.

The government revised the number of new jobs created in September to 312,000 from 194,000, based on new information from the businesses surveyed, said MarketWatch. And the job gains in August were raised to 483,000 from 366,000.

A total of 5.6 million payroll jobs have been created this year to date and average hourly wages have increased 4.6 percent. President Biden touted that these numbers showed that the U.S. now had the fastest job growth in the developed world.

Leisure and Hospitality, Education & Health, and Professional/Business added 320,000 jobs, manufacturing and construction added 104,000 jobs, while governments lost 73,000 jobs (from a loss in public education).

The service sector is roaring back, in other words, as restaurants, hotels, theaters and other companies in the hospitality business created 164,000 new jobs last month.

The jump in payroll employment was presaged by a recent poll of senior business executives in service-oriented companies, such as retailers and banks that rebounded to a three-month high of 58.2 from 54.9 in September, IHS Markit said Friday.

A similar survey of manufacturing activity slipped to 59.2 from 60.7, but it was still quite high. Any reading over 50 signals growth and numbers are above 55 are exceptional.

CDC.gov

Another reason for the payroll surge is the COVID infection rate continues to decline. This is in part because 70 percent of Americans have been fully vaccinated, a total of 193 million Americans

“The current 7-day moving average of daily new cases (68,793) decreased 7.4% compared with the previous 7-day moving average (74,290). A total of 45,655,635 COVID-19 cases have been reported as of October 27, 2021,” reported the CDC.

And there is reason to believe even more workers will return to their jobs this fall and winter—especially moms as their children return to schools and become vaccinated with the new children’s’ vaccines.

What could dim this optimistic prediction? Very little, in my opinion. The euro area is also roaring back with an annual growth rate of 9 percent last quarter, according to Nobel Laureate Paul Krugman.

And the rest of the world is slowly recovering from the pandemic. It’s really a matter of continuing to vaccinate the unvaccinated worldwide, which means restoring the supply-chains in this deeply interconnected world.

Is there anything that could prevent it from being restored? Maybe another war with…? Let’s hope not.

Harlan Green © 2021

Follow Harlan Green on Twitter: https://twitter.com/HarlanGreen

Thursday, November 4, 2021

Manufacturing, Service Sector Growth Prolong Recovery

 Financial FAQs

 FREDmanufacturing

U.S. manufacturing and service sector activity continued to climb, despite the price hikes and supply bottlenecks. And we are just at the beginning of the holiday shopping season. Both economic sectors per the ISM supply managers’ indexes show a continuing red-hot demand for goods and services.

Inflation worriers can worry less, as production speeds up. Manufacturing output alone is up 14.8 percent in the second quarter YoY (see FRED graph), reducing price pressures. Eventually resolving supply-chain issues of clogged ports and container shipments will cause supplies to catch up to the demand for goods.

Timothy R. Fiore, ISM Manufacturing Chair, said “Business Survey Committee panelists reported that their companies and suppliers continue to deal with an unprecedented number of hurdles to meet increasing demand. All segments of the manufacturing economy are impacted by record-long raw materials lead times, continued shortages of critical materials, rising commodities prices and difficulties in transporting products. Global pandemic-related issues — worker absenteeism, short-term shutdowns due to parts shortages, difficulties in filling open positions and overseas supply chain problems — continue to limit manufacturing growth potential.”

The ISM services index measuring economic activity in industries such as Retail Trade; Transportation & Warehousing; Real Estate, Rental & Leasing; Arts, Entertainment & Recreation; jumped to an all-time high of nearly 67 in October, the Institute for Supply Management said Wednesday. The Business Activity and New Orders indexes reached 69.8 percent.

This tells us again that retail sales making up some 50 percent of consumer spending will continue strong in the holiday shopping season.

“In October, strong growth continued for the services sector, which has expanded for all but two of the last 141 months,” said ISM chair Anthony Nieves in a statement. “However, ongoing challenges — including supply chain disruptions and shortages of labor and materials — are constraining capacity and impacting overall business conditions.”

Though the huge obstacles to supply are causing some uncertainty, any figure above the 50 percent ISM survey breakeven point shows expansion. This is a sign that businesses are just beginning the replacement cycle of plants and equipment, rather than any imminent slowdown of activity caused by the bottlenecks and labor shortages.

As a side note, the number of Americans who applied for unemployment benefits in late October fell to yet another pandemic low in the latest week, reflecting an urgent need by companies to hold onto to current employees and find new ones. New jobless benefit claims dropped by 14,000 to 269,000 in the seven days ended Oct. 30, the government said Thursday.

Some five million have not returned to work that were employed before the pandemic and there are 10 million job openings, so it’s not yet possible to know when and if the current labor shortage will continue to put a drag on growth.

But, in a way, this might cool demand enough that economic growth doesn’t overheat and bring on another asset bubble, and maybe tame the inflation tiger as well.

Harlan Green © 2021

Follow Harlan Green on Twitter: https://twitter.com/HarlanGreen