Thursday, July 29, 2021

Second Quarter Economic Growth Explodes

 Financial FAQs

BEA.gov

The U.S. economy grew at a blistering pace in the spring and repaired most of the damage caused by the pandemic thanks to widespread coronavirus vaccinations and a nearly full reopening of the economy.

The Q2 GDP report verifies that the American economy is capable of easily accommodating the Biden administration’s proposed infrastructure and American Family plan spending of some $4 trillion in additional government investments, should they be passed in their present form.

“Real gross domestic product (GDP) increased at an annual rate of 6.5 percent in the second quarter of 2021, reflecting the continued economic recovery, reopening of establishments, and continued government response related to the COVID-19 pandemic,” according to the Bureau of Economic Analysis (BEA).

This is huge after the first quarter’s 6.3 percent growth and shows both consumers and businesses are spending enough to boost GDP growth past the pre-pandemic level.

The increase in real GDP in the second quarter reflected increases in personal consumption expenditures (PCE), nonresidential fixed investment, exports, and state and local government spending that were partly offset by decreases in private inventory investment, residential fixed investment, and federal government spending. Imports, which are a subtraction in the calculation of GDP, increased.

Such growth should continue in the third quarter with agreement being reached on the $1 trillion national infrastructure plan after weeks of fits and starts, once the White House and a bipartisan group of senators agreed on major provisions of the package that’s key to President Joe Biden’s agenda.

The package includes $110 billion for highways, $65 billion for broadband and $73 billion to modernize the nation’s electric grid, according to a White House fact sheet. Additionally, there’s $25 billion for airports, $55 billion for waterworks and more than $50 billion to bolster infrastructure against cyber attacks and climate change. There’s also $7.5 billion for electric vehicle charging stations.

Government assistance payments in the form of loans to businesses and grants to state and local governments increased in Q2, while social benefits to households, such as the direct economic impact payments, declined. In the first quarter of 2021, real GDP increased 6.3 percent (revised), as I said.

“The $1.2 trillion Bipartisan Infrastructure Framework is a critical step in implementing President Biden’s Build Back Better vision,” said the White House fact sheet. “The Plan makes transformational and historic investments in clean transportation infrastructure, clean water infrastructure, universal broadband infrastructure, clean power infrastructure, remediation of legacy pollution, and resilience to the changing climate. Cumulatively across these areas, the Framework invests two-thirds of the resources that the President proposed in his American Jobs Plan.”

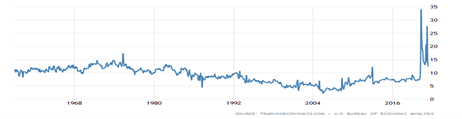
Inflation is running hot, as was expected from the sudden surge in demand that has GDP growth exceeding its pre-pandemic level. The PCE price index that the Fed prefers to measure inflation increased 6.4 percent, compared with an increase of 3.8 percent (revised). Excluding food and energy prices, the PCE price index increased 6.1 percent, compared with an increase of 2.7 percent (revised).

This level of inflation is worrisome if prolonged, but the Federal Reserve believes supply bottlenecks are causing the price rises that should subside once industry activity returns to normal and the 7 million workers still unemployed due to the pandemic return to work.

This is the biggest investment in America’s future since the Eisenhower and Kennedy days more than two generations ago when our tax monies were spent on real things; like our interstate highway system, moon landings, and development of the Internet.

These new government spending initiatives will find new ways to benefit workers in this new economy as other developed countries are doing—i.e., with governments working to pay it forward for future generations.

Harlan Green © 2021

Follow Harlan Green on Twitter: https://twitter.com/HarlanGreen

Wednesday, July 28, 2021

Why Are Consumers So Confident?

 Popular Economics Weekly

Conference Board

“Rather than retreating mildly this month as expected, the Conference Board’s consumer confidence index edged up slightly from an upward-revised June level to stand at 129.1,” said Reuters.  That was a new pandemic-era high, although still slightly below the pre-pandemic (February 2020) level of 132.6.”

Why are consumers so optimistic with alarm bells ringing that economic activity may slow due to the pandemic’s latest surge in the Conference Board's latest survey? Because it’s not hurting the jobs market with the 6 million plus job vacancies and employers practically begging their employees to return to work.

The Conference Board’s jobs-plentiful index increased to a 21-year high of 54.9, for starters, and wages and salaries at the bottom end of salaried workers are rising at the fastest clip since the pandemic.

“Consumers’ appraisal of present-day conditions held steady, suggesting economic growth in Q3 is off to a strong start,” said Lynn Franco, Senior Director of Economic Indicators at The Conference Board. “Consumers’ optimism about the short-term outlook didn’t waver, and they continued to expect that business conditions, jobs, and personal financial prospects will improve.”

Consumers have been spending like there’s no tomorrow since January, as I’ve said. The question remains just how long can that continue with the coronavirus Delta variant causing infection rates to soar among the unvaccinated, but rising prices aren’t fazing consumers with so much disposable income at their disposal to spend.

“Short-term inflation expectations eased slightly but remained elevated.,” continued Franco. “Spending intentions picked up in July, with a larger percentage of consumers saying they planned to purchase homes, automobiles, and major appliances in the coming months. Thus, consumer spending should continue to support robust economic growth in the second half of 2021.”

The IMF among other authorities believes worldwide GDP will expand 6 percent this year. That is huge, up from 2-3 percent in recent years.

Households are still buying plenty of goods, but they have shifted their spending toward services they avoided during the pandemic, “dining out, entertainment, travel, vacation trips and so forth,” reported MarketWatch in last week’s retail sales report.

And this is where any future super-spreader events will occur. It is why the US Surgeon General is saying masks should again be worn in crowded indoor locations with poor ventilation—such as bars and restaurants. This may certainly cause consumers to take notice, but not yet per consumer confidence surveys.

COVIDTracker

Take bars and restaurants, the only category in the monthly retail report that involves services. Retail sales jumped 2.3 percent in June, the government said Friday, and rose sharply for the fourth month in a row. And through the first six months of 2021 receipts are up almost 38 percent.

We know consumers also would have bought more new cars and trucks last month, but automakers cannot produce enough of them because of a shortage of computer chips. Semiconductors are now a critical component in modern vehicles.

There is still a reluctance for some workers to return to work. I reported last week that the job-listing site Indeed did a 5,000 person survey that gave an additional reason why workers are reluctant to return to work.

“Among the unemployed, concern about COVID-19 is the most commonly cited reason for a lack of urgency in looking for work,” wrote Nick Bunker, the economic research director for North America at the Indeed Hiring Lab, in a blog post on the survey results. Some 23% of unemployed people said fear of the virus was keeping their job search “non-urgent.”

This doesn’t seem to have dimmed consumer confidence or spending habits now. But the current 7-day moving average of daily new cases (40,246) increased 46.7% compared with the previous 7-day moving average (27,443), says the CDC (see graph). The current 7-day moving average is 84.2% lower than the peak observed on January 10, 2021 (254,052) and is 250.6% higher than the lowest value observed on June 19, 2021 not(11,480).

Although pundits some economists are concerned about the Delta variant and rising prices, it has not dented consumers’ confidence in their future.

Harlan Green © 2021

Follow Harlan Green on Twitter: https://twitter.com/HarlanGreen

Monday, July 26, 2021

Can We Fix the Housing Shortgage--Part II?

 The Mortgage Corner

Calculated Risk

WASHINGTON (July 22, 2021) – Existing-home sales increased in June, snapping four consecutive months of declines, according to the National Association of Realtors®.

But it’s not enough to bridge the supply-demand gap, especially for those entry-level homebuyers in their thirties with families that have lower incomes and credit scores. Lenders haven’t reduced the very stringent credit standards in place since the Great Recession and busted housing bubble that would allow more first-time homebuyers to take advantage of record-low interest rates.

“Total existing-home sales,1 https://www.nar.realtor/existing-home-sales, completed transactions that include single-family homes, townhomes, condominiums and co-ops, grew 1.4% from May to a seasonally adjusted annual rate of 5.86 million in June. Sales climbed year-over-year, up 22.9% from a year ago (4.77 million in June 2020).”

Will housing construction be able to bridge the huge gap between what is needed and what is available? Not in the near term, as there are too many labor and material shortages, say the homebuilders. Demand is so hot for housing with a limited supply that homes typically sold within 17 days (24 days one year ago), say the Realtors in the NAR’s most recent Buyer Traffic Index.

U.S. home builders started construction on homes at a seasonally-adjusted annual rate of 1.64 million in June, representing a 6.3 percent increase from the previous month’s downwardly-revised figure, the U.S. Census Bureau reported this week. Compared with June 2020, housing starts were up 29 percent, though the year-over-year comparison is skewed somewhat by the effects of the COVID-19.

FREDhousestarts

But that is nowhere near the 2 million residential units under construction in the mid-2000s (see FRED graph), which brought on the housing bubble. But times are much different today, as housing construction almost ground to a halt from the housing bubble and Great Recession that followed. Population growth continued, however, so growth today’s builders are playing catchup.

The June reading of 1.64 million starts is the number of housing units builders would begin if development kept this pace for the next 12 months, says the National Association of Home Builders. Within this overall number, single-family starts increased 4.2 percent to a 1.10 million seasonally adjusted annual rate. The multifamily sector, which includes apartment buildings and condos, increased 2.4 percent to a 474,000 pace.

So how can we increase production? “We’ll need to do something dramatic to close this gap,” said Yun in a press release. And that gap is mainly affordability, as housing prices are increasing in double-digits, while real personal income has averaged some five percent per year.

First-time buyers accounted for just 31 percent of sales in June, also even with May but down from 35 percent in June 2020. This is far below past history when 40 percent were first-timers. Part of the problem is that entry-level buyers tend to have lower credit scores when lenders have maintained very high credit score criteria, averaging above 750 at last report, whereas homebuyers with scores between 680-720 were considered good credit borrowers before the Great Recession and housing bubble.

Realtors have proposed increasing the housing supply by creating or expanding tax credits, loans or grants for builders who renovate or build new housing in low-income areas and who convert old malls and factories into homes. They also asked for incentives for cities to allow denser zoning, an approach that President Biden included in his infrastructure proposal, Reuters reported, as I said last week.

But pressure has to be put on lenders to reduce their sky-high credit standards, as well, to allow those entry-level homebuyers with less available cash and slightly lower credit scores back into the housing market.

Harlan Green © 2021

Follow Harlan Green on Twitter: https://twitter.com/HarlanGreen

Tuesday, July 20, 2021

How Do We Ease our Workload?

 Financial FAQs

occupydemocrats.com

Why do Americans worker harder with longer hours than in other developed countries? And why is America’s income inequality the worst in the developed world?

Both questions can be quickly encapsulated by NY Times’ columnists Bret Stephens and Gail Collins in a back and forth Q&A opinion column.

To Gail Collins question whether Stephens was still enthusiastic about Joe Biden’s big spending initiatives, he said he liked most of them, but:

“…the program I most oppose is the child tax credit, which sounds like liberal nirvana but would be difficult to administer and has no work requirements, which effectively reverses the gains the country made after Bill Clinton’s welfare reform. I’m also not too fond of the huge Medicare expansion, another noble-sounding effort that will further push a financially strained program toward insolvency.”

Stephens in this case repeats the conservative mantra that government-paid benefits strain the taxpayers’ coffers, and discourage work. But in reality, he is parroting conservatives’ opposition to any public spending that grows government programs, which is the reason Americans have been deprived of the welfare benefits of other developed countries—e.g., universal health care, paid family leave, a livable minimum wage, and nationally mandated paid vacations.

Denmark is probably the best example of what modern technology has enabled to ease the workloads of working folk, with its $20 per hour minimum wage and 33-hour average work week.

Whereas, according to NY Times guest columnist Bryce Covert, “Prepandemic, nearly a third of Americans clocked 45 hours or more every week, with around 8 million putting in 60 or more. While Europeans have decreased their work hours by about 30 percent over the past half century, ours have steadily increased.”

EPI.org

There is no secret where the increased wealth generated by modern technology has gone in the US; to the owners of capital—stock holders, CEOs, and financial entities that hold their debt—rather than wage-earning employees.

Why? It has been outright wage suppression since the 1980s, at least, as the Federal Reserve under Paul Volcker fought any form of incipient inflation by tightening credit, which largely suppressed wage growth while Big Business began its lobbying campaigns to enact anti-labor legislation that weakened unions’ collective bargaining efforts.

Much of the anti-government rhetoric came under the guise that government was less efficient in producing overall wealth than the private sector. The pandemic is also bringing another problem to light that requires more government oversight—more work from home in an expanded ‘gig’ economy.

Steven Hill in an article for Project Syndicate, says “According to an April 2020 survey in the United States, 74% of companies are planning to “shift some employees to remote work permanently.” Similarly, a May 2020 analysis by researchers at the Federal Reserve Bank of Atlanta found that companies expect the share of working days spent at home to increase threefold, with many employees operating remotely 1-3 days per week.”

Working from home or other sites away from the office will hurt employees in so many ways without a government that clearly defines these new working conditions—because it blurs the line between regularly employed workers with clearly defined benefits and independent contractors that must provide their own safety net (e.g., healthcare, hours worked), for starters.

What does all this ultimately lead to? More work will be performed by algorithms and robots, of course, which can easily be trained to perform repetitive, predictable tasks.

“Historically, researchers have found that automation is adopted faster during economic downturns, and the COVID-19 recession was no exception. At the height of the crisis in advanced economies, the bots appeared to be making major advances,” says Hill.

“The net effect of this technological adoption over time will be to render more humans obsolete. Yes, some experts predict that new jobs will be created to service the robots and artificial-intelligence (AI) systems. But whether those jobs will be as numerous, pay as much, or be of the same quality as previous jobs remain open questions.“

So we have it in a nutshell. America will have to find new ways to benefit workers in this new economy, as other developed countries are doing—i.e., with the help of their governments working for them, rather than for Big Business.

Harlan Green © 2021

Follow Harlan Green on Twitter: https://twitter.com/HarlanGreen

Monday, July 19, 2021

Retail Sales Splurge Won't Last

 Popular Economics Weekly

Calculated Risk

“Advance estimates of U.S. retail and food services sales for June 2021, adjusted for seasonal variation and holiday and trading-day differences, according to the US Census Bureau, but not for price changes, were $621.3 billion, an increase of 0.6 percent from the previous month, and 18.0 percent above June 2020.”

Consumers have been spending like there’s no tomorrow since January, but how long can that continue with the coronavirus Delta variant causing infection rates to soar among the unvaccinated?

COVIDTracker

Retail sales should continue to decline from current nosebleed levels, since surveys show that consumers are most worried about a COVID-19 resurgence.

The CDC reports that “the current 7-day moving average of daily new cases (26,306) increased 69.3% compared with the previous 7-day moving average (15,541). The current 7-day moving average is 89.6% lower than the peak observed on January 10, 2021 (251,880) and is 129.3% higher than the lowest value observed on June 20, 2021 (11,472). A total of 33,797,400 COVID-19 cases have been reported as of July 14.”

Households are still buying plenty of goods, but they have shifted their spending toward services they avoided during the pandemic, “dining out, entertainment, travel, vacation trips and so forth,” reported MarketWatch.

And this is where any future super-spreader events will occur. That is why the US Surgeon General is saying masks should again be worn in crowded indoor locations with poor ventilation—such as bars and restaurants. This will certainly cause consumers to take notice.

Take bars and restaurants, the only category in the monthly retail report that involves services. Sales jumped 2.3 percent in June, the government said Friday, and rose sharply for the fourth month in a row. And through the first six months of 2021 receipts are up almost 38 percent.

We know consumers also would have bought more new cars and trucks last month, but automakers cannot produce enough of them because of a shortage of computer chips. Semiconductors are now a critical component in modern vehicles.

Another hit to higher retail sales could be a reluctance for more workers to return to work. I reported last week that the job-listing site Indeed did a 5,000 person survey that gave an additional reason why workers are reluctant to return to work.

“Among the unemployed, concern about COVID-19 is the most commonly cited reason for a lack of urgency in looking for work,” wrote Nick Bunker, the economic research director for North America at the Indeed Hiring Lab, in a blog post on the survey results. Some 23% of unemployed people said fear of the virus was keeping their job search “non-urgent.”

So it may be that retail sales return to the five percent average that has prevailed since the early 1990s (see Calculated Risk graph), as the pandemic stimulus payments subside.

Retail sales comprise roughly 50 percent of consumer spending, so its trend may mirror how long this post-pandemic prosperity will last, which in turn depend on how quickly product shortages end, and future job prospects in an economy that is vastly changed since January of last year.

Harlan Green © 2021

Follow Harlan Green on Twitter: https://twitter.com/HarlanGreen

Thursday, July 15, 2021

Why Keep Interest Rates This Low?

 Financial FAQs

FREDPersavings

Inflation isn’t yet a problem, but are very low interest rates becoming a problem? Interest rates have been at record lows for years, thanks to the Federal Reserve that has been buying up enough bonds and mortgage securities to hold down longer-term rates as well. Is that good for most of US, or just the wealthy?

Fed chair Jerome Powell has stated it is to encourage a return to full employment by keeping the cost of borrowed money as low as possible. But this policy has mostly boosted assets owned by higher-income earners rather than wage-earners.

A recent NYTimes Op-ed by banking analyst Karen Petrou says just 10 percent of Americans own most stock assets that have benefited from the cheap money and approximately 60 percent of households own homes with values rising in double digits over the past year from record low mortgage rates.

The rest of US with less cash to spare must rely on accumulating unspent income in less risky, federally insured savings accounts that do not ride the boom-and-bust cycles of American-style capitalism.

The personal saving rate has spiked of late (see FRED graph) because consumers had little to buy until now, but that is transitory with the sudden re-opening of businesses causing inflation indicators to rise sharply.

Such an inflation spike is also transitory, said Fed Chair Powell in his latest congressional testimony.

“Inflation has increased notably and will likely remain elevated in coming months before moderating,” Powell said, in testimony delivered to the House Financial Services panel.

Ms. Petrou wants the Fed to raise interest rates sooner to encourage savings that would benefit wage-earners, she says, and mitigate some of the inflation that dampens consumer demand. She uses the example of investing $10,000 in stocks vs. saving money conventionally since 2007. Savers would have lost money after inflation with just a savings account.

I must say this Fed is doing a welcome about face from the Paul Volcker led Fed of the 1980s and 90s that raised interest rates at the slightest hint of inflation, thus tamping down wage growth while benefiting Wall Street investors. It was trickle-down economics on a tear.

“These corporate and policy decisions had the most adverse consequences for low- and middle-wage workers,” said a recent EPI labor think-tank research paper on the roots of inequality, “who are disproportionately women and minorities, the groups whose legacy of being discriminated against in labor markets means that they especially need low unemployment, unions, strong labor standards, and policy supports for leverage when bargaining with employers.”

It is difficult to credit Ms. Petrou with much insight into what benefits ordinary wage-earners. Higher interest rates will certainly deflate stock and bond values that rely on cheap borrowed money to reach today’s highs (stocks) and lows (bond yields) and increase the propensity to save, but how much can wage-earners save without higher incomes?

She is a bank analyst, after all, who will want to buttress lenders’ bottom line that increases profits with rising interest rates. And American’s historical savings’ rates of 5-10 percent should continue that have been in line with that in other developed countries.

The best way to increase the wealth of wage-earners, vs. wealth-owners is to boost their incomes, which in turn would increase wage-earners' wealth. Use governmental policy to increase labor’s collective bargaining position that has been severely weakened and rescind much of the anti-labor legislation that has created some 26 right to work states that do not require workers to pay dues to the union shop that benefits them.

The same credit tightening debate happened in 1937 when there was as much unemployment, by the way. President Roosevelt caved to Republicans that wanted to re-balance the federal budget after so much New Deal spending. But in cutting back on government support and raising borrowing costs prematurely, the 1930’s economy went  into a second recession, and became the Great Depression.

Harlan Green © 2021

Follow Harlan Green on Twitter: https://twitter.com/HarlanGreen

Thursday, July 8, 2021

Too Many Jobs to Fill?

 Popular Economics Weekly

 Calculated Risk

There are too many job vacancies at the moment, per the Labor Department’s JOLTS report; though it actually signals that  businesses seem to want workers back for the same old jobs, but there’s now a mismatch.

Many workers no longer want the ‘same old’ jobs, and are using the pandemic break to find work more to their liking.

“The number of job openings (yellow line in graph) was little changed at 9.2 million on the last business day of May, the U.S. Bureau of Labor Statistics reported today. Hires (dark blue line) were little changed at 5.9 million. Total separations decreased to 5.3 million. Within separations, the quits rate decreased to 2.5 percent. The layoffs and discharges rate (red column), while little changed over the month, hit a series low of 0.9 percent.”

Quits (light blue column) are generally voluntary separations initiated by the employee, says the BLS. Therefore, the quits rate can serve as a measure of workers’ willingness or ability to leave jobs. Layoffs and discharges are involuntary separations initiated by the employer.

Although the U.S. created 850,000 new jobs in June, it would take more than a year at that rate to restore employment to pre-pandemic trends, says MarketWatch’s Jeffry Bartash.

“The competition for workers has given jobseekers the upper hand. A record 4 million people quit two months ago — most to take a better or better-paying job. That’s nearly double the number of people quitting a year earlier.”

White House chair of economic advisors Cecilia Rouse summarized the jobs picture. Employment remains 6.8 million jobs below our pre-pandemic level, she says. Looking at the three-month average, most of the jobs are going to leisure and hospitality, adding 326,000 jobs on average over the last three months. Government has added about 100,000 jobs on average.

White House

And the job-listing site Indeed did a 5,000 person survey that gave an additional reason why workers are reluctant to return to work.

“Among the unemployed, concern about COVID-19 is the most commonly cited reason for a lack of urgency in looking for work,” wrote Nick Bunker, the economic research director for North America at the Indeed Hiring Lab, in a blog post on the survey results. Some 23% of unemployed people said fear of the virus was keeping their job search “non-urgent.”

The unemployed workers said they will be more interested in getting back to work after they see certain milestones happen, such as more job opportunities, more vaccinations, and school starting up in the fall, the Indeed survey found. 

This will mean a huge shift in the job market: More jobs in the service sector (see White House graph)—in government, professionals services and in leisure and hospitality—and fewer new job in the remaining higher-paying manufacturing and even white collar administrative jobs when AI and 5G networks really kick in.

Harlan Green © 2021

Follow Harlan Green on Twitter: https://twitter.com/HarlanGreen

Thursday, July 1, 2021

Consumer Confidence, Home Prices Soar For How Long?

Financial FAQs

Conference Board

Consumer confidence is at record highs, as growing numbers of consumers believe the roaring 2020’s recovery is here to stay. And it’s also sending home price increases to record highs. But this isn't another housing bubble. Too few homes are being built rather than too many, as builders try to catch up to the decades-long housing shortage, which could take another decade.    

“Consumer confidence increased in June and is currently at its highest level since the onset of the pandemic’s first surge in March 2020,” said Lynn Franco, Senior Director of Economic Indicators at The Conference Board. “Consumers’ assessment of current conditions improved again, suggesting economic growth has strengthened further in Q2. Consumers’ short-term optimism rebounded, buoyed by expectations that business conditions and their own financial prospects will continue improving in the months ahead.“

The Case-Shiller home price index increased 14.6 percent in April, as it runs a 3-month average for same-home sale prices. This is that best of all worlds with demand so high. Current interest rates are below the inflation rate, so mortgages held longer term really have zero or negative yields, which means actual inflation shows up in housing prices.

“Phoenix, San Diego, and Seattle reported the highest year-over-year gains among the 20 cities in April,” said Case-Shiller. “Phoenix led the way with a 22.3% year-over-year price increase, followed by San Diego with a21.6% increase and Seattle with a 20.2% increase. All 20 cities reported higher price increases in the year ending April 2021versus the year ending March 2021.”

“In fact, the proportion of consumers planning to purchase homes, automobiles, and major appliances all rose—a sign that consumer spending will continue to support economic growth in the short-term. Vacation intentions also rose, reflecting a continued increase in spending on services,” said the Conference Board.

Consumers’ assessment of the labor market also improved. The Conference Board graph shows that jobs plentiful minus jobs hard to get blue line is soaring, with 54.4 percent of consumers said jobs are “plentiful”, up from 48.5 percent, and 10.9 percent of consumers claimed jobs are “hard to get”, down from 11.6 percent.

Conference Board

This is no wonder, as economists are predicting 9-10 percent GDP growth in Q2, and maybe six percent plus for all of 2021, before returning to a more normal growth pattern.

The American Rescue Plan has inserted $1.9 trillion into the U.S. economy, and Repubs and Democrats have agreed on an additional $1 trillion for infrastructure and other much needed physical improvements that will create more high-paying jobs.

So why shouldn’t consumers be this optimistic for awhile?

Harlan Green © 2021

Follow Harlan Green on Twitter: https://twitter.com/HarlanGreen