Thursday, September 30, 2010

Home Prices Still Rising

The Mortgage Corner

The S&P/Case-Shiller Home Price Index, a leading measure of U.S. same-home prices, show that the 10-City Composite is up 4.1 percent and the 20-City Composite is up 3.2 percent from where they were in July 2009, though the annual increases slowed in July compared to June 2010.

clip_image002

In fact, 12 cities’ prices are higher than July 2009, with the largest increases in San Francisco, San Diego, Los Angeles, and Washington, as those markets continue to grow. The largest year-over-year declines were in Las Vegas, Tampa, and Charlotte, NC.

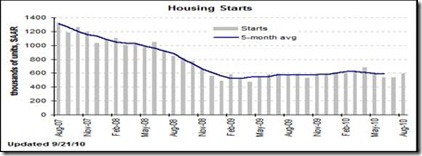
The best news on housing showed up in the housing starts report. Housing construction was unexpectedly strong in August as starts jumped 10.5 percent after rising a modest 0.4 percent in July.  The August annualized pace of 0.598 million units sharply topped analysts’ expectations for 0.550 million units and is actually up 2.2 percent on a year-ago basis.

clip_image006

NAR chief economist Lawrence Yun said, “The housing market is trying to recover on its own power without the home buyer tax credit. Despite very attractive affordability conditions, a housing market recovery will likely be slow and gradual because of lingering economic uncertainty”.

The gain in August was led by a 32.2 percent surge in multifamily starts, following a 36.0 percent increase in July.  The single-family component rebounded a far more moderate 4.3 percent after dipping 6.7 percent in July. 

This appears to be a pattern elsewhere—the single-family component is not showing as much life as the multifamily component. The bottom line, says Econoday, is that the starts report was probably better news for construction workers than for real estate brokers.

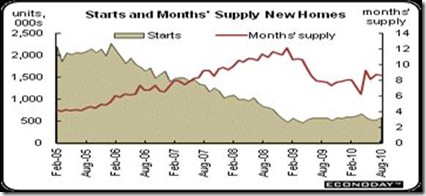
We are seeing very little bounce in new home sales following the drop in May after the April deadline for special tax credits.  New home sales were unchanged in August at a 288,000 annual unit rate but were up from the initial estimate for July of 276,000. With the exception of June sales coming in at 312,000, recent months have been only barely above the series low of 282,000 set in May of this year.

clip_image008

Further proof that the lower end of the market has weakened was that the FHFA price index for existing homes with conforming loan amounts to $417,000 had slipped further. House prices are back on a downtrend after tax credit induced gains earlier in the year. The Federal Housing Finance Agency’s (FHFA) purchase only house price index slipped 0.5 percent in July after declining a revised 1.2 percent the month before. FHFA said the downward revision was due to much weaker prices late in the month that had not yet been reported. Prices had risen over the February through April period as purchases heated up prior to the end of April deadline for qualifying for special tax credits. But distressed sales have been rising, and RealtyTrac says now make up 25 percent of all existing-home sales.

The NBER’s Business Cycle Dating Committee decided the Great Recession ended in June 2009 and, "The committee decided that any future downturn of the economy would be a new recession and not a continuation of the recession that began in December 2007. The basis for this decision was the length and strength of the recovery to date."

So why did it take so long to make that announcement? Because it was looking at quarterly data, rather than monthly data to even out the swings. And since GDP data is quarterly, GDP began to grow again in June. But the NBER apparently wanted to wait 6 quarters—18 months—to make sure it wouldn’t dip again. It also shows how extreme were the job losses—much worse than in 2001.

clip_image010

The Fed really has no choice but to continue to stimulate growth, as that is the only way we will dig ourselves out of debt without greater job formation. Cutting spending also cuts revenues, digging us deeper into the whole.

Harlan Green © 2010

Friday, September 24, 2010

Home Sales Are Rising—In Spite of Bad News

The Mortgage Corner

In spite of all the bad news—higher foreclosures (one Florida home foreclosed on that didn’t even have a mortgage!), falling prices, and record lower mortgage rates—buyers still want their dream home, say several reports.

Existing Home sales, which are completed transactions that include single-family, townhomes, condominiums and co-ops, increased 7.6 percent to a seasonally adjusted annual rate of 4.13 million in August from an upwardly revised 3.84 million in July, but remain 19.0 percent below the 5.10 million-unit pace of one year ago.

clip_image002

NAR chief economist Lawrence Yun said, “The housing market is trying to recover on its own power without the home buyer tax credit. Despite very attractive affordability conditions, a housing market recovery will likely be slow and gradual because of lingering economic uncertainty”.

There is no uncertainty about housing affordability, however, which is still hovering near its record high in spite of a 12 percent price rise in the median existing-home price, according to the Realtors. This is because 30-year fixed mortgage rates have dropped to 4.125 percent for conforming, 4.375 percent for so-called super conforming loans to $727,750, so that just a $37,392 annual income is need to qualify for a median-priced home with 20 percent down. This is 30 percent less than the income required to qualify in 2007.

Yun added, “Affordability could reach a generational high in the second half of this year because of rock-bottom mortgage interest rates, helped partly by the Fed’s very accommodative monetary policy. The loan underwriting standards are tighter, but home buyers can improve their chances of getting a loan by staying well within their budget.”

Total housing inventory at the end of August slipped 0.6 percent to 3.98 million existing homes available for sale, which represents an 11.6-month supply at the current sales pace, down from a 12.5-month supply in July.

clip_image004

“Home values have shown stabilizing trends over the past year,” said Dr. Yun, “even as the economy shed millions of jobs, because of the home buyer tax credit stimulus. Now that the economy is adding some jobs, the housing market needs to steadily improve and eventually stand on its own.”

Pending home sales in July also rose 5.2 percent to 79.4 based on contracts signed in July from a downwardly revised 75.5 in June, but remains 19.1 percent below July 2009. The data reflects contracts and not closings, which normally occur with a lag time of one or two months, indicating better numbers for future existing-home sales.

And first-time home buyers, a growing segment of the housing market, are contributing to an increase in demand for smaller and less expensive new homes, according to research from economists at the National Association of Home Builders (NAHB). A recent biennial American Housing Survey, which was conducted by the Department of Housing and Urban Development and the Census Bureau in 2009 finds that 41 percent of the 8.4 million households who bought a home between 2007 and 2009 were first-time buyers.

The market share of first-timers was up from 35 percent in both 2005 and 2007. Although some of the demand was fueled by the initial version of the home buyer tax credit in mid-2008, which was specifically targeted to those buying a home for the first time, the upward trend is expected to continue as children of baby boomers -- members of a generation that is larger than their parents' -- move into their household formation years in the period ahead.

"Builders are increasingly gearing their homes to the needs of first-time buyers, and we expect the trend to continue in the period ahead as the economy begins generating more jobs and more people in their 20s form households," said Chairman Bob Jones of NAHB.

Housing won’t truly stabilize until the foreclosure rate has dropped significantly, and there are still too many in the 90-day late category of mortgage delinquencies. So there may be another spike in foreclosures, as banks clear their books of bad loans. The new Basel III capital requirements were less than feared, which frees up more bank capital, and so banks may be gearing up to do business as usual again.

Harlan Green © 2010

Wednesday, September 22, 2010

The Recession is (Really) Over

Popular Economics Weekly

The Great Recession is officially over. We really can breathe a sigh of relief—even though job formation is just now picking up, while major segments are still stagnating; such as real estate, and motor vehicle production. But stocks continue to rally, manufacturing is recovering, and exports are soaring.

The National Bureau of Economic Research (NBER), a non-profit panel of leading economic professors, said it actually ended in June of 2009, which is where this columnist saw it ending, as that was when overall output began to pick up.  But that is small comfort to those still out of work.

The announcement is still good news, as it may cancel out the pessimists who say we are still in a recession, or those who say we must begin to cut the deficit when the private sector isn’t yet creating enough jobs. And that will make a difference to consumers, most of who know little about economic signs, and so have to rely on their basic optimism or pessimism about future prospects in making their financial decisions.

The NBER said its determination of the recession's end does not mean the U.S. is now healthy.

"In determining that a trough occurred in June 2009, the committee did not conclude that economic conditions since that month have been favorable or that the economy has returned to operating at normal capacity, NBER said. "Rather, the committee determined only that the recession ended and a recovery began in that month."

It was an 18-month recession, the longest in fact since the 1929-33 first Great Depression, which lasted 43 months. This is why the economy is taking so long to recover. In other words, it began to contract in December 2007, the official beginning of the recession, and the contraction ended in June 2009.

That is probably the reason the press release of the Fed’s Open Market Committee (FOMC) latest meeting hinted at more credit easing in the fall, as it sees a danger of actual deflation, rather than lower inflation. Deflation is the danger most feared by economists at present, since lower prices also mean stagnant economic growth as well.

"Measures of underlying inflation are currently at levels somewhat below those the Committee judges most consistent, over the longer run, with its mandate to promote maximum employment and price stability", said the release.

The "somewhat below" language is in contrast to “measures of inflation have trended lower" in the previous statement, said Econoday. With inflation below the Fed's implicit inflation target, the Fed appears to be stating that inflation is too low, which was the case in 2002, when the Fed was faced with the same dilemma. So the Fed is saying that the deflation risk is higher than the re-inflation risk and the door is now open to additional quantitative easing.

Why is some inflation important? It would mean there is sufficient demand for products and services to warrant expanding production, which means consumers are willing to increase their spending, in a word. Decades-long deflation is why the Japanese economy is no longer the Asian Tiger, with China taking its place as the world’s second-largest economy behind the U.S.—at least on paper.

There was some good news on the housing front, which could signal that the housing bubble is finally bottoming out. Housing starts in August jumped 10.5 percent after rising a modest 0.4 percent in July. The August annualized pace of 598,000 units clearly topped analysts' expectations for 550,000 units and is actually up 2.2 percent on a year-ago basis. The gain in August was led by a 32.2 percent surge in multifamily starts, following a 36.0 percent increase in July. The single-family component rebounded 4.3 percent after dipping 6.7 percent in July.

clip_image002

The August Consumer Price Index reading confirms why the Fed is concerned about deflation. Year-on-year, overall CPI inflation slipped to 1.2 percent (seasonally adjusted) from 1.3 percent in July. The core rate in August was steady at 1.0 percent. These numbers are well below the bottom of the Fed’s implicit target range for inflation of 1-1/2 to 2 percent for the PCE price index, which this writer believes should be raised to 2-1/2 to 3 percent to encourage higher salaries—which are two-thirds of product costs, as we have said.

clip_image004

So will the latest news lift consumers’ spirits? Firstly, prices have to stop falling, so that employers will be encouraged to hire. That is why further stimulus measure are so important. We cannot afford to repeat Japan’s experience, and so lose our place as the world economic leader.

Harlan Green © 2010

Friday, September 17, 2010

Consumers Are Reviving

Popular Economics Weekly

Consumers may be finally waking up out of their long debt-laden slumber. There is a quickening of the economic pulse from several indicators that indicate the long drought may be over—for jobs, as well as the pervading pessimism characterized by economist Robert Shiller and others.

For starters, retail sales jumped 0.4 percent and are up more than 3 percent in a year. The rebound in July was led by a 1.9 percent gain in gasoline station sales with food & beverages up 1.3 percent and clothing up 1.2 percent. Also showing increases were health & personal care, sporting goods & hobby stores, general merchandise, nonstore retailers, and food services & drinking places.

clip_image002

Weakness was led by a 1.1 percent fall in electronics & appliances and a 0.9 percent decline in miscellaneous stores. Motor vehicle & parts dealers decreased 0.7 percent while furniture & home furnishings slipped 0.5 percent. Building materials and garden equipment sales were flat.

Today's report adds ammunition to the argument that there will be no double dip, says Econoday. A consumer sector that is posting moderate gains in spending will likely support continued modest growth in the recovery. It's certainly not gangbusters, but the news is welcome relief for those worried about the economy becoming too sluggish or turning negative again.

And consumer debt may be plummeting to a level that makes them comfortable to spend again. Consumer credit contracted for the sixth month, down $3.6 billion in July. Revolving credit fell $4.4 billion, offset in part by a $0.8 billion rise in nonrevolving credit that got a boost from July's strength in car sales. Yet the secular decline in revolving credit is what's most important, reflecting the fundamental shift in the consumer who, hit by a weak labor market and lack of confidence in the economy, is less able and less inclined to fund discretionary purchases with a credit card.

The key is total debt to household income ratios that the Fed publishes. It is now 15.93 percent of household income, back to Q3 of 2002 level, from 17.64 percent in Q1 of 2008. And in fact absolute household debt has contracted even faster, as household incomes (the denominator of equation) have been declining as well.

clip_image004

Much of consumer behavior is controlled by their feelings—consumer confidence, in a world where the future is becoming harder to predict—as is the outlook for jobs.

Initial claims for unemployment insurance came in at 450,000 for the September 11 week for the lowest total since July (prior week revised to 453,000). The four-week average posted its sharpest decrease of the year, down 13,500 to a 464,750 level that is about 20,000 lower than mid-month August. This comparison points to strength for monthly payrolls.

clip_image006

That, and other indicators show a tremendous pent-up demand for skilled workers is developing. For example, the international accounting firm Deloitte-Touche just announced they will be hiring 50,000 new employees per year over the next five years. With 169,000 people in over 140 countries, Deloitte member firms already serve more than 80 percent of the world's largest companies as well as large national enterprises, public institutions and successful fast-growing companies, says its website. So this announcement is definitely a bullish indicator for both consumer attitudes and future economic growth.

Harlan Green © 2010

Tuesday, September 7, 2010

Great Inequality Causes Great Recessions

Financial FAQs

We are living in an era of the greatest income inequality since the Depression. So how do we cope with it? It is perhaps the major cause of our Great Recession, as it was the cause of our Great Depression.

Thomas Piketty and Emmanuel Saez among others have documented it (See Feb. 2003 Quarterly Journal of Economics), as we discussed in a past column. The Center for Budget and Policy Priorities (CBPP), a non-partisan think tank, using Piketty and Saez data, documents that income and asset inequality has risen to levels last seen in the 1920s (see graphs).

clip_image002

clip_image004

Income disparities before that crisis and the recent one were the greatest in approximately the last 100 years, according to Harvard Professor David Moss, who is among a small group of economists, sociologists and legal scholars trying to discover if income inequality contributes to financial crises. In 1928, the top 10 percent of earners received 49.29 percent of total income. In 2007, the top 10 percent earned a strikingly similar percentage: 49.74 percent. In 1928, the top 1 percent received 23.94 percent of income. In 2007, those earners received 23.5 percent.

Clinton Labor Secretary Robert Reich in a recent New York Times’ op-ed has also been vocal about its dangers, as we said last week. “The national economy isn’t escaping the gravitational pull of the Great Recession,” he writes. “None of the standard booster rockets are working: near-zero short-term interest rates from the Fed, almost record-low borrowing costs in the bond market, a giant stimulus package and tax credits for small businesses that hire the long-term unemployed have all failed to do enough.”

So, “It’s no coincidence that the last time income was this concentrated was in 1928.” Professor Reich hedges his bets, however. “I do not mean to suggest that such astonishing consolidations of income at the top directly cause sharp economics declines. The connection is more subtle.”

This debate goes back to the Great Depression, as we have also said in past columns, when Roosevelt’s Federal Reserve Chairman Marriner Eccles maintained that income inequality was a major cause of the Great Depression:

“… a giant suction pump had by 1929-30 drawn into a few hands an increasing portion of currently produced wealth. This served them as capital accumulations. But by taking purchasing power out of the hands of mass consumers, the savers denied to themselves the kind of effective demand (my italics) for their products that would justify a reinvestment of their capital accumulations in new plants. In consequence, as in a poker game where the chips were concentrated in fewer and fewer hands, the other fellows could stay in the game only by borrowing. When their credit ran out, the game stopped.”

By effective demand, Eccles was referring to what economists today define as aggregate demand. Eccles was maintaining that the growth in income inequality created a credit bubble that burst and so led to an sharp diminishment in aggregate demand, which is measured by our Gross Domestic Product.

The relationship is intuitively simple, yet was hard to verify before Piketty and Saez, et.al., did their research. As more income flowed to the top income brackets, middle and lower income classes had to borrow more to keep up their consumption patterns. And the easy credit available with the housing bubble accelerated that borrowing, to the tune of $2.3 trillion extracted from housing in the last decade. But then the excess of supply produced during the bubble caused housing values to crash, losing more than $4 trillion and counting of the $11 trillion in housing assets.

Professor Reich says we have to find ways to raise the wages of working people—the 90 percent who have suffered stagnant wages since the 1970s. Lowering payroll taxes for the lowest income earners who spend most of their incomes, while restoring the Clinton era taxes on those earning more than $250,000 is the most discussed remedy for such income disparity.

Another remedy is more stimulus spending. Nobelist Paul Krugman warns that without more stimulus we will have turned the clock back to 1938, when Roosevelt was faced with the same dilemma. He thought the economy had recovered sufficiently to cut deficit spending in order to balance the Federal budget. The country was against more stimulus spending then, as now, and Democrats lost 70 seats in the 1938 election. But that only precipitated the second stage of the Great Depression, which was cured by the tremendous deficit spending of WWII.

And deficit spending in fact works during extreme downturns. Because it stimulates economic growth and some inflation, which history documents is the only way to increase revenues enough to pay down such monumental debt. Krugman documents this with a graph of Depression-era debt compared to debt as a percentage of GDP. It shows that government deficit spending actually boosted economic growth (GDP) enough to lower total debt as percentage of GDP from 1933 to 1947, when the federal deficit grow to 150 percent of GDP. Why? Because it boosted revenues, whereas debt reduction measures during the Hoover Administration decreased revenues from 1929 to 1933.

clip_image006

Unfortunately, it does look like such ‘structural’ unemployment as we have—due to so many jobs going overseas—will keep unemployment high for years if not decades to come. And so a better social safety net similar to that of the rest of the developed world will have to be developed to even the playing field of rich vs. poor. Even Wall Street and Big Business will eventually recognize that it is good business to put more money into the pockets of those who spend it.

No country can care for its citizens without predictable financial markets, and a stable, growing economy.

Harlan Green © 2010

Saturday, September 4, 2010

A Dream House Still Possible

The Mortgage Corner

Professor Karl E. Case, co-author of the S&P Case-Shiller Home Price Index, wrote a most interesting New York Times op-ed piece recently that said a dream house is still possible. In spite of all the bad economic news, if one focuses on the fundamentals, then this should be the best time ever to buy a home. And the latest Pending and Existing-home sales show some recovery from a sharp sales drop after the homebuyer tax break expiration.

Dr. Case said in essence that with record low interest rates and a 30 percent average drop in home prices, now is the time to invest in a home. His example, a $300,000 home purchase with 20 percent down, showed that in 2 years the monthly mortgage payment almost halved—from $1533 to $833—and with prices down 30 percent, the down payment was $17,400 less.

The Case-Shiller Index for June showed price improvement in 17 of 20 cities, with San Francisco highest, and Las Vegas still at the bottom. So why is the market stagnating at present, he asks? As of last November, sales had hit an annual rate of 6.5 million, with even new construction beginning to revive, but the rate has dropped more than 1 million since then.

clip_image002[8]

Expiration of the homebuyer tax credit is just one factor. Dr. Case suspects that the predicted new household formation of 1 to 1.5 million per year hasn’t yet happened—mainly because of the severity of this recession. With unemployment still high, young adults may be staying longer at home, while immigration is being restricted.

Also, the Pending Home Sales Index, a forward-looking indicator, rose 5.2 percent to 79.4 based on contracts signed in July, but remains 19.1 percent below July 2009 when it was 98.1. The data reflects contracts and not closings, which normally occur with a lag time of one or two months.

NAR chief economist Lawrence Yun supported Dr. Case’s argument. He said, “Affordability could reach a generational high in the second half of this year because of rock-bottom mortgage interest rates, helped partly by the Fed’s very accommodative monetary policy. The loan underwriting standards are tighter, but home buyers can improve their chances of getting a loan by staying well within their budget.”

The other unknown is the depth of consumer discontent, which drives so much of consumer buying. “The steady drip of bad news about the economy has sapped the confidence of buyers,” said Dr. Case. “And there is no understating the importance of expectations and confidence in this industry.”

The Conference Board's August consumer confidence index did rise 2-1/2 points from July, but August's 53.5 level is still down almost 10 points from May (July revised six tenths higher to 51.0). More say jobs are hard to get, at 45.7 percent of the sample's initial 3,000 respondents vs. July's 45.1 percent for the worst reading since February. Again, direction is a special concern as pessimism has increased over the past two months.

clip_image004

But Case-Shiller has their own sentiment survey, which polls San Francisco, Los Angeles, Milwaukee, and Boston homeowners, “asking them what they think is likely to happen to the value of their houses over the next year,” says Dr. Case. Values were expected to remain basically flat in the 08 and 09 surveys, but homebuyers anticipate a gain of 5.2 percent in the next year.

So a fragile optimism is returning, but dependent on very many factors. “The American Dream is not dead,” said Dr. Case. “It’s just taking a well-deserved rest.”

Harlan Green © 2010

The Jobs Are Coming

Popular Economics Weekly

The August unemployment report supported both sides of the stimulus debate. Democrats said it showed more stimulus was needed, while Republicans said employers were holding back because of too much government—too many regulations and a soaring deficit meant higher taxes down the road.  Yet jobs are returning, in spite of the political gridlock. But with all the doom and gloom, one has to look closely at the numbers to see this.

Overall payroll employment fell 54,000 for the third straight month in August, though there was a moderate gain in the private sector, with private job hiring rising 67,000. Also on the positive side, wages were up. And the companion Household Data survey that actually computes the unemployment rate (9.6 percent) showed 886,000. additional “private wage and salary workers in all nonagricultural industries except private households”. And the May-August monthly average of 285,000 was only slightly down from the January-April average of 328,000. It tracks the self-employed as well as payroll workers, hence may be a more accurate measure of employment.

In fact, there is no evidence that a fear of higher taxes (for the wealthiest) deters employers or consumers. More than 23 million jobs were created during the Clinton years, when tax rates for the wealthiest were higher.  This brought the unemployment rate below 5 percent and the first budget surplus in a generation by 1998. Everyone is hewing to their ideological lines during this election year, in other words, regardless of the realities.

clip_image002

The realities are that employers are trying to squeeze maximum profits from their existing workforce, but that is no longer working. The best evidence for this is the latest labor productivity report that indicated very little additional output was coming from the existing workforce while labor costs were rising. Ergo, workers want more pay and benefits for even a small additional increase of output. And so employers must begin to hire more workers, if they want to keep their productions costs down.

Average hourly earnings improved to 0.3 percent from up 0.2 percent in July. The August number topped the market estimate for a 0.1 percent gain. The average workweek for all workers was unchanged at 34.2 hours in July. The market forecast was for 34.2 hours.

clip_image004

But incomes are still barely rising, which is hurting demand for more goods and services. Due to the slowdown in output and businesses already having cut labor costs to the bone, productivity fell notably in the second quarter. Nonfarm business productivity declined an annualized 1.8 percent in the second quarter after a 3.9 percent advance in the prior quarter.

Unit labor costs (i.e., costs per worker) rebounded an annualized 1.1 percent in the second quarter, following a drop of 4.6 percent in the first quarter. Year-on-year, productivity was up 3.7 percent in the second quarter-down from 6.3 percent in the previous quarter. This is still a good number, and way above the longer term 2.5 percent productivity growth average.

So where and when will employers hire enough workers to begin to bring down the current 9.6 percent unemployment rate? They would have to more than double current numbers—to 125-150,000 new payroll jobs per month just to keep up with new workers entering the jobs market, according to the Establishment payroll survey.

Both the manufacturing and service sectors are still expanding, per the Institute of Supply Management (ISM), with manufacturing activity up most in the August survey. Private service providing jobs rose 67,000 after a 70,000 boost in July, with a 45,000 boost in education & health services, and health care is up 40,000. Goods-producing jobs were unchanged in August after a 37,000 advance in July, but that will probably also rise next month, with the new ISM data.

So we know that employers will begin hiring again, with the continued growth in both sectors, but without rising wages it won’t boost economic growth. More stimulus is needed, such as better social safety net programs for those who have to accept jobs for lesser pay during recessions—which is one reason demand has fallen so sharply during this recession?

One suggestion from former Labor Secretary Robert Reich is an “earnings insurance” that will pay the difference between old and new salaries for 2 years, similar to Germany’s, which has kept their unemployment rate around 8 percent. It would be cheaper than extended unemployment insurance, he maintains, and put more people back to work.

The bottom line is as Professor Reich says in his most recent New York Times op-ed—income inequality today equals that of 1928. And in both 1928 and 2008, the richest 1 percent of American households took in 23.5 percent of total income, whereas it was just 9 percent in the 1970s. The median (i.e., middle class) male worker earns less today when adjusted for inflation that he did 30 years ago. No economy can grow unless we bring back the middle class, in other words.

Harlan Green © 2010