Friday, May 31, 2019

US Economic Growth Continues For How Long?

Popular Economics Weekly


Real gross domestic product (GDP) increased at an annual rate of 3.1 percent in the first quarter of 2019, according to the Bureau of Economic Analysis. It was "second" estimate released by the Bureau of Economic Analysis. In the fourth quarter, real GDP increased 2.2 percent.

The growth is confounding some economists, as Q1 growth has been weak over past first quarters, per the BEA’s graph, while inflation is almost non-existent, with the core GDP price index up just 1.3 percent and declining.

But it’s not so confounding if we know it reflected an upturn in state and local government spending on infrastructure and other public services, since states are no longer waiting for the promised federal infrastructure bill that Trump is unable to come up with (hence the walkout of the scheduled meeting with Nancy Pelosi and Chuck Schumer that was to announce an infrastructure spending agreement).

Today's estimate reflects downward revisions to nonresidential fixed investment and private inventory investment and upward revisions to exports and personal consumption expenditures (PCE). Imports, continued the BEA report, which are a subtraction in the calculation of GDP, were revised up; the general picture of economic growth remains the same.

But the Q1 growth uptick from December may be an anomaly as corporate profits are also falling, which is limiting their investments in new plants and equipment. Adjusted corporate profits before taxes fell at an annual 2.8 percent pace, the biggest decline since 2015, according to MarketWatch.

Corporate profits have risen just 3.1 percent in the past 12 months, down from 10 percent less than a year earlier. That can explain why business investment rose just 2.3 percent in the first three months of the year, the revised GDP figures show.


Business investment is the seed corn for future growth, which means governments have to take up the slack if private business cuts back on basic spending that boosts productivity; or the US risks slumping back to 2 percent or less growth as happened prior to the Republicans’ December 2017 tax cuts that reduced corporate tax rates and gave a temporary boost to growth.

It’s therefore is a mystery why the Trump administration hasn’t made infrastructure a higher priority. It would create thousands of high-paying jobs.Congressional Republicans and Democrats have come together on a $2 trillion infrastructure bill, but can't get Trump's attention.

Most worrisome is the continued fall in interest rates, which has inverted the yield curve between 3-month and 10-year bond yields once again. The 10-year bond has fallen to 2.15 percent at this writing, the lowest in 5 years. Investors are fleeing to longer-term bonds because they fear an imminent slowdown.

Who can blame them with the China trade war taking on more ominous tones? China is now threatening to restrict the export of strategic rare earth minerals used in some of our most sensitive technology in response to the US banning of Huawei technologies in developing the US 5G Internet of the future.

One time frame given for a recession if the yield curve remains inverted for a prolonged period is 18 months—which would put it in the middle of next year’s Presidential campaign. But there’s also the possibility that the Federal Reserve will begin to lower interest rates to right the yield curve if they see a looming recession.

University of California economics Professor Peter Rupert summarized the odds of a looming recession in a recent forecast. Are there signs of a slowdown soon? “There are always some signs of slowing,” he said. Is there a recession coming? “There are always signs of a coming recession.” But when? “No one knows, sorry!”

Harlan Green © 2019

Follow Harlan Green on Twitter: https://twitter.com/HarlanGreen

Tuesday, May 28, 2019

Why No Real Inflation?

Financial FAQs


This graph portrays the history of inflation since the 1970s, when the Arab oil embargo caused oil prices and inflation to soar to unacceptable heights.  It made Americans realize how dependent they had become on 1) fossil fuels to run the economy, and 2) other people’s oil.

Inflation since then—at least the Fed’s preferred PCE Index that is the broadest measure of price fluctuations—has been tamed. In fact, so much so, the worry today is too little inflation via ever more efficient manufacturing that now employs a fraction of the employees it once did for the same output.

Why such a worry? Because the globalization that drove most of the higher-paying jobs overseas to cheaper climes has driven down most households’ incomes as well as prices that could lead to a deflationary spiral, which would signal an incoming recession. It worried the Fed under Ben Bernanke so much that he brought on the various QE programs after the Great Recession to ease credit by bringing down interest rates to the record lows of today.

In fact, the 10-year Treasury yield has slipped to 2.29 percent from a seven-year high of 3.23 percent last October, and it’s been under pressure to go even lower from a flareup in trade tensions between the U.S. and China.

It hasn’t done much for growth.  The distribution of household wealth in America has become even more disproportionate over the past decade, with the richest 10 percent of U.S. households representing 70 percent of all U.S. wealth in 2018, compared with 60 percent in 1989, according to a recent study by researchers at the Federal Reserve.
“The share of assets held by the top 10 percent of the wealth distribution rose from 55 percent to 64 percent since 1989, with asset shares increasing the most for the top 1 percent of households. These increases were mirrored by decreases for households in the 50-90th percentiles of the wealth distribution,” Fed researchers said.
Wealth has transferred from those that work for a living to those that live off rents, which is income from existing assets—whether it’s stocks, bonds, real estate, or even charitable foundations where many of the wealthy shelter their incomes.

Economics Professor Gabriel Zucman has researched what happened, especially since 1980 when Republicans began to dominate the political landscape. The top 1 percent of income earners controlled 7 percent of the wealth then, whereas today they control 39 percent.

A second result has been the cutbacks in health care spending to the tune of $1.5 trillion over 10 years from the Republicans 2017 tax cut bill that reduced corporate taxes to 20 percent. So instead of spending on such public benefits as expanded health care and infrastructure spending, the tax savings went into the pockets of corporate shareholders and their CEOs.

President Trump acknowledged as much with his latest walkout of the scheduled meeting with Democrats on an already agreed upon $2 trillion infrastructure bill. Washington Post’s E.J. Dionne, Jr. said as much in his comment about Trump’s latest blowup.
“Trump’s theatrics were also very convenient because they disguised the fact that he cannot now, or ever, deliver on his signature promise to create a “great” infrastructure program. This is why Trump “infrastructure weeks” have become a standing joke in Washington. LaTourette (a Eisenhower moderate Republican) was right: The Republican Party is no longer interested in spending public money to solve big problems if doing so gets in the way of cutting taxes.”
How dire is this trend?  Americans are so stretched to maintain a decent standard of living that they aren’t saving much of anything.  The Fed announced recently that 40 percent of working Americans haven’t saved more than $400 for emergencies.  
“When Reagan took office in January 1981, the net domestic saving rate stood at 7.8 percent of national income, and the current account was basically balanced. Within two and a half years, courtesy of Reagan’s wildly popular tax cuts, the domestic saving rate had plunged to 3.7 percent, and the current account and the merchandise trade balances swung into perpetual deficit.”
It has hovered in the 3 percent range ever since and government revenues now cover just 79 percent of public spending. The rest must be borrowed, which cannot go on forever.
Where have all those corporate profits gone? Ask Professor Zucman, who estimates $8 trillion is sheltered in offshore accounts—some legally, but much of it hiding from the IRS.

Harlan Green © 2019


Follow Harlan Green on Twitter: https://twitter.com/HarlanGreen

Monday, May 27, 2019

How Strong is US Housing?


The NAR reported that Existing-home sales saw a minor decline in April, continuing March’s drop in sales, according to the National Association of Realtors®. Two of the four major U.S. regions saw a slight dip in sales, while the West saw growth and the Midwest essentially bore no changes last month.

Lawrence Yun, NAR’s chief economist, said he is not overly concerned about the 0.4 percent dip in sales and expects moderate growth very soon. “First, we are seeing historically low mortgage rates combined with a pent-up demand to buy, so buyers will look to take advantage of these conditions,” he said. “Also, job creation is improving, causing wage growth to align with home price growth, which helps affordability and will help spur more home sales.”

Interest rate are back to almost historic lows last seen during the Fed’s QE programs, with the 30-year conforming fixed rate down to 3.50 percent, and High-Balance fixed rate @ 3.75 percent for a 1 point origination fee.

Refinancing applications jumped 8 percent last week, and purchase applications are 7 percent over last year, according to the Mortgage Bankers Association, because of the most recent rate declines, which are largely due to economic uncertainties (with outcomes of the trade wars, in particular).


And housing starts rose 5.7 percent on the month to a higher-than-expected annual rate of 1.235 million while permits gained 0.6 percent to 1.296 million, which is slightly higher than expected. But the battle is still uphill for housing as year-on-year comparisons show: at minus 2.5 percent for starts and minus 5.0 percent for permits.

Total existing-home sales, https://www.nar.realtor/existing-home-sales, completed transactions that include single-family homes, townhomes, condominiums and co-ops, fell 0.4 percent from March to a seasonally adjusted annual rate of 5.19 million in April. Total sales are down 4.4 percent from a year ago (5.43 million in April 2018).

Existing-sales of single-family homes, the key component in this report, did fall 1.1 percent in the month to a 4.620 million rate but here too the 3-month average is positive, at 4.733 million for the best showing since August last year. Condo sales, the second and much smaller component in the report, were a big positive in April, up 5.6 percent to a 570,000 rate.

Housing data are often volatile and 3-month averages can offer a more balanced view, as we know, and on this basis April's results are still good at a 5.293 million rate for the best showing since September last year.

I see 2019 housing purchases continuing to improve, largely because there is a disconnect between a fully employed economy (at 3.4 percent unemployment rate) and record-low interest rates.  It really means too much uncertainty in the financial markets, which translates to low demand, which leads to low overall inflation (reason for all the retail discounting), and bottom-level interest rates.

Consumer sentiment is also soaring at the moment, with the U. of Michigan survey at a 15-year high.  It will continue to boost builder optimism and housing construction that is struggling to keep up with sales, as long as the optimism prevails.  Sentiment can change on a dime, however, should we have what is called a ‘black swan’ event (a term for something totally unexpected, such as another trade war, or real war).  And that seems to be how this administration likes it, unfortunately.

Harlan Green © 2019

Follow Harlan Green on Twitter: https://twitter.com/HarlanGreen


Thursday, May 16, 2019

Oh, Oh, Retail Sales Also in Decline?

Popular Economics Weekly

The effects of the Trump administration’s trade wars are already slowing down consumer spending; not a good sign if Trump maintains tariffs for a longer period, as promised.


The US Census Bureau is now reporting a sharp decline in retail sales. A 1.1 percent decline in auto sales (signaled by the prior release of unit sales at manufacturers, says Econoday) is no surprise and neither is a 1.8 percent jump at gasoline stations, due to rising gas prices. A big surprise, however, is the 1.3 percent drop at electronics & appliance stores that follows a 4.3 percent tumble in March.

Weakness here hints at lower prices for consumer electronics and also lower spending on home improvements, reports the Census Bureau. Furniture sales also hint at trouble for residential investment, coming in unchanged following March's 3.1 percent decline, as do sales of building materials which fell 1.9 percent in April following, however, a 1.2 percent rise in March.

Lower Q2 consumer spending is also bringing down the consensus Q2 GDP growth into the 2 percent range, after the 3.1 percent Q1 GDP growth update, says CNBC chief economist Steve Liesman.

 Why? I maintain that Trump’s belligerent trade talks are turning off new investments, as manufacturers also batten down the hatches for a prolonged trade war. Prices are rising everywhere, and the U.S. is just beginning to see the effects of the various trade wars, including a threatened increase in auto tariffs that has unsettled European markets as well.


Industrial production overall is plunging, the Federal Reserve reports, down 0.5 percent in April. Motor vehicles and parts, where consumer sales have been mostly soft this year, fell 2.6 percent in April for a second monthly decline and year-over-year contraction of 4.4 percent. (Note this is a direct effect of higher import tariffs being passed on to vehicle manufacturers.)

Business equipment fell 2.1 percent in the month for yearly growth of only 0.1 percent which doesn't point to acceleration for business investment. Consumer goods also fell, down 1.2 percent in the month with construction supplies up only 0.1 percent that follows March's 1.7 percent dip in readings that don't point to strength for construction in general. Selected hi tech is a positive for April, up 0.6
percent with annual growth here at 3.2 percent. 

Who will put a stop to Trump’s trade war nonsense? Iowa farm state Senator Chuck Grassley, Chairman of the Finance Committee, is just one Republican beginning to sound the alarm on the harm it is already doing to Midwest farmers.
“It’s going to have some impact on the elections, of course,” said Grassley to reporters. “So far, I haven’t seen farmers abandoning Trump, but it’s going to have some impact.”
But Trump isn’t listening to him, he says, so he may have to put his warnings in writing.  (Is that a threat?)  There will be many more Republicans opposing the tariffs. Trump can’t afford to lose the support of those ‘free trade’ Senators or their Midwest supporters, in other words.

Harlan Green © 2019

Follow Harlan Green on Twitter: https://twitter.com/HarlanGreen

Wednesday, May 15, 2019

Do the Trump Trade Wars = Recession?

The Mortgage Corner

There are already signs President Trump’s trade wars are hurting. Right now, it’s mainly his Midwestern farm constituents that have seen their agricultural exports plummet. But what happens when rising prices from the tariffs are passed on to consumers, as well as the manufacturers with their increased costs from higher-priced imported components that go into manufactured products?
China accounted for 50 percent of all soybean exports before Trump began to raise tariffs. But no longer. Last November, Chinese soybean imports from the U.S. fell to zero, said the LATimes. 

“The share of total U.S. agricultural exports to China in value terms is projected to be 6 percent, down sharply, with China falling from the top market in 2017 to fifth place,” U.S. Department of Agriculture Chief Economist Robert Johansson told the agency’s annual forum in Washington on Thursday, Reuters reported. Johansson explained that the amount of soybeans exported this year compared with the same time last year decreased by 13.5 million metric tons.

“Under the trade dispute, exports to China alone have plummeted by 22 million tons, or over 90 percent,” he added. Overall, farm exports were projected to fall to $141.5 billion in 2019, a decrease of about $1.9 billion.

The result is farm bankruptcies in Wisconsin, Minnesota, Montana and the Dakotas have surged in the last two years, reaching 103 in 2018, according to the Federal Reserve Bank of Minneapolis. That’s the highest level since 2010, during the post-recession hangover.

“This trend has not yet seen a peak,” the Minneapolis Fed said in November, per the LATimes’ Michael Hiltzick. “One frustration for farmers and businesses suffering from the tariffs is that Trump appears to have no understanding of how tariffs work. In tweets, he has suggested that they’re paid by the exporting country — i.e., China, in the case of manufactured goods.”
They’re paid either by American importers if they maintain their pre-tariff prices to customers, or by consumers, hit with higher prices for imported goods. Even Trump economic advisor Lawrence Kudlow acknowledged over the weekend that the tariffs are “in effect … a tax increase” on Americans.
“Trump had promised to provide farmers with $15 billion in government relief, on top of the $12 billion he earlier pledged,” said Hiltzick. “But that could mean that American consumers pay twice for what appears to be Trump’s whim of iron on international trade — once in higher prices for foreign-made goods, and again to pay for the bailout for the agricultural sector.”
So manufacturing is another sector that is seeing rising costs. The Commerce Department just reported that both import and export prices are rising. U.S. import prices advanced 0.2 percent in April, after increasing 0.6 percent in March. (It said the April advance was driven by higher fuel prices, which more than offset decreasing prices for nonfuel imports.) But prices for U.S. exports also rose 0.2 percent in April after a 0.6-percent rise in March.

And Economics 101 says rising prices will kill any recovery, if prolonged. The danger of a prolonged trade war Deutsche Bank says in its most recent remarks, means that “aggressive posturing” aimed at getting concessions is often at the core of escalating conflicts such as what we’re seeing between Beijing and Washington.
Deutsche Bank says “The nature of trade wars (like actual wars) is that they foster nationalist sentiment and jingoism. The first shots are fired in the hope of quick victories. And before you know it, both sides are stuck in the trenches, with no obvious and politically feasible way out.”
I seriously doubt that President Trump will go that far in his need to feel like a winner, rather than be perceived as a loser.  But who knows, really, and that’s the problem. 

Harlan Green © 2019

Follow Harlan Green on Twitter: https://twitter.com/HarlanGreen

Tuesday, May 14, 2019

What is the Bully Mentality?

The Mortgage Corner 


The Trump administration and congressional Republicans’ “stonewalling” efforts, as House Majority Leader Nancy Pelosi has put it, are the latest example of the bully mentality, but few pundits or even Democrats seem to understand its exact meaning.

I began to write about the bully mentality, as I called it in 2014, initially in response to Republicans’ bullying tactics, such as House Majority Leader John Boehner’s “no compromise” vow to block any Democratic legislative initiatives, rather than negotiate bills and policies acceptable to both sides of the aisle.

And Republicans have been getting away with using such bully tactics to forward their agenda for years, perhaps even since House Majority Leader Newt Gingrich in 1994 as part of the Contract With America dissolved the congressional joint committee to work out differences in legislation with Democrats, “because I can”.

And Democrats don’t seem even now to want to confront Republican stonewalling in carrying out their constitutionally mandated oversight of the Executive Branch when the White House is attempting to block every attempt to investigate the many possible crimes enumerated in the Mueller Report.

Most people recognize bullying when they encounter it—someone using strong- arm techniques in the school yard, or cyberbullying in social media—but not the bully mentality behind it.
Personnel Today, an organizational management website, provides an easy definition: “Bullying behavior often seems gratuitous, with no obvious motivation other than to cause pain and humiliation and satisfy something in the mind of the bully.”

It lists the characteristics of a bullying mentality:
o Underlying feelings of insecurity, inadequacy and a fear of ‘being found out’
o Fear that their status is based on their position, rather than their own qualities
o Being in the wrong job (fearing that they are ‘not up to it’)
o Authoritarian personality characteristics
o Excessive use of defense mechanisms, such as projection, rationalisation, displacement and denial
o An inability to accept or engage with their own shortcomings
o Trying to ‘right wrongs’ – taking revenge on innocent people for perceived wrongs done to them
o Boosting their own ego by undermining other people
o Feeling a need to crush people whom they perceive as a threat to their precarious status

Most research on bullying has been with schools as they have been battling the rise of bullying in schools.

Following the 2016 Presidential election, the Southern Poverty Law Center conducted an online survey of 10,000 K-12 teachers, counselors and administrators on the negative impact of the election. Educators reported a skyrocketing of targeting and harassment of students that began last spring, most frequently in majority white schools, including verbal harassment, slurs and derogatory language, and incidents involving Nazi salutes, swastikas and Confederate flags.
“The behavior is directed against immigrants, Muslims, girls, LGBT students, kids with disabilities and anyone who was on the ‘wrong’ side of the election,” reads the SPLC report, The Trump Effect: The Impact of The 2016 Presidential Election on Our Nation’s Schools. “It ranges from frightening displays of white power to remarks that are passed off as ‘jokes.’” Ninety percent of educators say their schools have been negatively impacted for the long-term, while 80 percent said students are increasingly worried about the effect of the election on themselves and their families.”
And a national survey just released by the Human Rights Campaign found that bullying—which has occurred more frequently since the onset of the 2016 presidential campaign—is on the rise since the election.
“The survey of 50,000 young people ages 13-18 is the largest study of its kind, and it tells a disturbing story. Seventy percent of teens said they witnessed bullying, hate messages or harassment during or since the election. Of those incidents, 70 percent were racially motivated, 63 percent were based on sexual orientation, 59 percent were motivated by immigration status, and 55 percent of incidents were related to gender.”
Such behavior cannot be tolerated in a participatory democracy such as ours. The current White House’s behavior is a case in point, and endangers more than our domestic security, but that of our democratic allies as well.

It endangers our warming planet as well, when such a bully mentality prevails in our alliances, including the Paris Accord which many be the world’s best effort to mitigate global warming that even the US Pentagon warns endangers national security.

One vanguishes bullies by standing up to them—in whatever form they manifest, whether a dictator, autocrat, terrorist or gang leader—who we mustn’t forget prey on the weak and defenseless, yet seem to magically disappear when the fear they attempt to engender is opposed by sufficient courage.

Harlan Green © 2019

Follow Harlan Green on Twitter: https://twitter.com/HarlanGreen

Thursday, May 9, 2019

The Art of Negotiation

Financial FAQs

This column comes from a chapter in my forthcoming book, Answering the Kennedys Call to Promote World Peace and Freedom, a history of public service and community building by my own and more recent generations. This chapter documents the importance of cultivating good negotiating skills.


We start with perhaps the best-known example of bad negotiating skills; President Donald Trump of all people, who has called himself “the best negotiator in the world.” But we now know Trump’s deals in Art of the Deal were not good deals, since he lost more than $1.17 billion in ‘deals’ over the 10 years 1985-94, during the time it was written, according to the NYTimes.

So Trump had to know he was hurting when it was published in 2015. Trump’s co-author on The Art of the Deal, Tony Schwartz—who apparently wrote almost the entire book himself—mentioned in a Forbes article that he worked hard to ignore all of the evidence of Trump’s poor deal-making, and “put lipstick on a pig” to create the image of Trump as a great negotiator.

“What’s interesting,” said MarketWatch columnist Paul Brandus in writing about Trump’s tax losses, “is that even with one mild recession, the overall period in question—1985 to 1994—was a boom time for the U.S. economy. GDP grew 43 percent, and the stock market, as measured by the S&P 500 grew 171 percent—not counting dividends.

In fact, a 2016 USA Today investigation mentioned by Brandus that I wrote about at the time revealed Trump over the last three decades has been the target of some 3,500 lawsuits by employees and contractors over alleged non-payment. Many of the people who sued Trump were hard-working blue-collar types like dishwashers, painters and waiters—the very kind of “small guys” that candidate Trump claimed he was always looking out for, said USA Today.

“The president’s alleged cheating continues to the present,” continued Brandus, “Trump has been hit with at least $5 million in unpaid liens by workers at his lavish new hotel here in Washington—just five blocks from the White House.”
It doesn’t take a negotiating genius to know why Trump has repeatedly failed to negotiate successfully. It means he never learned the art of negotiation, which needs to have what we call a “win-win” outcome in which both parties gain in some way—at least in the normal world we live in; if we want to build relationships and have a successful reputation, which Trump singularly lacks.

It means there is a buyer wanting something for a good price, and seller that still needs to make a profit; or negotiating the timing of a meeting; or parents negotiating with children over playtime, allowance, behavior, or whatever. The point being that the negotiation won’t succeed if an agreement isn’t reached that both sides feel is a win in some way.

It really needs to be called the Art of Compromise, since all parties know they will meet somewhere in the middle to be successful. But there is nothing Pollyanna about a successful negotiation, since in high stakes negotiations each side usually probes the other’s weaknesses; who may have a time constraint, or badly needs the money. One side can also threaten to walk away; as has happened in countless labor negotiations with management. There are lots of tricks to the trade, in other words.

But bullies and autocrats, such as President Trump, or politicos who refuse to compromise on their legislation, are doomed to fail in getting what they want, other than a temporary feeling of power.

The dysfunctional federal government is such a case in point at present. Republicans since House Speaker John Boehner have consistently refused to compromise, and the result is almost no legislation has been passed, except for the 2017 Republican tax cuts that benefited only the wealthiest and is highly unpopular.

It doesn’t mean the art of negotiation can’t be learned. But it takes practice and some fortitude to be able to say no, or accept rejection, or even step back when it becomes too one-sided.

Harlan Green © 2019


Follow Harlan Green on Twitter: https://twitter.com/HarlanGreen

Wednesday, May 8, 2019

Where Are the Workers?

Popular Economics Weekly

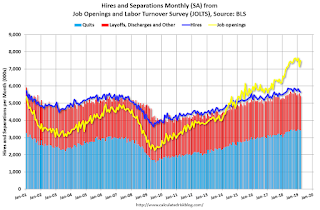
The number of job openings rose to 7.5 million on the last business day of March, the U.S. Bureau of Labor Statistics reported today. Over the month, hires and separations were little changed at 5.7 million and 5.4 million, respectively.

But the miniscule change in hires and separations doesn’t tell us the real employment story. This Calculated Risk graph shows the huge separation between the yellow line (Job openings) and blue line (Hires). It’s now almost 2 million.


The actual difference was because job openings surged 4.8 percent in the month to 7.488 million at the same time that hires fell 0.6 percent to 5.660 million, according to Econoday. “The gap between the two stands at a new record of 1.828 million, signifying a huge demand for workers that isn’t being met.”

Year-on-year, openings are up 8.6 percent vs. only a 0.6 percent rise for hires. The gap between total openings in March relative to the 6.211 million unemployed actively looking for a job in the month was 1.277 million.

This tells us how complex is the hiring process, since it’s becoming ever more difficult to match those looking for work with the advertised job openings. How can we fix the problem from the mismatch?

One hint is we know from last week’s unemployment report almost 500,000 fewer workers were available for work in the Household Survey, shrinking the labor pool, even though job hirings were up in the seasonally adjusted Establishment Survey that reports actual payroll numbers.

I believe those either leaving the workforce, or still looking for work, are waiting for better job prospects. Most do not want Amazon warehouse or Walmart jobs that pay barely above minimum wages.

The largest hires in the April unemployment report were all in the services sector. Professional services, education and health services led, with Leisure/Hospitality and construction hiring next—all in the lower-paying service sector.

Only 4,000 manufacturing jobs were created, according to the BLS, with the utilities and mining sector losing jobs.

Both the Institute of Supply Management’s (ISM) manufacturing and service sector activity surveys also declined in March, with manufacturing activity the weakest in 2 years. It was mainly due to the decline in new orders, possibly due to the trade uncertainty.

The 3.2 percent increase in the initial Q1 GDP growth estimate was a pleasant surprise, as I said last week, but it was largely because spending by local governments picked up due to the partial federal government shutdown and a “turnaround in investment, most notably in construction of highways and streets,” said the BEA. 

Local and state governments may have been waiting to see if the Trump administration would chip in to boost needed infrastructure upgrades, and since that didn’t happen states decided to implement the needed projects.

The buildup in unsold inventories, and fewer imports also increased GDP numbers. That’s because import prices are rising as the recent tariff increases are being passed on to the consumer, contrary to what administration officials are saying.

And rising prices will put a cap on growth, as well as future hiring. So we are waiting to see if more are willing to work, or are still waiting for the right job so they can afford to pay for those higher prices.

Harlan Green © 2019

Follow Harlan Green on Twitter: https://twitter.com/HarlanGreen

Monday, May 6, 2019

Our Student Debt Problem

Financial FAQs

College students and former students have amassed some $1.5 trillion in student debts, most of it (90 percent) held by the federal government or guaranteed by same. And this is holding back a whole generation of young adults who have to postpone almost everything—marrying, raising a family, buying a home, even finding a desirable job—in order to pay their debts.

Presidential candidates such as Senator Elizabeth Warren Senator are offering a solution to the student debt problem by offering some debt relief based on income. And there are various proposals to reduce student fees for higher education, as well as smaller institutions of higher education that charge little or no fees.

In 1993, the average debt of a bachelor’s degree graduate was approximately $9,000; five years later, it was about $15,000. By 2003, it had jumped to approximately $17,500, according to the Wall Street Journal.

Today, the average outstanding student loan balance per debtor is roughly $30,000, though one recent study by Fidelity Investments put the figure as high as $35,200. Approximately 20 percent of U.S. households currently owe student loan debt, as do 40% of people younger than 35. This means an increase of nearly 200 percent of overall student loan debt (public and private) over the last 20 years.

This is while the wages of middle-class workers have grown just 6 percent since 1979 and low-wage workers’ wages actually dropped 5 percent during that period, according to the Economic Policy Institute, a progressive think tank.


It is why Senator Elizabeth’s proposal to cancel most public college or university student debts is so important. In the latest Hill-HarrisX survey, 67 percent of respondents between 18 and 64 said they backed Warren's idea compared to 53 percent of voters who were older. The proposal was also supported across all age groupings although voters who are 65 years old and up were somewhat less likely to support it.

What happened to put so much of the burden on students and their families to have what was once affordable to children of a middle-class family? Declining state investment in higher education over the past decades has pushed costs up, making it more difficult for students to afford school on shrinking household incomes, while many more students enrolled in higher education, so that almost 50 percent of the student-age population now attends some college or university.

Something had to give. In the late 1980s, public colleges typically got about one-quarter of their revenue from tuition, now that’s up to about 50 percent, according to Michael Mitchell, a senior policy analyst at the Center on Budget and Policy Priorities who studies state funding trends.

But there’s an even deeper reason college and university costs have risen with state-chartered public institutions like the University of California and California’s State College systems.

It began just after I left UC Berkeley in 1964, and the protests against American involvement in the Vietnam War began. President Johnson declared war on Vietnam on August 10, 1964 after the Gulf of Tonkin incident, and the Selective Service then made every able-bodied American male 18 year old eligible for the draft. That is when Berkeley’s campus anti-war protests began in earnest.

A coincidence?  I don't think so.  My only ‘tuition’ during my six years from 1958-64 was a $150 administration fee for every semester I attended UC Berkeley, and that was the case until Ronald Reagan became California’s Governor in 1966 when he and fellow conservatives on his Board of Regents, which was mostly made up of successful businessmen, decided that Berkeley students were spending too much time on the streets protesting the war, and not enough time in the classroom.

In 1969, Reagan convinced the Regents to begin to charge “education fees” to students for the privilege of attending such a prestigious institution, even though the UC system was a state-funded institution under the federal land grant act; rather than privately-funded Stanford University.

Its University of California system was created in 1868 with the decree that “admission and tuition shall be free to all residents of the state,” and the California State and community-college systems followed suit.

Governor Reagan at his inauguration famously said in reaction to the growing student protests: “Get them out of there, he said. “Throw them out. They are spoiled and don't deserve the education they are getting. They don't have a right to take advantage of our system of education.”

All UC students in the 2019 school year who are residents of California now pay $13,500 per year in tuition fees, while non-residents pay $42,500 per year, according to the UC Admissions Office.

U.S. News and World Reports publishes college rankings as well as those institutions of higher learning with little or no tuition fees. These low or tuition-free colleges are in lesser known states and regions, such as the Dakotas, New Hampshire, Arkansas, Illinois, Kentucky and Texas that give the same quality education without ‘name’ professors; that is, if the student seeks an education that will prepare him or her for meaningful work, rather than a degree from a prestigious and expensive institution (such as UC Berkeley) that that will put him or her on a career track that may turn into a well-worn rut. Even Ivy League Cornell University charges no tuition fee to New York state residents with family incomes of less than $100,000 per year.

Senator Warren’s proposal includes cancelling up to $50,000 in student debt for those that make less than $100,000 a year, with the amount of relief getting gradually smaller as income level goes up, and households that make more than $250,000 not eligible for any debt relief.

Altogether, it would wipe out all student debt — including both federal and private loans — for more than 75 percent of Americans with outstanding loans, according to analysis provided by Warren’s campaign.

These are just a few ideas on how to solve the student debt problem. We know the problem is becoming even more serious as a growing number of students want the advantages of a higher education; the question is how to fix it.

Harlan Green © 2019

Follow Harlan Green on Twitter: https://twitter.com/HarlanGreen

Friday, May 3, 2019

A Huge Employment Report

Popular Economics Weekly 


 The U.S. Bureau of Labor Statistics (BLS) reported today that total nonfarm payroll employment increased by 263,000 in April, and the unemployment rate declined to 3.6 percent. It was the lowest unemployment rate in 49 years—since December 1969.

A major reason for the rate drop was almost 500,000 fewer workers were available for work in the Household Survey, shrinking the labor pool, even though job hirings were up in the seasonally adjusted Establishment Survey that reports actual payroll numbers. Notable job gains occurred in professional and business services, construction, health care, and social assistance.

The fact that nonfarm payroll employment increased by 263,000 in April, compared with an average monthly gain of 213,000 over the prior 12 months showed that Fed Chairman Powell and his Board of Governors were correct in not signaling a rate drop anytime soon; maybe not for the rest of the year.

The BLS reported professional and business services added 76,000 jobs in April, with gains in administrative and support services (+53,000) and in computer systems design and related services (+14,000). Over the past 12 months, professional and business services has added 535,000 jobs, a sign that IT services continued to grow.

And construction, hence the real estate industry also showed strong growth, with construction employment up by 33,000, including gains in nonresidential specialty trade contractors (+22,000) and in heavy and civil engineering construction (+10,000). Construction has added 256,000 jobs over the past 12 months.

The construction jobs surge highlights the 3.9 percent increase in spending of state and local governments on infrastructure—such as roads and bridges—in the initial estimate of Q1 GDP growth.

Employment in health care grew by 27,000 in April and 404,000 over the past 12 months. In April, job growth occurred in ambulatory health care services (+17,000), hospitals (+8,000), and community care facilities for the elderly (+7,000).

This means the just reported 3.2 percent jump in Q1 GDP growth was no fluke, though manufacturers added a mere 4,000 jobs after no increase in March. Factory hiring has been very weak this year as companies struggle with stagnant exports and the effects of U.S. trade tensions with China.

Government jobs rose by 27,000, a good thing, as government activity has an important part in maintaining public services. The federal government is already starting to hire workers for the 2020 Census, said the Census Bureau.  Retailers, on the other hand, cut 12,000 jobs as traditional brands continue to lose ground to internet rivals.

But although the economy is still pumping out plenty of new jobs, the rate of hiring has slowed. The U.S. added an average of 169,000 jobs in the past three months, down from a three-year high of 232,000 in January, But that may be a fluke due to the December government shutdown.

So full economic speed ahead, if no more shutdowns! There are still more than 1 million job openings, according to the Labor Department’s JOLTS report, and the U.S. is the world’s largest economy because it actually churns out more than 5 million new jobs per month.

This also gives the Trump administration more incentive to settle its various trade battles, if it wants to have any wins in next year’s Presidential election.

Harlan Green © 2019

Follow Harlan Green on Twitter: https://twitter.com/HarlanGreen