Showing posts with label home prices. Show all posts

Thursday, July 1, 2021

Consumer Confidence, Home Prices Soar For How Long?

Financial FAQs

Conference Board

Consumer confidence is at record highs, as growing numbers of consumers believe the roaring 2020’s recovery is here to stay. And it’s also sending home price increases to record highs. But this isn't another housing bubble. Too few homes are being built rather than too many, as builders try to catch up to the decades-long housing shortage, which could take another decade.    

“Consumer confidence increased in June and is currently at its highest level since the onset of the pandemic’s first surge in March 2020,” said Lynn Franco, Senior Director of Economic Indicators at The Conference Board. “Consumers’ assessment of current conditions improved again, suggesting economic growth has strengthened further in Q2. Consumers’ short-term optimism rebounded, buoyed by expectations that business conditions and their own financial prospects will continue improving in the months ahead.“

The Case-Shiller home price index increased 14.6 percent in April, as it runs a 3-month average for same-home sale prices. This is that best of all worlds with demand so high. Current interest rates are below the inflation rate, so mortgages held longer term really have zero or negative yields, which means actual inflation shows up in housing prices.

“Phoenix, San Diego, and Seattle reported the highest year-over-year gains among the 20 cities in April,” said Case-Shiller. “Phoenix led the way with a 22.3% year-over-year price increase, followed by San Diego with a21.6% increase and Seattle with a 20.2% increase. All 20 cities reported higher price increases in the year ending April 2021versus the year ending March 2021.”

“In fact, the proportion of consumers planning to purchase homes, automobiles, and major appliances all rose—a sign that consumer spending will continue to support economic growth in the short-term. Vacation intentions also rose, reflecting a continued increase in spending on services,” said the Conference Board.

Consumers’ assessment of the labor market also improved. The Conference Board graph shows that jobs plentiful minus jobs hard to get blue line is soaring, with 54.4 percent of consumers said jobs are “plentiful”, up from 48.5 percent, and 10.9 percent of consumers claimed jobs are “hard to get”, down from 11.6 percent.

Conference Board

This is no wonder, as economists are predicting 9-10 percent GDP growth in Q2, and maybe six percent plus for all of 2021, before returning to a more normal growth pattern.

The American Rescue Plan has inserted $1.9 trillion into the U.S. economy, and Repubs and Democrats have agreed on an additional $1 trillion for infrastructure and other much needed physical improvements that will create more high-paying jobs.

So why shouldn’t consumers be this optimistic for awhile?

Harlan Green © 2021

Follow Harlan Green on Twitter: https://twitter.com/HarlanGreen

Tuesday, August 30, 2016

US Consumers Happy Again

Popular Economics Weekly

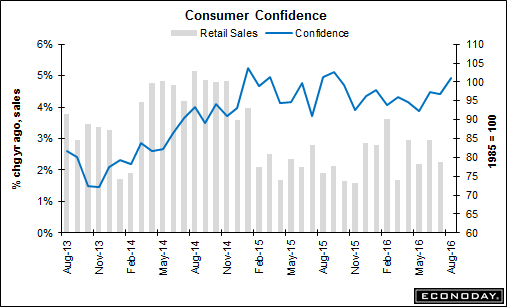
US consumers are feeling good, with higher confidence and rising wages pushing demand for housing and consumer spending. The Conference Board’s Consumer Confidence Index rose a huge 4.4 points to 101.3 in August. It has been hovering in this range for more than one year, reflecting the strong jobs market.


“Consumer confidence improved in August to its highest level in nearly a year, after a marginal decline in July,” said Lynn Franco, Director of Economic Indicators at The Conference Board. “Consumers’ assessment of both current business and labor market conditions was considerably more favorable than last month. Short-term expectations regarding business and employment conditions, as well as personal income prospects, also improved, suggesting the possibility of a moderate pick-up in growth in the coming months.”
And consumer spending is reflecting that optimism. Consumer spending last month was lifted by a 1.6 percent surge in purchases of long-lasting manufactured goods such as automobiles. Spending on services rose 0.4 percent, but outlays on non-durable goods slipped 0.5 percent (such as food and clothing).

Personal income increased 0.4 percent in July after rising 0.3 percent in June. Wages and salaries advanced 0.5 percent. This is while savings rose to $794.7 billion from $776.2 billion in June, still a 5 percent savings rate, which means consumers are saving for the possibility of another rainy day.

Who can blame consumers for being cautious? But with housing markets taking off, it looks at long last that housing supplies are returning to normal. The Case-Shiller Home Price Index is now rising a more normal 5 percent per year, down from its recent 10 percent rise in 2013-14, as more housing comes on the market.


In boom cities like Portland and Seattle prices rose 12.6 and 11 percent, respectively, while Denver and Dallas were some 9 percent higher in June. Cities that suffered the most from the bust are also recovering in such areas as California’s Central Valley and San Francisco’s East Bay; cities such as Stockton and Vallejo that filed for bankruptcy because of the housing bust.

So what has been keeping economic growth in the 1 percent range of late, over the last 3 quarters? Most of it comes from a slowdown in labor productivity due to businesses’ refusal to invest in capital improvements. Labor productivity is at a historic post WWII low, increasing just 1.3 percent since the Great Recession, as I said last week. Normally, so-called cap-ex spending should also surge after such a downturn for production to catch up with depleted inventories, but it hasn’t this time.

Instead, corporations have been using their record profits to buy back stock, enhancing their own and stockholders incomes, a major cause also for the record income inequality. That has to change, needless to say, if voters have anything to say in the upcoming elections.

Harlan Green © 2016

Follow Harlan Green on Twitter: https://twitter.com/HarlanGreen

Tuesday, February 9, 2016

Why Are Mortgage Rates At Historical Lows?


Mortgage rates continued to tumble over the past week as investors fled to the safety of government bonds, pushing Treasury yields down, mortgage provider Freddie Mac said Thursday. This is no surprise given the geopolitical uncertainties buffeting economies worldwide.


The 30-year fixed-rate mortgage averaged 3.72 percent in the Feb. 4 week, down from 3.79 percent from a week earlier and is at the lowest level since April 30, Freddie Mac said. The 15-year fixed-rate mortgage averaged 3.01 percent, down from 3.07 percent. The 5-year Treasury-indexed hybrid adjustable-rate mortgage averaged 2.85 percent, down 5 basis points.

“These declines are not what the market anticipated when the Fed raised the Federal Funds rate in December,” Freddie’s chief economist, Sean Becketti, noted in a statement. “For now, though, sub-4 percent mortgage rates are providing a longer-than-expected opportunity for mortgage borrowers to buy or refinance.”

In fact, the 30-year conforming fixed rate can currently be bought down to 3.25 percent.  This is a historical low, and causing a rise in mortgage applications.  The Refinance Index increased 0.3 percent from the previous week to its highest level since October 2015, reports the MBA. The seasonally adjusted Purchase Index decreased 7 percent from one week earlier. The unadjusted Purchase Index increased 11 percent compared with the previous week and was 17 percent higher than the same week one year ago.

But for how long can these below-historically-low rates continue?  Too much oil, for one, should help to keep oil prices, and therefore inflation, almost non-existent for this year, at least.  That’s according to Barron’s resident economist Gene Epstein.  “…over the past five years,” says Epstein, “the world has found a trillion extra barrels of oil—the equivalent of 30 years of extra supply—with a third of it coming from shale, a third from deep water, and a third from oil sands. Over the past year, the costs of recovery from these sources has noticeably fallen. A return to triple-digit prices on crude oil is (therefore) unlikely for the foreseeable future.” 


            But there’s another reason for such low interest rates.  Growth is slowing worldwide, which is the major reason inflation is so low.  And Janet Yellen is now backtracking on raising the Fed’s rates any higher this year.
            But consumers don’t seem to be listening to the bad news. Consumer spending — the main engine of the U.S. economy — rose 3.1 percent in 2015 to set the fastest pace since 2005. Unless Americans suddenly turn pessimistic, they’ll keep spending at a decent clip this year and give businesses no reason to resort to mass layoffs.
One major bellwether is car sales, says Marketwatch’s Jeffry Bartash. After snapping up a record 17.5 million new vehicles in 2015, Americans were back at it in January. Sales rose last month rose at the same robust 17.5 million pace. “That’s not a sign of an increasingly anxious consumer.”

Harlan Green © 2016

Follow Harlan Green on Twitter: https://twitter.com/HarlanGreen
Tuesday, August 25, 2015

Record Post-Recession Home Sales, Construction, Case-Shiller Prices in July

The Mortgage Corner

With all the bad news coming from the stock market, it’s good to know that this hasn’t affected the housing market. In fact, it’s pushing interest rates lower, so that a conforming 30-year fixed mortgage rate has dropped to 3.50 percent in California. And that will continue to boost home sales (and prices, of course). That’s why Case-Shiller shows two cities already above their bubble highs, and the Conference Board’s Index of Leading Economic Indicators (LEI) shows continued strong growth ahead.

Total existing-home sales, which are completed transactions that include single-family homes, townhomes, condominiums and co-ops, increased a whopping 2 percent to a seasonally adjusted annual rate of 5.59 million in July from a downwardly revised 5.48 million in June. Sales in July remained at the highest pace since February 2007 (5.79 million), have now increased year-over-year for ten consecutive months and are 10.3 percent above a year ago.

image

Graph: Econoday

Lawrence Yun, NAR chief economist, says the increase in sales in July solidifies what has been an impressive growth in activity during this year's peak buying season. "The creation of jobs added at a steady clip and the prospect of higher mortgage rates and home prices down the road is encouraging more households to buy now," he said. "As a result, current homeowners are using their increasing housing equity towards the downpayment on their next purchase."

And demand is well ahead of thin supply, at 4.8 months at the current sales rate vs 4.9 and 5.1 in the two prior months and 5.6 months in July last year. Sales are up 10.3 percent year-on-year, well ahead of the median price which, at $234,000, is up 5.6 percent.

The S&P/Case-Shiller U.S. National Home Price Index recorded a higher year-over-year gain with a 4.5 percent annual increase in June 2015 versus a 4.4 percent increase in May 2015. The smaller 10-City Composite had marginally lower year-over-year gains, with an increase of 4.6 percent year-over-year. Denver and Dallas are the two cities now above their 2007 bubble highs, while Denver (+10.2%), San Francisco (+9.5%) and Dallas (+8.2%) had the biggest year over year increases.

image

Graph: Calculated Risk

This mismatch of supply vs. demand means even higher existing-home prices ahead. Especially since housing construction is just beginning to play catch up after years of low growth—no coincidence, given the rising demand for housing of any kind—rental as well as for prospective homeowners. Led by a strong jump in single-family production, nationwide housing starts inched up 0.2 percent to a seasonally adjusted annual rate of 1.206 million units in July, according to newly released data from the U.S. Department of Housing and Urban Development and the Commerce Department. This is the highest level since October 2007.

It’s also why the Conference Board’s Index of Leading Economic Indicators (LEI) continues to show moderate growth for the next 6 months, and is up 1.7 points from January to July. “The U.S. LEI fell slightly in July, after four months of strong gains. Despite a sharp drop in housing permits, the U.S. LEI is still pointing to moderate economic growth through the remainder of the year,” said Ataman Ozyildirim, Director of Business Cycles and Growth Research at The Conference Board.

Swings in housing permits have been distorting recent LEI readings including for July. Permits, which fell 16 percent in Tuesday's housing starts report, more than offset what are a run of mostly neutral readings among other components. Given the uncertainties of measuring housing data (readings with plus or minus 11 percent variations are common) the index could have added another 0.54 points to the July indicator, instead of subtracting that amount, for a much stronger reading.

The strongest component is the rate spread which reflects the Fed's ongoing accommodative policy. Also pointing to strength are initial jobless claims, which are at rock bottom lows, and the report's credit index which points to a rise ahead for lending.

So what’s happening in China and the so-called emerging markets (including the Petro states, and Russia) will help to keep interest rates low, housing strong, and maybe the Fed from raising their short-term rates for some time to come.

Harlan Green © 2015

Follow Harlan Green on Twitter: https://twitter.com/HarlanGreen

Thursday, July 23, 2015

Will Fannie and Freddie’s Investors Finally Succeed?

Financial FAQs

It is welcome news for Fannie Mae and Freddie Mac investors that Judge Margaret Sweeney in the Federal Claims Court in Washington Tuesday granted a motion that will force the U.S. Treasury to release all discovery document materials in its possession that pertain to the decision to take Fannie Mae and Freddie Mac into conservatorship.

Why? Because the White House, US Treasury, and Federal Housing Finance Authority have been stonewalling discovery requests by investors who want to know exactly why the GSEs were put into conservatorship in the first place.

This is important for several reasons—not least is the reputed $36 billion in preferred Fannie stock alone that was ‘taken’ by the government when it claimed Fannie and Freddie were in danger of collapse, and so had to be recapitalized with government support to the tune of $186 billion.

But that has been paid back in spades, and the GSEs are not being allowed to recapitalize. This is when commercial banks that were granted some $350 billion in TARP funds by the same Republican Treasury Secretary under GW Bush (Henry Paulson, former Chairman of Goldman Sachs) were allowed to be recapitalized. So Wall Street benefited, but not Main Street homeowners that for the most part still depend on Fannie and Freddie to guarantee most home loans.

Instead, due to a last minute (2012) ‘tweak’ to the original conservatorship order, all profits go into the Treasury’s General Fund, which has raised suspicions that Treasury is behind the move to capture all profits for its own uses, rather than returning value to preferred stockholders, at least. How is that fair when the GSEs weren’t responsible for the bubble, or subprime loans, or the Great Recession, at all?

We know this because some $14 billion in settlements have already been recovered from those commercial banks and Wall Street entities that submitted fraudulently underwritten mortgages misrepresenting their loan quality to Fannie and Freddie.

The request, made by Fairholme Funds, is a big win for them in the battle to review federally sealed documents in its case against the United States government. Fairholme is one of several former investors in the government-sponsored enterprises who say their ownership stake was illegally taken from them by the federal government during conservatorship. They are fighting in court to get that stake returned.

The more than ten thousand discovery documents will be available to the United States District Court of Appeals in Washington D.C. and the United States District Court.

There is plenty of evidence that Fannie and Freddie were still solvent at the time. Even Treasury Secretary Henry Paulson reassured Congress of their solvency, while Bear Stearns was going under in 2007.

"Fannie Mae and Freddie Mac play an important role in our housing markets today and need to continue to play an important role in the future," Secretary Treasury Henry Paulson told the House Financial Services Committee at a hearing on financial regulation. "Their regulator has made clear that they are adequately capitalized."

And mortgage delinquency rates are almost back to historical levels. For instance, June’s existing-home sales report showed just 8 percent of sales were comprised of forecloses homes, lowest since 2007 and the housing bust.

 image

Graph: Seeking Alpha

The profits have been enormous for US Treasury. “Taxpayers have been paid back and the companies are now left with little capital due to the net worth sweep,” says Seeking Alpha in its latest article on the issue. “Based on Judge Lamberth's ruling (of last year dismissing Fairholmes suit), the government could be sued for a taking if the companies are liquidated. Reform must include adequate compensation to shareholders, as well as a method to bring capital back onto the balance sheet. After 2010, solvency was never a problem.”

And now we have Judge Sweeney ruling in favor of discovery that will enable investors to untangle the ‘rest of the story’.

Harlan Green © 2015

Follow Harlan Green on Twitter: https://twitter.com/HarlanGreen

Wednesday, July 22, 2015

Existing-Home Sales at 8-Year High

The Mortgage Corner

It had to happen.  Why did June existing-home sales jump to an 8-year high? Fewer foreclosures is the short answer, hence more available for sale at market prices. But soaring consumer optimism due to an even better jobs market has to be the driving force causing families to build their nests.

Also, prices are rising to multi-year highs due to supply scarcities. And then there are the demographics, as the new generation is pushing older generations to move up or down, with even baby boomers wanting more retirement living.

Total existing-home sales, which are completed transactions that include single-family homes, townhomes, condominiums and co-ops, increased 3.2 percent to a seasonally adjusted annual rate of 5.49 million in June from a downwardly revised 5.32 million in May. Sales are now at their highest pace since February 2007 (5.79 million), have increased year-over-year for nine consecutive months and are 9.6 percent above a year ago (5.01 million).

image

Graph: Calculated Risk

Lawrence Yun, NAR chief economist, says backed by June's solid gain in closings, this year's spring buying season has been the strongest since the downturn. "Buyers have come back in force, leading to the strongest past two months in sales since early 2007," he said. "This wave of demand is being fueled by a year-plus of steady job growth and an improving economy that's giving more households the financial wherewithal and incentive to buy."

Inventories have dropped to 5 months, which is driving up prices. The median price, up 3.3 percent in the month to $236,400, is already a record. Part of the rise in prices is tied to a lack of distressed sales, at only 8 percent of June's total which is a record low, according to Econoday.

Adds Yun, "June sales were also likely propelled by the spring's initial phase of rising mortgage rates, which usually prods some prospective buyers to buy now rather than wait until later when borrowing costs could be higher."

And that may be an additional factor. Interest rates, though still low, have risen approximately ¼ percent since their most recent lows, with 30-year fixed conforming rates now 3.75 percent for a 1 point origination fee in California.

Total housing inventory3 at the end of June inched 0.9 percent to 2.30 million existing homes available for sale, and is 0.4 percent higher than a year ago (2.29 million). Unsold inventory is at a 5.0-month supply at the current sales pace, down from 5.1 months in May.

"Limited inventory amidst strong demand continues to push home prices higher, leading to declining affordability for prospective buyers," said Yun. "Local officials in recent years have rightly authorized permits for new apartment construction, but more needs to be done for condominiums and single-family homes."

The percent share of first-time buyers fell to 30 percent in June from 32 percent in May, but remained at or above 30 percent for the fourth consecutive month. A year ago, first-time buyers represented 28 percent of all buyers.

This is why housing starts surged nearly 10 percent last month to an annual rate of 1.17 million, just a touch below a post- recession high. Builders were especially active in the Northeast and South that suffered so much from last winter. We need more housing, in other words, as jobs and families continue to grow.

Harlan Green © 2015

Follow Harlan Green on Twitter: https://twitter.com/HarlanGreen

Saturday, July 18, 2015

Housing Starts, Builder Optimism at Recovery Highs

The Mortgage Corner

Privately-owned housing starts in June were at a seasonally adjusted annual rate of 1,174,000. This is 9.8 percent above the revised May estimate of 1,069,000 and is 26.6 percent above the June 2014 rate of 927,000. This tells us the real estate recovery is beginning to contribute to economic growth as it has in past recoveries.

So-called housing starts surged nearly 10 percent last month to an annual rate of 1.17 million, just a touch below a post- recession high. Builders were especially active in the Northeast and South that suffered so much from last winter.

And single-family housing starts in June were at a rate of 685,000; this is 0.9 percent below the revised May figure of 691,000. The June rate for units in buildings with five units or more was 476,000.

image

Graph: Calculated Risk

“While builders are reporting overall confidence in the housing market, they continue to note difficulties accessing land and labor,” said NAHB Chief Economist David Crowe. “These headwinds appear to be affecting production gains in the single-family sector.”

Builder confidence was also the highest since 2005, according to the National Association of Home Builders. Builder confidence in the market for newly built, single-family homes in July hit a level of 60 on the just released National Association of Home Builders/Wells Fargo Housing Market Index (HMI) while the June reading was revised upward one point to 60 as well. The last time the HMI reached this level was in November 2005.

“This month’s reading is in line with recent data showing stronger sales in both the new and existing home markets as well as continued job growth,” said NAHB Chief Economist David Crowe. “However, builders still face a number of challenges, including shortages of lots and labor.”

Construction on multi-dwelling projects with five units or more soared to the highest level since 1987. Builders have devoted more effort to these kinds of projects instead of their traditional focus on single-family homes because of a growing trend toward renting, especially among younger millennials, children of the baby boomers. Greater difficulty in obtaining mortgages has also compelled some people to rent.

Yet rising demand for rental units has also forced up the cost of housing, especially amid a shortage of new units available. A separate government report on Friday showed another sizable increase in the cost of shelter in June, with housing expenses up 3 percent in the past year.

It all points to rising demand for shelter for the millennial generation that is seeing better jobs and has to begin to pay off their huge educational loans. It’s a negative sum game for both student-borrowers and the economy. According to the Consumer Financial Protection Bureau, student loan debt has reached a new milestone, crossing the $1.2 trillion mark — $1 trillion of that in federal student loan debt, says Forbes Magazine.

According to The Institute for College Access and Success (TICAS) Project on Student Debt, the average borrower will graduate $26,600 in the red.  While there are lots of stories of graduates with crippling debt of $100,000 or more, this is the case for only about 1 percent of graduates.  Yet 10 percent of college graduates accumulate more than $40,000.

That is the reason so many millennials can only afford to rent at the moment, and why rental housing construction will be the priority for builders, at least until 2020 when most of the so-called echo boomers (now aged 16 to 35) have matured into adults and begin to form their own families.

Harlan Green © 2015

Follow Harlan Green on Twitter: https://twitter.com/HarlanGreen

Tuesday, July 7, 2015

Pending Home Sales, Mortgage Applications Soar

The Mortgage Corner

Pending home sales continued to rise in May and are now at their highest level in over nine years, according to the National Association of Realtors. Gains in the Northeast and West were offset by small decreases in the Midwest and South. This is why we expect both existing and new-home sales to be the best since 2006 at the height of the housing bubble.

And mortgage activity is soaring, thanks to ultra-low interest rates, with total mortgage origination balances reaching $466 billion in the first quarter -- nearly a 75 percent increase from the same time a year ago, according to the Equifax National Consumer Credit Trends Report.

The Pending Home Sales Index, a forward-looking indicator based on contract signings, climbed 0.9 percent to 112.6 in May and is now 10.4 percent above May 2014. The index has now increased year-over-year for nine consecutive months and is at its highest level since April 2006.

image

Graph: Econoday

Pending sales were strongest in the West, up 2.2 percent in May for a 13.0 percent year-on-year gain. Pending sales in the South, up 10.6 percent year-on-year, have also been strong though the region though lower by 0.8 percent in the latest month. The Midwest was down 0.6 percent for a year-on-year plus 7.8 percent, but were up sharply in the Northeast where housing came back strongly from the severe winter, up 6.3 percent in this report for a year-on-year again of 10.6 percent.

NAR chief economist Lawrence Yun says contract activity rose again in May for the fifth straight month, increasing the likelihood that home sales are off to their best year since the downturn. "The steady pace of solid job creation seen now for over a year has given the housing market a boost this spring," said Yun. "It's very encouraging to now see a broad based recovery with all four major regions showing solid gains from a year ago and new home sales also coming alive."

Equifax said the bulk of mortgage growth has been to first mortgages, which zoomed nearly 80 percent compared to the first quarter of 2014 to $430 billion. The number of first mortgages originated in the first three months of the year was 1.78 million -- a 55 percent increase over the same time a year ago and 14 percent higher than in the fourth quarter of 2014. Originations of home equity lines of credit (HELOCs) rose 30 percent to $30.9 billion and new home equity installment loans climbed 13.6 percent to $5.0 billion.

  • Average first-lien mortgage loan amounts rose to $232,547 in March, an 11.5% increase over March 2014;
  • The number of first mortgages originated in the first three months of the year was 1.78 million, a 54.9% increase over the same time a year ago and 13.6% higher than in the fourth quarter of 2014;
  • The share of first mortgage accounts originated in the first quarter that went to consumers with an Equifax Risk Score below 620 (generally considered subprime) was 4.5%;
  • 3.1% of newly originated balances in the first quarter went to borrowers with subprime credit scores. For the same time a year ago, the share was 3.5%; and
  • The average loan amount for a first mortgage originated to a borrower with a subprime credit score in March 2015 was $152,260, up 9.9% from March 2014.

"The drop in mortgage rates that began in the fourth quarter of last year kicked off a refinance boomlet that accelerated in the first quarter, as rates fell further, averaging just 3.7 percent for the first three months of this year," said Amy Crews Cutts, Chief Economist at Equifax. "While rates have recently reversed that trend and are back up to about 4 percent, they remain extremely low historically. These rates, coupled with a housing market that is showing signs of vigor, should carry the mortgage business over the summer."

So we are seeing the housing sector back to normal growth. Existing-home sales also rose 5.1 percent in May to a 5.35 million annual rate. Home sales were plus 9.2 percent which, outside of the March 11.9 percent, is the strongest rate in nearly two years. And prices are rising, up 7.9 percent year-on-year at a median $228,700.

But, "Housing affordability remains a pressing issue with home-price growth increasing around four times the pace of wages," adds Yun. "Without meaningful gains in new and existing supply, there's no question the goalpost will move further away for many renters wanting to become homeowners."

Harlan Green © 2015

Follow Harlan Green on Twitter: https://twitter.com/HarlanGreen

Tuesday, June 2, 2015

Pending Home Sales In Record Territory

The Mortgage Corner

Pending home sales hit a 9-year high in April, according to data released last Friday by the National Association of Realtors. This is an early sign that housing construction and sales will come out of their winter hibernation, as consumers begin to spend again.

The NAR’s Pending Home Sales Index rose for the fourth consecutive month in April, increasing 3.4 percent to 112.4 – a 14 percent increase over April 2014 and the largest annual increase since September of 2012. The index is now at its highest level since May of 2006.

image

Graph: Econoday

NAR chief economist Lawrence Yun said that there have been steady gains in contract activity each month this year, indicating strong buyer demand. “Realtors are saying foot traffic remains elevated this spring despite limited – and in some cases severe – inventory shortages in many metro areas,” he said. “Homeowners looking to sell this spring appear to be in the driver’s seat, as there are more buyers competing for a limited number of homes available for sale. As a result, home prices are up and accelerating in many markets.”

That has to be why construction spending is surging, as I predicted last week. Higher pending sales mean increased demand for new homes with too few existing homes available for sale at reasonable prices.

image

Graph: Calculated Risk

The U.S. Census Bureau of the Department of Commerce just announced that construction spending during April 2015 was up at a seasonally adjusted annual rate of $1,006.1 billion, 2.2 percent above the revised March estimate of $984.0 billion, and 4.8 percent above the year ago estimate of $960.3 billion.

Private non-residential spending looks very strong, up 3.1 percent and led by the power and office sectors. Public spending is also strong with a large gain for highways & streets, and a surge in educational building. Though the gain in public spending came entirely from the state and local governments as federal construction spending declined for a second straight month.

And personal incomes are beginning to show some life, which may be the underlying reason consumers are feeling more confident. Personal income increased $59.4 billion, or 0.4 percent in April, according to the Bureau of Economic Analysis, though personal consumption expenditures (PCE) decreased just $2.6 billion, or less than 0.1 percent. But we see spending also increasing with increased consumer confidence in future prospects, according to the confidence surveys.

image

Graph: Econoday

The Conference Board’s Consumer Confidence gauge is rising to pre-recession highs; another reason why both new and existing-home sales have been stronger of late. The consumer confidence report for May came in at 95.4, slightly higher than April. Income expectations are up slightly and buying plans are higher across the board, including for autos, homes, and especially for appliances.

The U. of Michigan’s consumer sentiment report also showed strength, ending May at 90.7 vs the mid-month flash of 88.6. The implied reading for the last two weeks of the month is about 93 which, though down from April's 95.9 and January's peak over 98, is still very solid, according to Econoday.

Harlan Green © 2015

Follow Harlan Green on Twitter: https://twitter.com/HarlanGreen

Tuesday, May 26, 2015

New-Home Sales, Case Shiller Index On the Rise

The Mortgage Corner--II

As if to confirm U.S. housing starts and building permits’ jump to their highest levels in nearly 7-1/2 years, the sales rate of new single-family houses in April 2015 rose even higher at a seasonally adjusted annual rate of 517,000, according to estimates released jointly today by the U.S. Census Bureau and the Department of Housing and Urban Development. “This is 6.8 percent above the revised March rate of 484,000 and is 26.1 percent above the April 2014 estimate of 410,000,” per the Census Bureau.

image

Graph: Calculated Risk

It means home construction is returning to pre-recession levels, as is the demand for more housing, which will spur more housing construction. The sales rate is rising fast enough to drop housing inventories to 4.6 months, at the low end of inventories.

The south was the biggest gainer, with construction up 5.8 percent. Also, the median price rose to $297,300 for a strong 8.3 percent year-on-year gain. So sales have finally reached the long term trend line, which should signal a longer term recovery as buyer’s enthusiasm tends to feed on itself, according to Behavioral Economist and Nobelist Dr. Robert Shiller.

image

Graph: Calculated Risk

As if to confirm the rising enthusiasm of buyers, the S&P Case-Shiller Home Price Index continued its climb to post-recession highs, with San Francisco now up 10.31 percent year over year, Denver and Dallas up 10 percent and 9.3 percent, respectively. Denver and Dallas housing prices have almost doubled since the Great Recession, per the above graph. San Francisco’s prices are just now approaching their bubble high.

“Home prices have enjoyed year-over-year gains for 35 consecutive months,” says David M. Blitzer, Managing Director & Chairman of the Index Committee for S&P Dow Jones Indices. “The pattern of consistent gains is national and seen across all 20 cities covered by the S&P/Case-Shiller Home Price Indices…”

Of course lower interest rates were also a factor, as I’ve said, with housing affordability increasing this year, according to the National Association of Home Builders/Wells Fargo Housing Opportunity Index (HOI).

In all, 66.5 percent of new and existing homes sold between the beginning of January and end of March were affordable to families earning the U.S. median income of $65,800, said the report. “This is up from the 62.8 percent of homes sold that were affordable to median-income earners in the fourth quarter.”

What is another catalyst? Housing formation is recovering, which is largely due to Millennials moving out of their parents’ homes, or higher education venues. Based on unusually low household formation numbers of past several years, "there's a ton of people living in basements," Fundstrat Global Advisors' Tom Lee said in a recent interview with CNBC's "Trading Nation." "Two quarters of pretty decent household formation isn't getting everybody out of the basement. I think this means we have multiple years where household formations are well over 1.3 million, 1.4 million."


Household formation will be the key to future housing growth, as the millenials’ population size has now reached that of the baby boomers, their parents. And many have yet to reach home-buying age. Household formation had dipped as low as 360,000 per annum in recent years, due to the housing bust. So this is yet another sign of a growing pool of homebuyers.

Harlan Green © 2015

Follow Harlan Green on Twitter: https://twitter.com/HarlanGreen

Wednesday, May 13, 2015

2015 Housing Construction Will Surge

The Mortgage Corner

We believe housing construction is about to bloom this spring, due to growing employment. For starters, an additional 45,000 construction jobs were added to nonfarm payrolls in April. This is even though construction spending to date has been flat, according to the Commerce Department. The U.S. Census Bureau of the Department of Commerce announced that construction spending during March 2015 was estimated at a seasonally adjusted annual rate of $966.6 billion, 0.6 percent below the revised February estimate of $972.9 billion. But the March figure is 2.0 percent above the March 2014 estimate of $947.3 billion.

And sales of new single-family houses in March 2015 were at a seasonally adjusted annual rate of 481,000, according to estimates by the U.S. Census Bureau and the Department of Housing and Urban Development, which is slow because of winter weather, but it is still 19.4 percent above last year’s March 2014 estimate of 403,000.

And, housing units authorized by building permits in March were at a seasonally adjusted annual rate of 1,039,000, 5.7 percent below the revised February rate of 1,102,000, but is 2.9 percent above the March 2014 estimate of 1,010,000, signaling more construction ahead. And the single-family component is up 4.4 percent from February, which is double the multi-family component. Single family construction employs many more workers per unit.

This is while overall employment could be returning to pre-recession levels, as we said last week. The U.S. churned out 223,000 new jobs in April, and the unemployment rate slid to 5.4 percent from 5.5 percent, which means the US economy’s deep freeze was temporary. It was a short hibernation, in a word, but we are still not out of the Great Recession woods, as we said last week.

image

Graph: Marketwatch

The Small Business Optimism Index also increased 1.7 points from March to 96.9, reports the NFIB, with the employment component especially strong. Small business does 50 percent of all hiring, so this is another sign of a healthy jobs market. Twenty-seven percent of all owners reported job openings they could not fill in the current period, up 3 points from March. And a net 11 percent plan to create new jobs, up 1 point and a solid reading.

image

Graph: Calculated Risk

Lastly, the Labor Department’s most recent JOLTS report showed 5 million job openings, and a higher Quits rate, meaning more workers were able to quit their current job to find a better position. Quits are up 14 percent year-over-year. These are voluntary separations, as we said (see light blue columns at bottom of graph for trend for "quits"), and the number of job openings are up 19 percent YoY, which is another sign of a robust jobs market.

The bottom line is housing construction should begin to expand in the spring and summer. This will ultimately relieve the problem of lack of inventory, and should help first time homebuyers by relieving price pressures that have been increasing as housing stocks have declined.

Harlan Green © 2015

Follow Harlan Green on Twitter: https://twitter.com/HarlanGreen

Saturday, April 25, 2015

March New-Home Sales A Dud

"Sales of new single-family houses in March 2015 were at a seasonally adjusted annual rate of 481,000, according to estimates released jointly today by the U.S. Census Bureau and the Department of Housing and Urban Development. This is 11.4 percent below the revised February rate of 543,000, but is 19.4 percent above the March 2014 estimate of 403,000."

image

Graph: Calculated Risk

The March result was a disappointment, mainly in the south, where sales fell 15.8 percent. And because builders continue to build—housing starts are close to the million unit mark again—housing inventories are rising and prices are falling. The supply of new homes rose to 5.3 months, while the median price fell to 1.5 percent to $277,400. Year-on-year, the median price to down 1.7 percent while sales are up 19.4 percent, a discrepancy that points to price discounting by builders, says Calculated Risk.

What is behind the up and down gyration in sales? Winter is still with us, for one thing. And many of the southern and Midwest states are being pounded by tornadoes, as well as torrential rains. Lower oil prices could also be hurting an area heavily dependent on the oil and gas industries.

We will know next week if job creation will resume from February’s low numbers, and so consumer confidence remains high. Mortgage activity is high, highest level in years, what with interest rates still at record lows. (The 10-year Treasury yield is back down to 1.91 percent, and Eurozone bonds now have negative interest rates, meaning banks have to pay their clients to borrow money, because there is so little demand for loans.)

Mortgage applications increased 2.3 percent from one week earlier, according to data from the Mortgage Bankers Association's (MBA) Weekly Mortgage Applications Survey for the week ending April 17, 2015.  The Market Composite Index, a measure of mortgage loan application volume, increased 2.3 percent on a seasonally adjusted basis from one week earlier.  The seasonally adjusted Purchase Index increased 5 percent from one week earlier to its highest level since June 2013.  The unadjusted Purchase Index increased 6 percent compared with the previous week and was 16 percent higher than the same week one year ago.

"Purchase applications increased for the fourth time in five weeks as we proceed further into the spring home buying season. Despite mortgage rates below four percent, refinance activity increased less than one percent from the previous week," said Mike Fratantoni, MBA's Chief Economist.  

The fact that purchase mortgage applications now comprise 44 percent of all applications, the highest in years, as we said, means the Fed’s policy of keeping interest rates as low as possible until household incomes begin to rise again is the right policy to kick start the housing market, and bring in those first time homebuyers who have been renting until know.

It also means some overbuilding of new homes is necessary to build up housing inventories for sale, and thus keep home prices in the affordable range.

Harlan Green © 2015

Follow Harlan Green on Twitter: https://twitter.com/HarlanGreen

Tuesday, April 21, 2015

Fannie Says Better Growth For Rest of 2015

Popular Economics Weekly

“Economic activity was suppressed in the first quarter due largely to the West Coast port disruptions and difficult weather patterns across the Northeast, but the economy is expected to gain momentum throughout the spring and reach previously anticipated levels by year-end,” said a just released Fannie Mae’s Economic & Strategic Research Group report.

Is this a repeat of 2014, when growth surged for the rest of the year? It is what happened in 2014, due to last year’s deep freeze. In fact, it should be a repeat, as consumers aren’t spending much in Q1, the weather is as bad—whether blizzard, flood, or drought in the west—and Congress may be as gridlocked in ideological warfare as ever, and is therefore unable to do more harm to growth that it has in the past.

image

Graph: Trading Economics

We started out 2014 with a negative GDP growth rate of minus -2.1 percent. But it jumped to 4.6 and 5 percent in Q2 and Q3, such was the pent up demand from those very good jobs numbers. Just in the last 12 months 3.1 million jobs have been created, and consumers are in an almost ebullient mood. But consumers have to stop saving so much of their increased earnings, if that is to happen.

Fannie believes there’s also another ingredient to boost growth. An improved housing market as incomes improve and interest rates stay near record lows. “Our forecast calls for an increase in economic growth to 2.9 percent for 2015, which is a slight downward adjustment from our prior forecast but solid improvement nonetheless,” said Fannie Mae Chief Economist Doug Duncan

.image

Graph: Econoday

Stronger retail sales gave an indication of the future. Sales of goods and services in March rebounded 0.9 percent after dropping 0.5 percent in February. The market consensus for March was for a 1.1 percent boost. Excluding autos, sales gained 0.4 percent, following no change in February. Expectations were for a 0.6 percent increase. Gasoline sales dipped 0.6 percent after a 2.3 percent increase in February. Excluding both autos and gasoline, sales rebounded 0.5 percent after declining 0.3 percent in February.

 image

Graph: Econoday

However, the Conference Board’s Index of Leading Indicators is not so optimistic about future growth. Its 12 components predicted slower growth over the next 6 months. “In the negative column are building permits which, Thursday's disappointing housing starts report, fell sharply,” said Econoday.” This is a reminder that housing, despite some hopeful signs, has yet to boost economic growth. And declines in the factory workweek and for factory orders are reminders that the manufacturing sector, due in part to weak exports (and strong dollar), may now be pulling down economic growth.”

Let’s hope Fannie Mae is right. “Although we are beginning this year at a more modest pace compared to the above-trend numbers seen at mid-year 2014,” says the report, “the country’s aggregate income has benefitted from the improving labor market, which, combined with low gasoline prices, should help drive higher auto sales and overall consumer spending throughout 2015.”

So it may just be the gloom of winter’s cold that has been holding back economic growth in Q1, especially housing, and that more buyers will enter the housing market this selling season.

Harlan Green © 2015

Follow Harlan Green on Twitter: https://twitter.com/HarlanGreen

Monday, March 16, 2015

2014 Household Formation Rebounds

Financial FAQs

Breaking news. The latest Homeownership & Vacancy Survey, released by the Census Bureau, estimated household formation surged to 1.7 million in 2014 from 400,000 the previous year. That is really big news. Household formation, which is the bottom line demand factor for RE sales, mortgage financing, as well as the insurance and construction industries—in fact, anything related to the housing market--may finally begin to show growth from the horrible post-Great Recession years.

image

Graph: Trading Economics

This graph tells the story. Projections were for a recovery to 800,000 new households in 2014, but it looks like Millennials are beginning to leave home, or even college, and form new households in greater numbers—especially the oldest ages from 30 to 36 years. And most demographers agree millennials were born between 1980 to 1996, which means the oldest are reaching the age when they want to start a family, and that usually means buying a home.

Many of those have been renting, and we actually saw a 2.1 million surge in rental units in 2014, which has to account for many of those new households, according to the Census Bureau survey.

In fact, over the past year all the growth in net household formations has been among renters, according to the U.S. Census. For those 35 years old and younger, their home ownership rate has fallen from 44 percent to 36 percent over the past decade, which is why construction of multi-family apartments is at the highest level in a quarter-century this year.

And we know why. They can’t afford to buy until they reach an older age—in fact 30 years of age is when they achieve the median income wage of $42,000, according to a new Georgetown University study.

Through analyzing about three decades of census data—from 1980 to 2012—the study found that on average, young workers are now 30 years old when they first earn a median-wage income of about $42,000, a marker of financial independence, up from 26 years old in 1980.

image

Graph: fivethirtyeight.com

Economists now estimate millennials will spend some $1.6 trillion on home purchases and $600 billion on rent over the next five years, more per person than any other generation with more of them opting for more affordable rents versus paying the big price tags to buy homes, according to a new report from The Demand Institute, a non-profit think tank operated by The Conference Board and Nielsen. Millennials will form just over eight million new households, albeit most of them rental households, as we said.

But there is some good income news. The 2014 numbers aren’t in for a breakdown in median incomes, but the Q4 2014 Federal Reserve Flow of Funds report says the net worth of households and nonprofits rose to $82.9 trillion during the fourth quarter of 2014. The value of directly and indirectly held corporate equities increased $742 billion and the value of real estate rose $356 billion.

This can only boost the millennial generation’s financial well-being, as well, and so the housing market and its ancillary industries.

Harlan Green © 2015

Follow Harlan Green on Twitter: https://twitter.com/HarlanGreen

Monday, March 2, 2015

Pending Home Sales, Consumer Confidence Looking Better

The Mortgage Corner

Oh, the winter is freezing consumers, as I’ve said! It affected January existing-home sales, but the NAR’s January Pending Home Sales index rose sharply 1.7 percent. So pending sales of contracts signed may give a boost to existing-home sales in coming months that fell slightly in January.

Part of the reason for slightly lower home sales, according to the NAR, is that homeowners aren’t changing homes every 7 years on average as they used to. It’s now 10 years, probably due to the busted housing bubble, loss of so much housing equity, and the Great Recession, of course.

image

Graph: Econoday

But this marks the fifth consecutive month of year-over-year gains for pending sales with each month accelerating the previous month's gain, said the NAR.

Lawrence Yun, NAR chief economist, says for the most part buyers in January were able to overcome tight supply which highlights the underlying demand that exists in today's market. “Contract activity is convincingly up compared to a year ago despite comparable inventory levels,” he said. “The difference this year is the positive factors supporting stronger sales, such as slightly improving credit conditions, more jobs and slower price growth.”

“All indications point to modest sales gains as we head into the spring buying season,” says Yun. “However, the pace will greatly depend on how much upward pressure the impact of low inventory will have on home prices. Appreciation anywhere near double-digits isn't healthy or sustainable in the current economic environment.”

He is right, of course. With consumer confidence is at an all-time, post-recession high, which also bodes well for housing demand—though February's consumer confidence index fell 7.4 points to 96.4 from a revised 103.8 in January which was a 7-1/2 year high.

The dip was centered in the expectations component which fell a very steep 9.8 points to 87.2. Could it just be the winter blahs, when jobs are harder to find in part because winter weather keeps consumers from spending more?

image

The second main component of the confidence index, consumers’ present situation, also dipped but less severely, down 2.7 points to 110.2. Here, a closely watched sub-component, jobs currently hard to get, rose 1.6 percentage points to 26.2 percent which is mild indication of weakness for the monthly employment report that comes out this Friday, let us not forget.

The employment consensus is for 230,000 (Wrightson ICAP) to 235,000 (Bloomberg) jobs, a decline in the unemployment rate to 5.6 percent (reversing last month’s surprise uptick), a 0.2 percent increase in average hourly earnings and an unchanged 34.6-hour workweek.

February unemployment reports tend to start out slow and be revised in coming months, as it has in past years—by as much as 50,000 additional jobs, which would boost consumers’ attitudes.

Reuter’s Wrightson ICAP Research says February nonfarm payrolls have been revised over the subsequent two reports in each of the past five years by an average of more than 50K. Their forecast assumes that February nonfarm payroll growth this year will end up somewhere around 280K, so the preliminary estimate probably won’t be quite as strong as the final value. (Their forecast also assumes that the net revision to December and January this month will be positive but probably 25K or less).

Harlan Green © 2015

Follow Harlan Green on Twitter: https://twitter.com/HarlanGreen