Showing posts with label S and P Case-Shiller index. Show all posts

Wednesday, January 26, 2022

Best Home Sales in Years

 The Mortgage Corner

Home sales are holding up and prices slowly moderating, even with limited inventories. December new-home sales jumped 12 percent in a year, according to the US Census Bureau. Also in 2021, existing-home sales totaled 6.12 million – an increase of 8.5 percent from the prior year and the highest annual level since 2006.

“Sales of new single‐family houses in December 2021 were at a seasonally adjusted annual rate of 811,000, according to estimates released jointly today by the U.S. Census Bureau and the Department of Housing and Urban Development.  This is 11.9 percent (±20.3 percent) above the revised November rate of 725,000, but is 14.0 percent (±16.6 percent)* below the December 2020 estimate of 943,000. An estimated 762,000 new homes were sold in 2021. This is 7.3 percent (±5.1 percent) below the 2020 figure o 822,000.”

Census.gov

New-home sales have been rising steadily since the end of the Great Recession and housing bubble in 2009, as the Census graph shows. Why not, with so few homes for sale, according to the Realtors?

"Buyer competition alone is unrelenting, but home seekers have also had to contend with the negative impacts of supply chain disruptions and labor shortages this year," said NAR chief economist Lawrence Yun. "These aspects, along with the exorbitant prices and a lack of available homes, have created a much tougher buying season."

The inventory of unsold existing homes fell to an all-time low of 910,000 at the end of December,, which is equivalent to 1.8 months of the monthly sales pace, also an all-time low since January 1999.

This is while last week, on a year-over-year basis, private residential construction spending is up 16.3 percent. Non-residential spending is up 6.7 percent year-over-year. Public spending is down 0.8 percent year-over-year.

That’s why the inventory of homes under construction at 263,000, is the highest since 2007.

Calculated Risk

Housing prices are beginning to slow their climb as can be seen in the above Calculated Risk graph. CR’s Bill McBride recently commented on the price moderation:

“The MoM increase in Case-Shiller was at 1.14%; still historically high, but lower than the increases in the 2nd half of 2020 and first half of 2021. House prices started increasing sharply in the Case-Shiller index in August 2020, so the last 16 months have all been historically very strong. But the peak of MoM growth is behind us - and the year-over-price growth is starting to decelerate.”

So let us hope that for sale inventories continue to grow and housing prices continue to moderate in 2022, so that more homes become affordable. The demand for housing is at an all-time high and consumers’ personal savings still at a historic high.

There is no better time to recover from COVID-19’s many variants.

Harlan Green © 2021

Follow Harlan Green on Twitter: https://twitter.com/HarlanGreen

Wednesday, August 14, 2019

How Low Can Interest Rates Go?

Popular Economics Weekly


 Calculatedriskblog

 Why are interest rates so low—not just in the US? It’s been below 0 percent in the northern EU countries and Japan for years because there is little worldwide inflation, which means there’s not sufficient demand for the things people and businesses buy that would boost inflation and interest rates higher.

The housing market is usually an infallible indicator of inflation trends. The S&P Case-Shiller Home Price Index, for instance, shows housing prices rising 3.4 percent annually in May, when it was rising at 5 percent over the past several years. It’s a 3-month average of same-home sales that smooths out some of the bumps due to the difficulties in collecting national sales data that always qualify the price estimates with + or – double figure brackets.

The above Case-Shiller graph highlights the percentage changes. Its huge dip occurred during the Great Recession that busted the housing bubble. Its highest point since then was in 2014, and it began to dip below 5 percent in early 2018.

There’s not much the Central Banks can do about the falling interest rates, since they are already so low. They equivocate as much as the financial markets, which tells us things could get worse. The stock market is swinging wildly as more investors flee to save haven investments like bonds, which drives down interest rates further.

For one thing, JP Morgan says a recession could occur in 9 months if Trump can’t resolve the China trade war soon (Hong Kong unrest, for starters?). And economists are beginning to conjecture that if the inverted yield curve—with 1.65 percent 10-yr Treasury yield below the 2-2.5 percent fed funds rate and 2-year bond yields—remains inverted for too long, 1) banks could cut back their lending sharply, tightening credit markets, and 2) investor confidence will fall as more flee from stocks to bonds, while corporations cut back on capex spending due to future uncertainty.

It certainly looks like housing prices might continue to decline, in spite of still record-low mortgage rates, and even though mostly higher-priced homes are being built these days.

The conforming 30-year fixed mortgage rate has now fallen to 3.25 percent, the lowest I’ve seen it in my 30+ years as a Mortgage Banker, though the Prime rate on which most installment and credit card rates are based is at 5.25 percent. Prime dropped 0.25 percent in concert with the last week’s 0.25 percent Federal Reserve rate reduction, but stay tuned on further Prime rate drops, if consumers cut back on their spending.

Consumers might continue to spend for the rest of this year if consumer sentiment holds up, because the job market is still expanding. The latest JOLTS report (Job Openings and Labor Turnover Survey) says there were 1.65 million more job openings (7.35 million) than the 5.7 million new hires in July.

Why do I see interest rates, and inflation declining further? There’s a worldwide decline in foreign trade that totaled $17.7 trillion in 2017, on which most economies depend. And tariffs will become more reciprocal as other countries retaliate with their own import tariffs. It should be obvious to all by now that tariffs are really a tax on imports, and financial markets know this.

So the financial markets are telling us this isn’t the right time to raise taxes.

Harlan Green © 2019

Follow Harlan Green on Twitter: https://twitter.com/HarlanGreen

Friday, July 5, 2019

Is Housing Market in Gradual Decline?

The Mortgage Corner


Happy 4th of July, everyone, even though it looks like we are nearing the end of this housing cycle; and maybe this business cycle as well.  But we can still celebrate what is now the longest recovery from any recession since WWII.

This Case-Shiller Home Price Index may summarize the housing market going forward. Its 3-month average of same-home prices has been declining since last year. The priciest housing markets like Seattle and San Francisco have risen the least, while Las Vegas and Phoenix that were hit the hardest because of overbuilding during the housing bubble show the sharpest increases.

The S&P CoreLogic Case-Shiller U.S. National Home Price NSA Index, covering all nine U.S. census divisions, reported a 3.5% annual gain in April, down from 3.7% in the previous month. The 10-City Composite annual increase came in at 2.3%, up from 2.2% in the previous month. Las Vegas, said the report.

Phoenix and Tampa reported the highest year-over-year gains among the 20 cities. In April, Las Vegas led the way with a 7.1% year-over-year price increase, followed by Phoenix with a 6.0% increase, and Tampa with a 5.6% increase. Nine of the 20 cities reported greater price increases in the year ending April 2019versus the year ending March 2019.

Another marker is new-home sales, which feeds into the GDP report. It plunged in May, down to 626,000 annualized units, vs. 673,000 in April. Prices also fell sharply, down 8.1 percent on the month to a median $308,000. Year-on-year, the median is down 2.7 percent and right in line with the 3.7 percent decline in sales.

The reasons for its weakness are many. Fewer newly-adult Millennials—the largest population cohort—are buying homes because of soaring student debt and fewer entry-level homes on the market.

And consumer confidence is also sinking. The Conference Board’s Confidence Index just declined from 134.1 to 121.5 in June, a huge drop after two months of increases.
“The escalation in trade and tariff tensions earlier this month appears to have shaken consumers’ confidence," said the Conference Board. "Although the Index remains at a high level, continued uncertainty could result in further volatility in the Index and, at some point, could even begin to diminish consumers’ confidence in the expansion.”
Confidence in jobs also showed a slight decline, said the report, and may be a predictor of weakness in Friday’s unemployment report.

This may be a temporary blip, as the Federal Reserve has hinted that it may begin to drop short term interest rates at their July FOMC meeting. And mortgage rates are again at rock-bottom. So more consumers may reverse course and jump back into housing purchases.


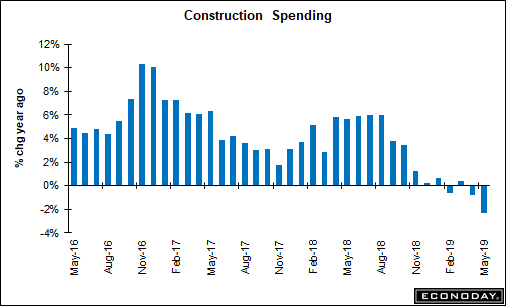
They will face a declining supply, however.  Econoday summarized the current construction industry with these comments:

“Residential spending fell 0.6 percent in May and now shows declines each month this year. Compared to May last year, residential spending is down a very steep 11.2 percent. Single-family homes, the dominant category on the residential side, fell in May and are down 7.6 percent on the year. The one residential plus is new multi-family homes which, reflecting demand tied to high costs for single-family homes, are up 9.3 percent.
So if very low interest rates can’t sustain housing sales, what can? We seem to be nearing the end to this recovery from the Great Recession in its record-breaking 11th year.

Harlan Green © 2019

Follow Harlan Green on Twitter: https://twitter.com/HarlanGreen

Wednesday, October 26, 2016

Housing Sales, Prices Continue Skyward

The Mortgage Corner

The S&P Case Shiller Home Price Index continues to soar, with Seattle and Portland existing-home prices up double digits in a year, while Dallas and Denver are up some 8 percent annually.

Case-Shiller’s national index is within a hair of its 2006 peak — just 0.1 percent below. The smaller 20-City index is 7.2 percent lower. Tight inventory has constrained the housing market for years, driving prices higher. Many analysts have expected to see price gains decelerate in response, especially in overheated metros like San Francisco, but that hasn’t happened yet. San Francisco prices were flat in July but picked up again in August, and are up 6.7 percent in a year.

September existing-home sales are also soaring again, after a slight drop in August. September sales surged 3.2 percent to a 5.470 million annualized rate that exceeds Econoday's high estimate. The key single-family component leads the report, up 4.1 percent to a 4.860 million rate while condos, where choices are limited and permits for new building are on the rise, fell 3.2 percent to a 610,000 rate.


It is possible because mortgage rates are still at record lows, with the 30-year conforming fixed rate still as low as 3.0 percent for those that want to buy down the rate and have excellent credit. Fannie and Freddie offer their best rates to those with 740 plus credit scores.

This has enabled more first-time homebuyers to own homes, with their percentage up to 34 percent of sales. Regionally, September sales were strongest in the West, up 5.0 percent for a year-on-year gain of 1.6 percent, and in the Midwest, up 3.9 percent on the month for a year-on-year plus 2.3 percent. Total year-on-year resales are up but only fractionally, at plus 0.6 percent.

But the existing-home inventory of homes for sale is still at a 4.5 month supply at the current sales rate, hardly enough to supply the rising demand from first-time homebuyers. And so new-home sales have to eventually fill the void.

New-home sales are still struggling in September, up 3.1 percent to a 593,000 annualized rate, though sharp downward revisions to both August (575,000 from 609,000) and also July (629,000 from 659,000) do lower expectations for more solid strength in the new home market. But year-on-year, sales are up 30 percent in what is a sharp contrast to the fractional 0.6 percent gain on the existing-home side.


The potential for more inventory is mixed with new-home construction permits higher in what is a deceptively solid housing starts & permits report. Starts plunged what looks like a shocking 9.0 percent in September, to a 1.047 million annualized rate. But the drop is tied entirely to the volatile multi-family component where starts fell a massive 38 percent in the month to a 264,000 rate. The more important single-family component is up sharply in its own right, 8.1 percent higher to a 783,000 rate.

We can therefore see from the graph that starts are still on an upward trend, which is needed if we want housing prices to mitigate their sharp rises of late, and so make housing more affordable to those youngest household-forming adults.

The demand is there as evidenced by the sharp rise in new-home prices nationally, up 6.7 percent in the month to a median $313,500. And further price gains can be expected as the year-on-year gain, in contrast to the surge in sales, is only 1.9 percent, says Econoday.  While the existing-home median price is already up 15 percent this year, per the NAR’s affordability index.

Harlan Green © 2016

Follow Harlan Green on Twitter: https://twitter.com/HarlanGreen

Tuesday, August 25, 2015

Record Post-Recession Home Sales, Construction, Case-Shiller Prices in July

The Mortgage Corner

With all the bad news coming from the stock market, it’s good to know that this hasn’t affected the housing market. In fact, it’s pushing interest rates lower, so that a conforming 30-year fixed mortgage rate has dropped to 3.50 percent in California. And that will continue to boost home sales (and prices, of course). That’s why Case-Shiller shows two cities already above their bubble highs, and the Conference Board’s Index of Leading Economic Indicators (LEI) shows continued strong growth ahead.

Total existing-home sales, which are completed transactions that include single-family homes, townhomes, condominiums and co-ops, increased a whopping 2 percent to a seasonally adjusted annual rate of 5.59 million in July from a downwardly revised 5.48 million in June. Sales in July remained at the highest pace since February 2007 (5.79 million), have now increased year-over-year for ten consecutive months and are 10.3 percent above a year ago.

image

Graph: Econoday

Lawrence Yun, NAR chief economist, says the increase in sales in July solidifies what has been an impressive growth in activity during this year's peak buying season. "The creation of jobs added at a steady clip and the prospect of higher mortgage rates and home prices down the road is encouraging more households to buy now," he said. "As a result, current homeowners are using their increasing housing equity towards the downpayment on their next purchase."

And demand is well ahead of thin supply, at 4.8 months at the current sales rate vs 4.9 and 5.1 in the two prior months and 5.6 months in July last year. Sales are up 10.3 percent year-on-year, well ahead of the median price which, at $234,000, is up 5.6 percent.

The S&P/Case-Shiller U.S. National Home Price Index recorded a higher year-over-year gain with a 4.5 percent annual increase in June 2015 versus a 4.4 percent increase in May 2015. The smaller 10-City Composite had marginally lower year-over-year gains, with an increase of 4.6 percent year-over-year. Denver and Dallas are the two cities now above their 2007 bubble highs, while Denver (+10.2%), San Francisco (+9.5%) and Dallas (+8.2%) had the biggest year over year increases.

image

Graph: Calculated Risk

This mismatch of supply vs. demand means even higher existing-home prices ahead. Especially since housing construction is just beginning to play catch up after years of low growth—no coincidence, given the rising demand for housing of any kind—rental as well as for prospective homeowners. Led by a strong jump in single-family production, nationwide housing starts inched up 0.2 percent to a seasonally adjusted annual rate of 1.206 million units in July, according to newly released data from the U.S. Department of Housing and Urban Development and the Commerce Department. This is the highest level since October 2007.

It’s also why the Conference Board’s Index of Leading Economic Indicators (LEI) continues to show moderate growth for the next 6 months, and is up 1.7 points from January to July. “The U.S. LEI fell slightly in July, after four months of strong gains. Despite a sharp drop in housing permits, the U.S. LEI is still pointing to moderate economic growth through the remainder of the year,” said Ataman Ozyildirim, Director of Business Cycles and Growth Research at The Conference Board.

Swings in housing permits have been distorting recent LEI readings including for July. Permits, which fell 16 percent in Tuesday's housing starts report, more than offset what are a run of mostly neutral readings among other components. Given the uncertainties of measuring housing data (readings with plus or minus 11 percent variations are common) the index could have added another 0.54 points to the July indicator, instead of subtracting that amount, for a much stronger reading.

The strongest component is the rate spread which reflects the Fed's ongoing accommodative policy. Also pointing to strength are initial jobless claims, which are at rock bottom lows, and the report's credit index which points to a rise ahead for lending.

So what’s happening in China and the so-called emerging markets (including the Petro states, and Russia) will help to keep interest rates low, housing strong, and maybe the Fed from raising their short-term rates for some time to come.

Harlan Green © 2015

Follow Harlan Green on Twitter: https://twitter.com/HarlanGreen
Monday, July 13, 2015

Home Prices Increase With Jobs

The Mortgage Corner

The S&P Case-Shiller Home Price Index is the bell weather for real estate and home prices these days. It not only reports housing prices, but what affects those prices, and jobs have to be the most important indicator of housing health. So it’s probably not surprising that cities in the Case-Shiller 20-city index that have the fastest job growth also have the highest price growth.

image

Graph: S&P

For instance, Dallas, San Francisco, Tampa and Denver all had approximately 9-10 percent annual price increases and 3 percent plus annual job growth. Before seasonal adjustment, the 10-City and 20-City Composites posted gains of 1.0 percent and 1.1 percent month-over-month, respectively.

image

Graph: Calculated Risk

But after seasonal adjustment, the 10- and 20-city composites were up just 0.3 percent and 0.4 percent. This is a far less meaningful statistic, as the ‘seasonal adjustment’ means above what is normal for that time of year. So prices actually rose 1 to 1.1 percent on average, a huge increase and why housing in cities such as San Francisco is becoming so expensive. That’s why all 20 cities reported increases in April before seasonal adjustment; but after seasonal adjustment, 12 were up and eight were down, said Calculated Risk.

image

Graph: Econoday

Bottom line is that all depends on the job market, which is still growing robustly. The Labor Department’s JOLTS report said job openings are up and employers are holding onto the employees that they have. Job openings rose 0.5 percent in May to a record 5.363 million vs 5.334 million in April. The separations rate dipped 2 tenths to 3.3 percent with the quits rate unchanged at 1.9 percent but with the layoff rate down slightly.

The hiring rate also dipped 1 tenth to 3.5 percent perhaps reflecting the increasing difficulty of finding qualified employees. The unemployment rate is down to 5.3 percent, but that’s because more workers stopped looking for work than were added to payrolls.

So where is the housing market this selling season? Pending-home sales are booming at the highest rate in 9 years, which means good sales for the rest of 2015, since we believe interest rates can’t climb much more this year. Why? The Fed’s Janet Yellen said so in her most recent press conference. The 30-year fixed conforming rate even dropped briefly to 3.625 percent for 1 origination Pt. last week.

Harlan Green © 2015

Follow Harlan Green on Twitter: https://twitter.com/HarlanGreen

Thursday, April 2, 2015

Housing In Recovery-Pending Home Sales Soar

The Mortgage Corner

February Pending Home Sales Index, a forward-looking indicator based on contract signings, rose 3.1 percent to 106.9 in February from a slight downward revision of 103.7 in January and is now 12.0 percent above February 2014 (95.4). The index is at its highest level since June 2013 (109.4), has increased year-over-year for six consecutive months and is above 100 – considered an average level of activity – for the 10th consecutive month.

This is while new U.S. homes sold at an annual rate of 539,000 in February to mark the best month of sales in seven years, the government reported Tuesday. The pace of sales for January was also revised up sharply to 500,000. It's the first time annualized sales have hit 500,000 or more for two straight months since early 2008, as we said last week.

NAR chief economist Lawrence Yun, says demand appears to be strengthening as we head into the spring buying season. “Pending sales showed solid gains last month, driven by a steadily-improving labor market, mortgage rates hovering around 4 percent and the likelihood of more renters looking to hedge against increasing rents,” he said. “These factors bode well for the prospect of an uptick in sales in coming months. However, the underlying obstacle – especially for first-time buyers – continues to be the depressed level of homes available for sale.”

In fact, the 30-year conforming fixed rate is in the mid-3 percent range today in California, and hovering near its all-time low.  Even better news is, according to NAR’s monthly Realtors® Confidence Index, the percent share of first-time buyers increased slightly for the first time in February since November 2014, up to 29 percent from 28 percent in January. But such good news may not last, as the depressed level of inventories is continuing to boost home prices, making homes less affordable for those first-timers.

image

Graph: Calculated Risk

The Case-Shiller Home Price Index reports that home prices are firming as the Case-Shiller composite-20 index rose 0.9 percent in January following a 0.9 percent gain in December and a 0.8 percent rise in November. This is the strongest streak for this report since late 2013, and gives us more evidence of the need for more inventory. Year-on-year, however, prices are still on the soft side, up only 4.6 in January and only fractionally higher than the prior two months.

The increase in mortgage applications is another sign that home sales may be increasing this selling season, probably due to the low interest rates. The seasonally adjusted Purchase Index increased 6 percent from one week earlier. ... The unadjusted Purchase Index ... was 8 percent higher than the same week one year ago.

image

Graph: Calculated Risk

“There was a broad based increase in mortgage applications last week relative to the week prior. The increase in purchase volume was led by a nearly 6 percent increase in both conventional and government markets, perhaps signaling that households are finally ready to begin the home-buying season,” said Lynn Fisher, MBA’s Vice President of Research and Economics.

The rise in the share of first time home buyers is not a huge change but may predict more millennials of the Generation Y cohort aged 18-36 years, entering the housing market that have been renting until now. “Several markets remain highly-competitive due to supply pressures, and Realtors are reporting severe shortages of move-in ready and available properties in lower price ranges,” adds Yun. “The return of first-time buyers this year will depend on how quickly inventory shows up in the market.”

So still record low interest rates have to be a major reason both refinance and purchase loan activity has picked up. Conforming 30-year fixed rates are as low as 3.375 percent in California for 1 origination point. This is the rate that prevailed during the Fed’s QE purchase program more than one year ago. It has to be thanks to Fed Chairwoman Janet Yellen who has been unrelenting in her opposition to any interest rate increases until she sees sustainable growth and rising wages.

Harlan Green © 2015

Follow Harlan Green on Twitter: https://twitter.com/HarlanGreen

Thursday, February 26, 2015

January Existing Home Sales, Mortgage Applications Dip

The Mortgage Corner

Oh, the winter freeze! It seems to put the housing market into a deep freeze, as well. Total existing-home sales, completed transactions that include single-family homes, townhomes, condominiums and co-ops, fell 4.9 percent to a seasonally adjusted annual rate of 4.82 million in January (lowest since last April at 4.75 million) from an upwardly-revised 5.07 million in December, said the NAR. Despite January’s decline, sales are higher by 3.2 percent than a year ago.

Lawrence Yun, NAR chief economist, says the housing market got off to a somewhat disappointing start to begin the year with January closings down throughout the country. “January housing data can be volatile because of seasonal influences, but low housing supply and the ongoing rise in home prices above the pace of inflation appeared to slow sales despite interest rates remaining near historic lows,” he said. “Realtors® are reporting that low rates are attracting potential buyers, but the lack of new and affordable listings is leading some to delay decisions.”

image

Graph: Calculated Risk

Better news was that the Chicago Fed National Activity Index (CFNAI) edged up to +0.13 in January from –0.07 in December, with industrial production up. Three of the four broad categories of indicators that make up the index increased from December, and only one of the four categories made a negative contribution to the index in January.

The index is a weighted average of 85 indicators of national economic activity drawn from four broad categories of data: 1) production and income; 2) employment, unemployment, and hours; 3) personal consumption and housing; and 4) sales, orders, and inventories.

Total existing-home inventory at the end of January increased 0.5 percent to 1.87 million existing homes available for sale, but is 0.5 percent lower than a year ago (1.88 million). Unsold inventory is at a 4.7-month supply at the current sales pace – up from 4.4 months in December. The median existing-home price for all housing types in January was $199,600, which is 6.2 percent above January 2014. This marks the 35th consecutive month of year-over-year price gains.

image

This follows the Conference Board’s LEI, which slowed to a not-so-strong plus 0.2 percent versus a slightly downward revised plus 0.4 percent in December. Once again the yield spread is the biggest positive for the index reflecting the Fed's near zero rate policy. Consumer expectations are the 2nd largest positive in the month, though one that may reverse in the next report given last week's plunge in the consumer sentiment index. Credit indications, which continue to be very positive in this report, are the 3rd largest positive.

Both indexes show increased employment in 2015, which should mean home sales will pick up with the selling season and better weather in the spring. “Although sales cooled in January, home prices continued solid year-over-year growth,” adds Yun. “The labor market and economy are markedly improved compared to a year ago, which supports stronger buyer demand. The big test for housing will be the impact on affordability once rates rise.”

Real estate is showing more signs of life, with the Case-Shiller Home Price Index rising again. Data released for December 2014 shows a slight uptick in home prices across the country. The S&P/Case-Shiller U.S. National Home Price Index, which covers all nine U.S. census divisions, recorded a 4.6 percent annual gain in December 2014 versus 4.7 percent in November.

image

Graph: Calculated Risk

Nine cities reported monthly increases in prices ... Both the 10-City and 20-City Composites saw year-over-year increases in December compared to November. The 10-City Composite gained 4.3 percent year-over-year, up from 4.2 percent in November. The 20-City Composite gained 4.5 percent year-over-year, compared to a 4.3 percent increase in November.

image

Graph: US Census Bureau

And lastly, January new-home sales were unchanged, but prices rose. Sales of new single-family houses in January 2015 were at a seasonally adjusted annual rate of 481,000, which is not enough product to keep prices in the affordable range. This is 0.2 percent below the revised December rate of 482,000, but is 5.3 percent above the January 2014 estimate of 457,000.

“In a promising sign, new home sales have been trending at post-recession highs for the past two months,” said NAHB Chief Economist David Crowe. “As the economy strengthens and mortgage rates remain low, we can expect continued upward movement in the housing market this year.”

So still record low interest rates (i.e., 3.50 percent conforming fixed rates) are keeping homebuyer and refinancers interested, but not enthusiastic.   And we believe mortgage rates will remain low, as evidenced by Fed Chairwoman Janet Yellen’s latest congressional testimony, which hinted that said rates could remain low for much of this year.

Harlan Green © 2015

Follow Harlan Green on Twitter: https://twitter.com/HarlanGreen

Monday, December 1, 2014

GDP Growth Higher, Case-Shiller Prices Steady

The Mortgage Corner

The economy in the second and third quarters posted its best back-to-back growth in 11 years, And the Conference Board’s Index of Leading Economic Indicators showed strong growth over the next six months. offering fresh evidence that the U.S. will enter the new year with good momentum.

The government last Tuesday said gross domestic product rose at a 3.9 percent annual pace in the third quarter instead of 3.5 percent. Combined with a 4.6 percent gain in the second quarter, the U.S. has posted its best six-month stretch of growth since the middle of 2003.

image

Graph: Trading Economics

The Conference Board Leading Economic Index® (LEI) for the U.S. increased 0.9 percent in October to 105.2 (2004 = 100), following a 0.7 percent increase in September, and no change in August.

“The LEI rose sharply in October, with all components gaining over the previous six months,” said Ataman Ozyildirim, Economist at The Conference Board. “Despite a negative contribution from stock prices in October, and minimal contributions from new orders for consumer goods and average workweek in manufacturing, the LEI suggests the U.S. expansion continues to be strong.”

The largest of the 10 contributors were manufacturer’s new orders, up some 10 percent, and the 10-year Treasury bond rate dropping from 2.62 percent to 2.21 percent, boosting consumer spending and housing sales.

“The upward trend in the LEI points to continued economic growth through the holiday season and into early 2015,” said Ken Goldstein, Economist at The Conference Board. “This is consistent with our outlook for relatively good, but not great, consumer demand over the near term. Going forward, there are continued concerns about slow business investment and lackluster income growth.”


image

Graph: Econoday

S&P/Case-Shiller reported almost half of major cities tracked in Tuesday’s housing data saw prices fall in September, while almost half saw them rise,. Overall, the gauge of home prices in 20 cities was basically unchanged in September, ticking down .03 percent, a sign the summer sales market has ended.

Annnual growth cooled as well, with year-over-year home prices rising 4.9 percent in September — the slowest pace since October 2012 — compared with annual growth of 5.6 percent in August.

Here’s a chart summarizing the results:

image

The leaders were Charlotte, NC, and Miami, while the year-over-year leaders in price rises were again Miami, Las Vegas and San Francisco. With the Federal Housing Finance Authority loosening some conforming mortgage qualification standards, and if conforming interest rates remain below 4 percent, we could see overall housing prices stabilize and maybe even begin to rise again in 2015.

But it all depends on the jobs market, of course, and we see robust job growth continuing into the first half of 2015, as well, before the Fed begins to raise their short term interest rates.

Harlan Green © 2014

Follow Harlan Green on Twitter: https://twitter.com/HarlanGreen

Friday, June 6, 2014

Home Sizes Ballooning Again

The Mortgage Corner

Housing sizes are ballooning, after a slight pause due to the Great Recession, reports the U.S. Census Bureau and Marketwatch. In 2013 the median floor area of new single-family homes sold in the U.S. rose 4 percent to hit almost 2,500 square feet, according to recently released data from the U.S. Census Bureau.

That compares to the median 1,800-square-foot size of a single detached home, as reported in the 2011 American Housing Survey, when 40 percent of homes were 1-2,000 square feet in size.

largehomes

Graph: WSJ Marketwatch

The biggest new single-family homes of all were sold in the South, hitting a median of 2,534 square feet in 2013, up 1 percent from the prior year. Homes in the Northeast reached 2,456 square feet, up 3 percent. Homes in the Midwest measured 2,405 square feet, up 9 percent from 2012, and homes in the West hit 2,394 square feet, up 5 percent.

And prices continue to rise. The Case-Shiller Home Price Index of same-home sales has risen 12.4 percent in a year, and buyers are paying more for these larger homes. The median sales price of new single-family homes rose to $268,900 last year, up 10 percent from 2012.

What does that say? Those with the money are moving the various markets. The fastest growing segment are homes from 3,000 to 3,999 square feet, says the Census Bureau. Last year 9 percent of new single-family homes sold in the U.S. were at least 4,000 square feet, up from 8 percent in 2012. Meanwhile, the share of homes under 1,800 square feet fell to 17 percent in 2013, down from 22 percent in 2012 and 33 percent a decade earlier.

Existing-home sales are following the same trend. April’s sales of existing homes that cost at least $1 million grew more than 5 percent from a year earlier, while sales of homes under $250,000 fell more than 5 percent, according to the National Association of Realtors.

What will bring more buyers into the housing market? Even lower mortgage rates, it seems. Purchase mortgage applications are still declining since January, even though mortgage rates have plunged on late, with the 30-year conforming fixed rate falling to 3.875 percent, and Hi-Balance conforming fixed rates at 4.00 percent for 1 origination point.

mortgages

Graph: WSJ Marketwatch

So the big question remains whether middle class families will be able to afford those middle class homes anymore? That has as much to do with households starting up, or new household formation. And with so many of the 25 to 55 year-olds out of work, it may take years for households formation to pick up to the 1.2m per year average that prevailed before the Great Recession, from the current 600,000 new annual households being formed.

workers

Graph: Zero Hedge

For instance, in the April unemployment report, one of the most important age group for jobs, those workers aged 25-54 which represent the bulk of the US labor force and are also the best and most productive group, the total number of jobs tumbled from 95,360K to 95,151K, a drop of 209K, reports Zero Hedge.

Seniors were the winners. According to the establishment survey, the only beneficiary of whatever this jobs "recovery" is, were workers aged 55-69, that have gained 174,000 jobs to date.

Harlan Green © 2014

Follow Harlan Green on Twitter: https://twitter.com/HarlanGreen

Tuesday, March 25, 2014

What’s Happened to New-Home Sales?

The Financial FAQs

Sales of new single-family houses in February 2014 were at a seasonally adjusted annual rate of 440,000, according to U.S. Census Bureau and the Department of Housing and Urban Development estimates. This is 3.3 percent below the revised January rate of 455,000 and is 1.1 percent below the February 2013 estimate of 445,000.

newhomes

Graph: Calculated Risk

What has happened to new-home sales, with annual housing starts now above 900,000 units? Both housing prices and interest rates have been rising, for starters. And the Case-Shiller Home Price index is still rising annually at 13.2 percent, 0.8 percent in January, using a 3-month average.  And it takes at least 9 months for housing construction to be reflected in completions that would influence new-home sales.

shiller

Graph: Econoday

It could also be the winter weather in two-thirds of the country, and inventories are still low, at 5.2 months’ supply. But more likely it is that home ownership is increasingly difficult for first-time homebuyers, particularly. Tough lending standards for Fannie Mae and Freddie Mac, with higher credit score requirements and fees have made borrowing less attractive.

But that may be changing in 2014, as lenders seem to be easing their credit standards, both because default rates are down and housing prices continue to rise. The average FICO score on all closed loans was 724 in February 2014 compared to 745 in February 2013, or a 21-point decrease, according to a report released by Ellie Mae, a mortgage technology firm. (Under a system devised by Fair Isaac Corp., FICO credit scores run on a scale from 300 to 850.) Last month, 33 percent of closed loans had an average FICO score under 700 compared to 24 percent in February 2013.

“The share of purchase loans jumped four percentage points, representing 57 percent of all closed loans in February 2014,” said Jonathan Corr, president and chief operating officer of Ellie Mae. “This is the first time in four months that the share of purchase loans increased month over month and the largest one-month increase since August 2013, when the share of purchase loans also jumped four percentage points.”

“Credit requirements remained steady month over month, but there has been significant loosening compared to where we were a year ago,” said Corr.

So it may be too early to see a purchase trend in 2014 for new and existing-home sales. Total existing-home sales, which are completed transactions that include single-family homes, townhomes, condominiums and co-ops, declined 0.4 percent to a seasonally adjusted annual rate of 4.60 million in February from 4.62 million in January, and 7.1 percent below the 4.95 million-unit level in February 2013.

Interest rates fluctuations and conforming loan underwriting standards may be the deciding factors, which in turn affect consumer confidence. How much pentup demand is there with new households is another factor. So we will probably have to wait to see how the new selling season fares, taking into account all these factors.

Harlan Green © 2014

Follow Harlan Green on Twitter: https://twitter.com/HarlanGreen

Friday, January 31, 2014

Pending Home Sales Show Weakness

The Mortgage Corner

Where is a housing bubble? Some pundits have been saying that housing prices, up some 13 percent in a year, may have been rising too fast. This is mainly because too few homes on the market, and also the pent up demand from 5 years of recession. But the pundits could be wrong about a price bubble. A slowdown in sales is now showing up in the NAR’s Pending Home Sales’ Index that has been declining steadily over the past few months—since last June, basically—and that should slow down the price rises.

pendsales

Graph: NAR

The Pending Home Sales Index, a forward-looking indicator based on contract signings, fell 8.7 percent to 92.4 in December from a downwardly revised 101.2 in November, and is 8.8 percent below December 2012 when it was 101.3. The data reflect contracts but not closings, and are at the lowest level since October 2011, when the index was 92.2.

Lawrence Yun, NAR chief economist, said several factors are working against buyers. “Unusually disruptive weather across large stretches of the country in December forced people indoors and prevented some buyers from looking at homes or making offers,” he said. “Home prices rising faster than income is also giving pause to some potential buyers, while at the same time a lack of inventory means insufficient choice. Although it could take several months for us to get a clearer read on market momentum, job growth and pent-up demand are positive factors.”

The disruptive weather wasn’t reflected in personal consumption, up 3.3 percent in the initial 4th Quarter GDP estimated growth of 3.2 percent. So there has to be more at work.

Bill McBride of Calculated Risk listed more possible causes for the decline: “My view is there were several reasons for the decline in this index: weather in some areas, fewer distressed sales, less investor buying, fewer "pending" short sales, and low inventories.  I think fewer distressed sales, fewer "pending" short sales, and less investor buying are all signs of a healthier market - even if overall sales decline.”
The 3.2 percent Q4 GDP growth was also heartening for 2014 growth prospects. In particular, the share due to real estate investment is growing again after plunging sharply before and during the Great Recession. Residential investment (RI) includes new single family structures, multifamily structures, home improvement, broker's commissions, and a few minor categories.

The graph shows that 4-5 percent is the normal range vs. the current 3 percent, and that would mean real estate investment has more room to grow to return to normal levels.

RIinvest

Graph: Calcuated Risk

The Great Housing Bubble busted during the Great Recession is probably a once-in-a-lifetime event. Although the late 1980’s Savings & Loan crisis caused prices to fall, overall housing prices recovered quickly because there were no recessions at the time. The so-called Gulf War recession of 1991-92 occurred as housing prices were already recovering.

In fact, 1991 was really the beginning of the Great Housing Bubble that ultimately burst in 2007-08. So we know that housing prices rise and fall with business activity, as well as inflation rates. And we are still at the beginning of this recovery cycle with very low inflation. These are the signs of a “healthier” housing market as distressed sales decline, and we return to a more normal housing mix.

Harlan Green © 2014

Follow Harlan Green on Twitter: https://twitter.com/HarlanGreen

Wednesday, January 22, 2014

Higher Economic Growth In 2014

Financial FAQs

We should be seeing a huge jump in economic growth this year. Why? Most economists are saying businesses are more optimistic with the federal budget agreement for 2 years, and no more tax increases hanging over consumers (and businesses). Republicans even finally agreed to spend $1.1 trillion this fiscal year—that is, until September when another fiscal year begins.

I maintain the increase in government spending, healthier state tax coffers, and a reviving housing sector with housing prices up 13.6 percent annually according the S&P Case-Shiller Home Price Index, will be the main reasons for faster growth and more job creation this year.

We know this because the Census Bureau’s JOLTS report now shows 4 million job openings, and a rising ‘quit’ rate, which means job seekers are feeling optimistic enough about their prospects to voluntarily leave their current job.

clip_image002

Graph: Wrightson-ICAP

“After having risen by an average of 0.5 percent per month from the beginning of 2011 to the middle of 2013,” says Wrightson-ICAP, “the number of voluntary quits since July has climbed by 2.0% per month. The quit rate is important on two levels: it is both a general measure of worker confidence that tells us something about developments in the labor market, and it is a direct contributor to worker mobility, which is a key driver of productivity growth. (Matching workers to better jobs contributes to overall economic efficiency.)”

The best sign of an improvement in business optimism is the boost in capital expenditures. That expectation is based on a variety of factors, including the recent strength in the ISM factory orders index, a pick-up in capital spending plans by small businesses, and strong balance sheets and ample financing for larger companies. The capacity utilization data in Friday’s industrial production report reinforced that expectation. Total capacity utilization climbed to 79.2%, which is only one percentage point below the long-run (1972-2012) average that the Fed publishes as a reference point.

Wrightson-ICAP agrees with me on this, also. “As the aggregate level of capacity utilization rises, says Wrightson, many individual sectors are approaching or surpassing their previous cyclical highs. In the December data published last week, industries accounting for 33 percent of the Fed’s industrial production index had operating rates that were equal to or greater than their peaks in the previous cycle.

clip_image004

Graph: Wrightson-ICAP

There are other factors, as well, such as the pickup in consumer spending with higher December retail sales, and consumer confidence. This could lead to a GDP growth rate in the mid-3 percent range for 2014, up from the average 2 percent growth rate of late. It is a huge jump and just reflects the pent up demand for everything, as household balance sheets are turning positive and businesses begin to spend the cash they have been hoarding.

So the Federal Reserve will probably continue with its tapering of QE3 purchases that will cause long term interest rates to continue to rise. But it’s still the beginning of this business cycle, believe it or not. And there is almost no inflation, which will keep interest rates from rising too fast.

Harlan Green © 2014

Follow Harlan Green on Twitter: https://twitter.com/HarlanGreen

Wednesday, December 4, 2013

New-Home Sales Soaring

The Mortgage Corner

There aren’t enough new homes being built, apparently, as new U.S. homes sold at an annual rate of 444,000 in October, up 25.4 percent from 354,000 in September, the U.S. Census Bureau said Wednesday. And the inventory of new homes for sale plunged to a post-recession low of 4.9 months, which puts for-sale inventories back into 1960 levels.

image

Graph: Econoday

Lower interest rates are also holding, as more Federal Reserve Governors are saying that QE3 tapering of securities’ purchases shouldn’t begin until the unemployment rate actually drops below 6.5 percent, from its current 7.1 percent. And economists don’t see that happening for at least another year.

The collection of sales data for both months was delayed by the federal shutdown, prompting the government to release the information on the same day. Demand in October was strong across the country, with double-digit percent gains in all four major regions. Part of what drove sales was a decline in prices and more demand for lower-prices homes, a trend that typically emerges in the colder months.

The median price of new homes fell 5.3 percent to $245,800 in October. That's the lowest level since November 2012. The supply of new homes on the U.S. market, meanwhile, sank to 4.9 months in October at the current sales pace from 6.4 months in September. This is while new home sales are 21.6 percent higher compared to one year ago.

We mustn’t forget that the Federal Housing Finance Authority (FHFA) is also delaying any drop in conforming loan limits below $417,000 through 2014, which has to be heartening home buyers. As such a lower restriction on loan amounts would affect entry-level, lower-priced homes in particular.

Inventory levels are in fact back to levels last seen in 1997 to 2005 in this Calculated Risk graph that dates back to 1963. This is spurred the housing construction boom that boosted the housing bubble. But with all the restriction on mortgage lenders initiated by both the Federal Reserve and Dodd-Frank, Consumer Protection Finance Bureau, we don’t see the likelihood of another housing bubble. The homeownership rate has dropped to 64 percent from its high of 68 percent during the bubble. And with household incomes and debt loads that haven’t recovered from the Great Recession, there is little chance a bubble would re-occur anytime soon, if ever.

image

Graph: Calculated Risk

In spite of this news, existing-home prices were building steam through September based on S&P Case Shiller, indicating overall demand is still strong. The 20-city index rose an adjusted 1.0 percent in September vs monthly gains of 0.9 percent and 0.6 percent in the prior two months. Very respectable gains swept all 20 cities for the second month in a row, led this time by Atlanta at plus 1.9 percent followed by a string of cities out West where S&P says there's talk now of a housing bubble.

But we know S&P tends to be overly conservative in their projections. Most of the price gains were either in Las Vegas, or the California coastal cities of San Francisco, Los Angeles and San Diego, beneficiaries of the fast-growing Silicon Valley economy. So most of the growth in sale prices can be attributed to real economic growth, rather than the financial speculation that occurred on Wall Street leading to the Great Recession.

Harlan Green © 2013

Follow Harlan Green on Twitter: www.twitter.com/HarlanGreen

Tuesday, November 26, 2013

What Should We Be Thankful For?

Financial FAQs

There is still much we can be thankful for this Thanksgiving, in spite of tax raises and government spending cuts that affect mostly the poorest—whether it’s less food stamps, early child care, environmental protection, and maybe even fewer funds to fully implement the Affordable Care Act.

We finally have almost-universal health care, 92.7 percent of our workforce is employed, and we are better off than the Europeans. Europe is still in recession after 4 years of austerity policies that have resulted in sky-high unemployment rates, rather than benefiting from the quantitative easing policies that our Federal Reserve has initiated since September 2012 that has kept even long term interest rates at record lows.

So we can be thankful that Ben Bernanke is the current Fed Chairman. And in January pro-labor economist Janet Yellen will be the new Federal Reserve Chairman. I believe we can therefore look forward to continued low interest rates leading to greater job creation for some years to come.

We mustn’t listen to those Austerians that keep crying stocks and even real estate might be re-inflating asset bubbles, as happened with the recent housing bubble. Household income isn’t growing enough, and consumer debt is still too high to re-ignite any bubbles, though it is returning to more sustainable levels.

 image

Graph: Calculated Risk

Consumer debts have declined to the lowest level in 30 years, according to the Federal Reserve’s just released Q2 2013 Household Debt Service and Financial Obligations Ratios report. This will boost consumer spending, and housing values. The enclosed graph dating back to 1980 shows that the overall Household Debt Service ratio (red line) is actually lower than it was in 1980, while the Homeowner Mortgage (blue line) and Consumer (yellow line) ratios are back to 1980 levels.

We can also be thankful that the housing market is in recovery, with prices up some 13.3 percent just this year, according the Case-Shiller Index, reducing mortgage default and foreclosure rates. That is largely because of the Fed’s low interest rates that are helping consumers to pay down their debts.

A good report that few see is the Bureau of Labor Statistics’ JOLTS report of job openings, layoffs and transfers. Job openings are basically back to 2005 levels. But because many more millions have joined the labor force since then, it hasn’t yet brought us closer to full employment.

image

Graph: Econoday

There were 3.913 million job openings in September, up from 3.844 million in August. The number of job openings decreased in arts, entertainment, and recreation and was little changed in all remaining industries and in all four regions. But it reflects the 204,000 payroll jobs created in October, which shows job creation increasing faster than previously.

The number of hires in September was 4.585 million, essentially unchanged from 4.559 million in August. The number of hires was little changed for total private and government, as well as for all industries and all four regions. There were 4.426 million total separations in September, little changed from 4.405 million in August.

So there is more to be done to boost economic growth. But I see the cup as half full, and the economic odds are it will continue to fill.

Harlan Green © 2013

Follow Harlan Green on Twitter: www.twitter.com/HarlanGreen

Friday, October 25, 2013

Conforming Mortgage Limit Reductions Postponed

The Mortgage Corner

Federal officials will delay any reduction in the maximum size of home-mortgage loans eligible for backing by Fannie Mae and Freddie Mac until next spring at the earliest, said FHFA Administrator Ed DeMarco in a Wall Street Journal article--DeMarco: No Mortgage Limit Declines Before Spring 2014. It is reputably from heavy resistance from the real-estate industry and many lawmakers in Congress.

This is in the face of the recent government shutdown and debt ceiling debate that has slowed economic growth this year, and even next year, if a budget agreement isn’t reached by January 2014.

Couple this with a recent slowdown in real estate sales, including for new homes.  There appears to be little doubt that rising mortgage rates, combined with higher home prices, resulted in a material slowdown in net new-home orders last quarter, says Calculated Risk. Mortgage rates, of course, have fallen considerably since early September, though they remain well above levels since during the first five months of the year.

Currently, Fannie and Freddie can guarantee mortgages that have balances as high as $417,000 in most of the country and up to $625,500 in expensive housing markets, including parts of California and New York. Loans within the limits are called “conforming” or “High-Balance conforming loans.

Potential loan-limit changes will be announced six months ahead of their implementation date, said Demarco, and such changes wouldn’t be announced until November at the earliest. “Anything we do would have a long lead time and would be gradual and measured,” said Mr. DeMarco.

When the agency does move ahead with loan limit declines, the declines will apply to both the national limit and the high-cost limits, which were enacted on an emergency and temporary basis by Congress in 2008.

It will be politically difficult to lower these limits, and the limits probably wouldn't be adjusted down very much.  The conforming loan limit was $252,700 in 2000. Using the FHFA Purchase Only index, the national conforming loan limit might be lowered to around $360,000.

Using the CoreLogic or Case-Shiller Comp 20 indexes, the conforming loan limit might be lowered to $380,000 to $395,000. Not a large downward adjustment for the national limit.

Harlan Green © 2013

Follow Harlan Green on Twitter: www.twitter.com/HarlanGreen

Thursday, September 26, 2013

Case-Shiller Home Prices Take Off

The Mortgage Corner

The July S&P Case-Shiller home price index shows home prices are in full recovery mode. Over the last 12 months, prices rose 12.3 percent and 12.4 percent as measured by the 10- and 20-City Composites in the major cities and metro areas, which are a 3-month average of same-home increases. And because the Fed still in full credit easing mode with its September decision to maintain QE3 securities’ purchases at $85 billion per month, interest rates are beginning to decline

clip_image002

Graph: Calculated Risk

Data through July 2013, released today by S&P Dow Jones Indices for its S&P/Case-Shiller Home Price Indices showed increases of 1.9 percent and 1.8 percent from June for the 10- and 20-City Composites. For at least four months in a row, all 20 cities showed monthly gains. Phoenix posted 22 consecutive months of positive returns. Although home prices in all the cities increased, 15 cities and both Composites those increases slowed in July versus June.

“Home prices gains are holding their 12 percent annual rate of gain established by the two Composite indices in April,” says Chairman David M. Blitzer, of the S&P Dow Jones Indices. “The Southwest continues to lead the housing recovery. Las Vegas home prices are up 27.5 percent year-over-year; in California, San Francisco, Los Angeles and San Diego are up 24.8, 20.8 and 20.4 percent, respectively. However, all remain far below their peak levels.”

The result of lower mortgage rates is mortgage applications are also increasing, after falling sharply in May when the Fed first hinted it would begin to tighten credit in the fall. Mortgage applications increased 5.5 percent from one week earlier, according to data from the Mortgage Bankers Association’s (MBA) Weekly Mortgage Applications Survey for the week ending September 20, 2013.

The Refinance Index increased 5 percent from the previous week. The seasonally adjusted Purchase Index increased 7 percent from one week earlier. The Purchase Index was at its highest level since July 2013.

clip_image004

Graph: Calculated Risk

The HARP share of refinance applications increased to 41 percent from 40 percent the week before, and is the highest since MBA started tracking this measure in early 2012. So there is the feeling that many home owners with negative home equity are only now taking advantage of refinancing their underwater mortgages at current interest rates. The HARP program allows mortgage holders to refinance when debt can be as much as 150 percent of their home’s value.
So the Federal Housing Finance Authority has stepped up its campaign to encourage more homebuyers to apply for HARP refinancing. Acting FHFA Director Edward J. DeMarco said that 2.8 million homeowners have refinanced through HARP but with mortgage rates still historically low and HARP eligibility requirements expanded, other qualified homeowners could reduce their monthly mortgage payments or build their equity faster with a shorter term mortgage through the program.

DeMarco told Bloomberg News in an interview this weekend that FHFA used focus groups to find out why borrowers with high rates hadn't yet tried to refinance through HARP. They found many didn't realize they were eligible. They thought they had to be delinquent on their mortgages before the government would help them. DeMarco said he hoped the educational outreach would bring in an additional 2 million HARP borrowers.

This is while total existing-home sales, which are completed transactions that include single-family homes, townhomes, condominiums and co-ops, rose to a seasonally adjusted annual rate of 5.48 million in August from 5.39 million in July, and are 13.2 percent higher than the 4.84 million-unit level in August 2012, reported the National Association of Realtors.

Harlan Green © 2013

Follow Harlan Green on Twitter: www.twitter.com/HarlanGreen

Tuesday, September 10, 2013

More Home Equity, Fewer Defaults In Q2

The Mortgage Corner

CoreLogic, a Southern California real estate data firm, also released new analysis showing approximately 2.5 million more residential properties returned to a state of positive equity during the second quarter of 2013, and the total number of mortgaged residential properties with equity currently stands at 41.5 million. The analysis shows that 7.1 million homes, or 14.5 percent of all residential properties with a mortgage, were still in negative equity at the end of the second quarter of 2013. This figure is down from 9.6 million homes, or 19.7 percent of all residential properties with a mortgage, at the end of the first quarter of 2013.

image

Graph: Calculated Risk

Nevada was the highest percentage of mortgaged properties in negative equity at 36.4 percent, followed by Florida (31.5 percent), Arizona (24.7 percent), Michigan (22.5 percent), and Georgia (20.7 percent), per Calculated Risk’s graph. Montana had the lowest percentage of mortgaged properties. The top five states combined account for 34.9 percent of negative equity in the U.S.

“Equity rebuilding continued in the second quarter of this year as the share of underwater mortgaged homes fell to 14.5 percent,” said Dr. Mark Fleming, chief economist for CoreLogic. “In just the first half of 2013 almost three and a half million homeowners have returned to positive equity, but the pace of improvement will likely slow as price appreciation moderates in the second half.”

Meanwhile existing-home for sale inventories climbed to 20.6 percent, according to Housing Tracker. The Calculated Risk graph show that 2013 inventories are almost back to 2010 levels, as housing prices continue to improve. The actual inventory level is still 4 percent below 2012, says Calculated Risk, but it’s still rising vs. last year.

image

Graph: Calculated Risk

The reality is that with existing-home prices up some 12 percent year over year per Case Shiller, more homes are expected to come onto the market and continue the housing recovery. Western cities like San Francisco and Las Vegas prices are up some 24 percent in a year.

The one caveat that could limit further price increases is that the Federal Housing Finance Authority, ruler of Fannie Mae and Freddie Mac, just announced they would be lowering the conforming loan limits.

“FHFA has been analyzing approaches for reducing Fannie Mae and Freddie Mac loan limits across the country, and any such change would be announced with adequate advance notice for implementation on Jan. 1," the agency said in a statement Monday. It could be as soon as next month, according to the LA Times.

Most pundits are conjecturing that just the conforming limit would be lowered, and the so-called Hi-Balance conforming limits would remain unchanged at $625,500 for the higher-priced California counties. The upper limit for Fannie and Freddie loans in high-priced areas was increased in 2008 to $729,750 to support the collapsing housing market. That limit was reduced to $625,500 in October 2011, although the $729,750 cap is still in place for loans insured by the Federal Housing Administration.

Harlan Green © 2013

Follow Harlan Green on Twitter: www.twitter.com/HarlanGreen