Showing posts with label construction spending. Show all posts

Saturday, December 2, 2023

What Happens Next?

 Popular Economics Weekly

What does the future foretell? Everyone wants to know what will happen next year now that the Fed is on hold and inflation continues to decline.

I believe the construction industry is telling us the economy will continue to expand next year, despite the Fed’s intransigence on dropping interest rates. Plunging bond yields are signaling inflation will continue to decline, so why wouldn’t the Fed follow?

Construction spending rose in October for the 10th month in a row, largely because of work on commercial buildings and government-funded public projects.

FREDconstruction

Spending on construction increased 0.6 percent in October to just over a $2 billion annual rate, up 11 percent annually, the Commerce Department reported Friday, and per the FRED graph on construction spending.

Much of it comes from the ‘new’ New Deal bipartisan Bidenomics bills that are modernizing the American economy as well as fighting climate change.

And inflation as measured by the Fed’s preferred PCE price index, or personal consumption expenditures price index, was unchanged in November. It was held down in part by a decline in oil prices. The increase in inflation over the past year decelerated to 3.0 percent from 3.4 percent in the prior month and 6.4 percent one year ago. That’s the lowest level since February 2021.

And construction spending could even accelerate as interest rates drop further. Bonds in particular have rallied, as the 10-year Treasury note yield declined more than 0.5 percent in November igniting a huge bond rally after briefly touching 5 percent.

What is being constructed? Everything from roads (public) to commercial properties (private). Private construction spending was almost $1.5 billion of the total.

In October, the estimated seasonally adjusted annual rate of public construction spending was $447.8 billion, 0.2 percent (±2.0 percent) above the revised September estimate of $446.9 billion. Public construction is building for the future that only governments can do.

Educational construction was at a seasonally adjusted annual rate of $97.2 billion, 0.4 percent (±2.3 percent) above the revised September estimate of $96.7 billion.

Highway construction was at a seasonally adjusted annual rate of $132.0 billion, 0.3 percent (±4.8 percent) below the revised September estimate of $132.4 billion.

Since Biden took office, employers have created 14 million jobs, and the unemployment rate has been hovering around a 50-year-low for months, said the NYTimes Ross Serkin.

The president has also been talking up signature economic accomplishments like the Infrastructure Investment and Jobs Act, which he argues have helped rebuild rural America and invigorated the economy.

“Bidenomics is just another way of saying the American dream,” he said in a speech. It’s not a stretch. The economy grew last quarter at 5.2 percent, belying a global slowdown.

President Biden will convene the first meeting of his supply-chain resilience council, using the event to announce 30 actions to improve access to medicine and needed economic data and other programs tied to the production and shipment of goods.

“We’re determined to keep working to bring down prices for American consumers and ensure the resilience of our supply chains for the future,” said Lael Brainard, director of the White House National Economic Council and a co-chair of the new supply chain council.

Working to increase the supply of everything is the best way to bring down prices, and inflation.

Harlan Green © 2023

Follow Harlan Green on Twitter: https://twitter.com/HarlanGreen

Wednesday, July 26, 2023

What Is Bidenomics?

 The Mortgage Corner

The best way to describe ‘Bidenomics’ now being touted by a growing consensus of economists is best explained in the recent resurgence of construction spending, as portrayed in the FRED graph.

FREDconstructionspend

Nobel Laureate Paul Krugman, among others, has been touting the strength of the post-pandemic economic recovery, which is being called ‘Bidenomics’ in a play on words to compare it to Reaganomics, the 1980s recovery from the 1970’s era of stagflation and double-digit inflation.

“The economy’s resilience in the face of rate hikes suggests that overall demand has been stronger than anyone expected — possibly in part because Biden administration policies appear to have unleashed a huge wave of manufacturing investment,” said Krugman in a NYTimes Op-ed.

The big difference between the two eras is government’s role. President Reagan decreed that government was the problem, so it financed its recovery with tax cuts that inflated the first substantial federal debt since World War Two.

Bidenomics is being financed with tax receipts, private investment, and some increased taxes, but without tax cuts. So, it must pay for itself, and government-funded programs are providing the incentives.

President Joe Biden’s Infrastructure Investment and Jobs Act has become a part of the domestic economy, “driving a boom in large-scale infrastructure,” wrote Ellen Zentner, chief U.S. economist for Morgan Stanley, in a research note out last week cited by MarketWatch.

As a result, Morgan Stanley now projects 1.9 percent economic expansion in the first half of this year. That’s nearly four times the bank’s previous 0.5 percent forecast for growth in gross domestic product in the first half of 2023.

Some $1 trillion in infrastructure spending signed into law in 2021 marked an early legislative win for a president handed only a slim majority in Congress upon his election over then-incumbent Republican Donald Trump in November 2020.

It was followed up by another legislative banner for Biden: the Inflation Reduction Act, a climate-change- and healthcare-focused spending bill signed into law about a year ago. Many of the incentives in the laws are tied to domestic manufacturing and a reason manufacturing activity is beginning to expand again after a period of contraction, per the S&P U.S. manufacturing-sector index that rose to 49 from 46.3 in July, but has been negative for months.

Tomorrow the first estimate of second quarter GDP growth will be released by the US Bureau of Economic Research (BEA). The Atlanta Fed’s latest GDPNow estimate of second quarter GDP growth by Blue Chip economists is 2.4 percent.

Construction spending in manufacturing is soaring, up 76 percent YoY and helping to boost employment, traditionally with higher-paying jobs. So Bidenomics is a win-win solution for both continued economic growth and keeping workers fully employed.

Harlan Green © 2023

Follow Harlan Green on Twitter: https://twitter.com/HarlanGreen

Thursday, May 18, 2023

Existing-Home Sales in Sharp Decline

 The Mortgage Corner

I said last week that higher new home sales and rising homebuilders’ optimism foretell a strong summer sales season if builders and existing-home inventories don’t run out of housing stock.

The problem is not enough existing homes are for sale, hence the below-normal inventory of total homes for sale, which has spurred new-home construction. We know there is a tremendous housing shortage.

Total existing-home sales – completed transactions that include single-family homes, townhomes, condominiums, and co-ops – slid 3.4% from March to a seasonally adjusted annual rate of 4.28 million in April. Year-over-year, sales slumped 23.2% (down from 5.57 million in April 2022).

Calculated Risk

That’s a decline of more than one million existing homes sales in just one year.

Calculated Risk’s Bill McBride reported last week that private residential construction spending was down 10.0 percent annually. Non-residential spending is up 21.3 percent year-over-year (i.e., apartments) and public construction spending is up 15.0 percent year-over-year, which is keeping the real estate industry barely alive.

The Calculated Risk graph tell us why. As interest rates rose home sales declined. The sharp rise in interest mirrors the sharp decline in sales over the same time period—beginning January 2022 when everyone knew the Fed was in earnest about suppressing inflation.

There are 1.675 million units under construction, reports McBride, just 35 thousand below the all-time record of 1.710 million set in October 2022.

Of these, there are currently 977 thousand multi-family units under construction.  This is the highest level since September 1973, and close to the record of 994 thousand in 1973 (being built for the baby-boom generation).

For multi-family, construction delays are a significant factor because of supply shortages, such as of electrical equipment. The completion of these units should help to lower rents, which puts downward pressure on inflation. Rents comprise a large part of the retail inflation numbers.

"Home sales are bouncing back and forth but remain above recent cyclical lows," said NAR Chief Economist Lawrence Yun. "The combination of job gains, limited inventory and fluctuating mortgage rates over the last several months have created an environment of push-pull housing demand."

Total housing inventory2 registered at the end of April was 1.04 million units, up 7.2 percent from March and 1.0 percent from one year ago (1.03 million), says the NAR. Unsold inventory sits at a 2.9-month supply at the current sales pace, up from 2.6 months in March and 2.2 months in April 2022, still much too low to satisfy the surging demand for more housing.

Econbrowser

The Econbrowser blog puts out an interesting graph that shows what is keeping economic growth from collapsing into recession territory. It’s the rising NFP (nonfarm payroll) number coupled with a surge in industrial production (pink line). Other sectors that the National Bureau of Economic Research (NBER) business cycle dating committee scrutinizes to call a recession—personal income, consumption, and Mfg. & trade sales—have stalled.

This gives a better picture of how much damage to economic growth and housing industry has been caused by the Fed’s battle with inflation; and what signs to look for in coming months of further declines that might trigger a recession call.

Harlan Green © 2023

Follow Harlan Green on Twitter: https://twitter.com/HarlanGreen

Thursday, May 4, 2023

More Housing Sorely Needed

 The Mortgage Corner

I said last week that higher new home sales and rising homebuilders’ optimism foretells a strong summer sales season if builders and existing-home inventories don’t run out of housing stock.

The construction industry is responding. Spending in March 2023 rose 0.3 percent above the revised February estimate of $1,829.6 billion, according to the Census Bureau. The March figure is 3.8 percent above the March 2022 estimate of $1,768.2 billion.

This is even with the Fed’s latest 0.25 percent hike that means higher construction costs.

Why? We know there is a tremendous housing shortage. There are 63,000 homeless in Los Angeles alone, more than 150,000 nationally, and rental rates aren’t coming down because of low vacancy rates. People have to live somewhere: for too many it’s on the streets.

Calculated Risk

Calculated Risk’s Bill McBride reports private residential construction spending is down 10.0 percent. Non-residential spending is up 21.3 percent year-over-year. Public spending is up 15.0 percent year-over-year.

That is because of the $ trillions being fed into the economy with the Infrastructure and Inflation Reduction Acts. It’s what governments—both state and federal—are supposed to do doing recessions and other uncertain times (such as wars, pandemics, global warming, etc.).

So, it’s a very good sign for our economic future and the reason I believe what some economists are calling a ‘rolling recession’ will be short-lived.

But that’s not helping the homeless. States like California are addressing the problem, but a national survey reports that NIMBY zoning laws and local governments’ recalcitrance to rezone for denser housing is the main reason residential construction isn’t meeting this demand.

Surveys have shown time and again the reluctance of communities to build more affordable housing, since residents believe it harms their own housing values. The answer must be the better design of neighborhoods that improve accessibility to jobs as well as affordable housing.

A recent Stanford University study of California’s homeless problem highlighted its complexity. Twenty-five percent of the homeless have either drug addiction or mental health problems that could be mitigated with better treatment centers.

Single-family zoning and local opposition to housing, often embodied by the “not in my backyard,” or NIMBY, sentiment makes neighborhoods more expensive. Each additional growth control policy a community added was associated with a 3-5 percent increase in home prices (Taylor 2015; Rothell 2019), said the study. 

The construction industry is also playing catch-up, as new construction almost ceased during and after the Great Recession. The aftermath of the busted housing bubble produced an excess of one million homes, which large corporations and hedge funds snapped up at rock bottom prices, which took many homes off the housing market.

The Biden administration has chipped in more than $250 million to subsidize more affordable housing, but $ billions more will be needed to encourage more such developments.

The Great Recession caused almost as much economic damage as the Great Depression. Great Depression programs in the 1930s subsidized homeownership during record unemployment of that time.

More government support will be needed to support such efforts once again.

Harlan Green © 2023

Follow Harlan Green on Twitter: https://twitter.com/HarlanGreen

Monday, October 4, 2021

U.S. Manufacturing Surging

 Financial FAQs


FREDmanuoutput

Growth in the U.S. manufacturing sector is exploding, according to the Institute for Supply Managers Report on Business. Output is up 17 percent in Q2 2021 YoY (per FRED graph). It is a  sign of good economic growth for the rest of this year, in spite of supply shortages and higher prices for raw materials.

Reporting growth in September were 16 of the 17 manufacturing industries. The top seven — in the following order — were: Furniture & Related Products; Petroleum & Coal Products; Machinery; Electrical Equipment, Appliances & Components; Computer & Electronic Products; and Chemical Products.

“The orders index was unchanged at the prior month’s very high level of 66.7 and the supplier delivery index rebounded by four points to 73.4.  The overall result was a 1.2-point increase to 61.1.  Any number over 50 percent indicates that a majority of those surveyed saw increases, and reaching 60 for any length of time is highly unusual,” according to the ISM survey announcement.

“There have been 15 ISM composite index readings of 60 or more in the past thirty years.  Seven of them have come in the past ten months,” said Reuters. This is in spite of the supply-chain delays and soaring product prices. The ISM Prices Index registered 81.2 percent. In September, 17 of 18 industries reported paying increased prices for raw materials.

Reuters

Even better news is that consumer spending is holding up, which powers some two-thirds of economic activity. This may be because consumers are paying less attention to the pandemic as the infection rate falls and the third Pfizer booster shot becomes available.

This is while Consumer spending grew at a robust 12.0 percent rate in the April-June quarter. The Commerce Department also said construction spending increased 8.9 percent on a year-on-year basis in August. Separately, the University of Michigan's Consumer Sentiment Index rose to a final reading of 72.8 in September from 70.3 in August.

Another sign of robust future growth (as shown in the Reuters graph) is that Disposable income was $2 trillion higher than Personal outlays--$18 billion vs. $16 billion, respectively—which is why the personal savings rate is holding at a high 9.4 percent.

And the NY Times just reported drug maker Merck announced Friday that its pill to treat Covid-19 was shown in a key clinical trial to halve the risk of hospitalization or death when given to high-risk people early in their infections. It probably won’t be available until late next year, however.

The supply-chain delays and healthy consumer pocketbooks show there is a very strong demand for goods and services that should last, even with the ongoing uncertainty over the coronavirus pandemic.

Now let us see what congress will do with the Biden administration proposals for infrastructure and social investments, no matter the final Dollar amount. If passed, I see a very prosperous decade for Americans.

Harlan Green © 2021

Follow Harlan Green on Twitter: https://twitter.com/HarlanGreen

Tuesday, April 27, 2021

A Better Use of Economic Growth

 Popular Economics Weekly

AtlantaFed

The Atlanta Federal Reserve Bank puts out a GDP now forecast of upcoming monthly GDP growth, and its latest estimate puts growth at the highest level since the 1980s, as we recover from the COVID-19 pandemic.

“The GDPNow model estimate for real GDP growth (seasonally adjusted annual rate) in the first quarter of 2021 is 8.3 percent on April 16, unchanged from April 15 after rounding,” said the Atlanta Fed. “After this morning's housing starts report (last week) from the U.S. Census Bureau, the nowcast of first-quarter real residential investment growth decreased from 10.6 percent to 10.2 percent."

However, new-home sales’ figures Friday showed even faster residential investment growth ahead, reports the US Census Bureau

Sales of new single-family houses in March 2021 were at a seasonally adjusted annual rate of 1,021,000, according to estimates released jointly today by the U.S. Census Bureau and the Department of Housing and Urban Development. This is 20.7 percent (±23.7 percent) above the revised February rate of 846,000 and is 66.8 percent (±36.7 percent) above the March 2020 estimate of 612,000.

The problem is not finding more ways to boost GDP growth, per se, but how it will be utilized. Since the 1980s, a growing percentage of the Gross National Income derived from GDP growth has gone to ‘rentiers’, i.e., people that receive  income from their assets rather than wages.

That is in part due to the huge decline in personal and corporate taxation of said wealth that has allowed rentiers to accumulate more private wealth, rather than investing in productive enterprises.

What creates GDP? The aggregate, or effective demand of all goods and services produced domestically. Economists have broken it into four components, of which consumer spending is the largest portion. The rest is made up of net exports, government expenditures, and investments.

Consumers spend on private consumer goods, so it is up to investment and government spending to build for future growth. That has not happened because corporations haven’t been maintaining a decent level of capital expenditures and government investments in infrastructure, education, R&D, and our social safety net that would keep workers healthy enough to be more productive has been cut sharply since the 1970s.

GDP growth has been paying too little for future generations since then, in other words, so taxing some of the wealth accumulated since 1980 is needed to pay it forward.

President Biden’s $2.3 trillion American Jobs Plan is meant to correct the underinvestment in the public good. He is calling for more than $1 trillion to be invested just in the various components of infrastructure, including better roads, bridges, public transportation, expanding broadband and electric grids, as well as electric vehicle use.

He is also calling for more spending on health care and the national housing shortage—some $213 billion to “build, preserve and retrofit more than 2 million homes and commercial buildings to address the affordable housing crisis,” $100 billion to modernize public schools and early learning facilities, and $180 billion in research and development of future technologies, and more.

This supports much more than infrastructure, as it fulfills every person’s basic need of food, shelter, and security.

The initial first quarter GDP estimate comes out Thursday, and consensus predictions are for 7 percent growth. Whatever it will be, it is important that it be used in productive ways, and the just-passed American Recovery Act and upcoming American Jobs Plan begin that process of utilizing America’s economic growth to support a better future for all Americans.

Harlan Green © 2021

Follow Harlan Green on Twitter: https://twitter.com/HarlanGreen

Friday, October 30, 2020

Q3 Real GDP Jumps +33.1 Percent

 Popular Economics Weekly

Calculated Risk

We are not really out of the COVID recession, per Calculated Risk graph, even though the US Bureau of Economic Analysis (BEA) “advance” estimate of third quarter GDP growth increased +33.1 percent from Q2. But it’s still 3.5 percent below last year’s fourth quarter growth rate.

The blue bars portray past recessions, so the graph also tells us how severely this pandemic has affected economic growth. Real GDP had declined -31.4 percent in Q2.

The main driver of the rebound was consumption spending, which rose at a 40.7 percent growth rate.  Consumers bought new cars and trucks in September, purchased new clothes for the start of the school year and cooler fall weather, and spent more on recreation such as gym memberships and park fees. They also visited their doctors and dentists more often.

The biggest surprises were weakness in government spending and a very large rebound in inventories, as businesses stocked up for the holidays. 

“We had thought federal spending would grow enough to keep overall public spending positive,” says Reuters, “but reported spending was down at both the federal and state levels, subtracting 0.7 percentage points from growth.” 

This is precisely why congress’s inaction on passing another pandemic relief package is so maddening. It’s now declining state and local spending that is suppressing growth and additional job creation.

Positive economic growth for the rest of this year is also in doubt, as initial unemployment claims haven’t fallen fast enough to stay ahead of COVID-19, since more consumers are staying home because COVID-19 infection rates are already rising with the fall season and we haven’t even reached the holidays, when families and friends tend to gather.

Altogether, the number of people receiving benefits from eight separate state and federal programs fell by 415,727 to an unadjusted 22.7 million as of Oct. 10, the latest data available, which means 22 million of the formerly employed haven’t yet found another job.

Economists are concerned that rising coronavirus cases will lead people to stay home and cause service industries to begin another round of layoffs. Adding to the sense of unease, Congress went home for the presidential election without passing addition coronavirus financial relief.

COVID Tracking Project

There are now more than 70,000 positive tests per day, surpassing the former 68,000 peak in August, not a good sign. Infection rates have risen above 7 percent (red line in graph), also a sign of faster community spreading of the virus in the long expected third surge in virus infections.

So consumers that drive 70 percent of economic activity are in a quandary. Will the pandemic surge continue and so require consumers to stay at home, as in already happening in France and Germany with their new lockdowns from rising infection rates?

The Conference Board’s latest consumer confidence report was a mixed bag.

“Consumer confidence declined slightly in October, following a sharp improvement in September,” said Lynn Franco, Senior Director of Economic Indicators at The Conference Board. “Consumers’ assessment of current conditions improved while expectations declined, driven primarily by a softening in the short-term outlook for jobs. There is little to suggest that consumers foresee the economy gaining momentum in the final months of 2020, especially with COVID-19 cases on the rise and unemployment still high.”

Senior Director Franco sums up consumers’ current forebodings; what might happen for the rest of this year, and maybe into much of next year, until consumers have some confidence in an effective COVID-19 vaccine.

Harlan Green © 2020

Follow Harlan Green on Twitter: https://twitter.com/HarlanGreen

Thursday, October 5, 2017

It's Time to Build More Housing!

The Mortgage Corner

The National Association of Home Builders (NAHB) analysis of Census Construction Spending data shows that total private residential construction spending is soaring, as it rose to a seasonally adjusted annual rate (SAAR) of $520.9 billion in August, 0.5 percent up from downwardly revised July estimates.

But that’s not enough housing to satisfy current demand. There will be plenty of housing to replace, however, after this hurricane season has devastated so many U.S. states and territories.

Graph: NAHB.org

It was the fourth consecutive monthly increase after a dip in April, said the NAHB, Hurricane Harvey that made landfall late in August did not have significant impacts on construction spending in the same month, but will have a huge impact in months to come, as I said. The total private residential construction spending was 11.7 percent higher than a year ago. However, the blue line in the graph that represents residential construction spending still lags far behind commercial (red) and home improvement construction (gray lines).

The Midwest region is currently hurting the most from a housing shortage. Marketwatch’s Andrea Riquier reports the Home Affordability Index from real estate data provider Attom Data Solutions edged down to 100 in the third quarter, the lowest level since the third quarter of 2008, which was just as the financial crisis was taking hold.

Affordability is a problem because incomes haven’t risen as much as housing prices (especially in the Midwest). Attom notes that median home prices have risen 73 percent since bottoming out in 2012, while average weekly wages have increased only 13 percent in that time.

Why such a housing shortage so late in this recovery? For starters, the number of existing-homes listed for sale in 2017 to date is the lowest since 1999, according to the NAR. That’s in part because distressed sales volumes have fallen from more than 100,000 a month at the peak of the post crisis period, 2009-2012, to about 25,000 today, which means there aren’t many cheaply-priced homes left over from the housing crash.

And the construction industry because of a labor shortage has yet to catch up to soaring demand from a fully employed economy. More than half of the 3.5 million construction workers were laid off during the recession, and replacements are hard to find in this now fully employed economy.

Harlan Green © 2017

Follow Harlan Green on Twitter: https://twitter.com/HarlanGreen

Tuesday, May 2, 2017

Consumer Spending Down, Recession Looms?

Popular Economics Weekly

Wow! First-quarter GDP was paltry enough at 0.7 percent but consumer spending was even more paltry, at only 0.3 percent for the most embarrassing annualized pace since 2009, said Econoday. Unemployment is unusually low and consumer confidence unusually high making the results difficult to explain.


Could it be that nothing is happening in Congress and the White House on all those promised initiatives? The 5-month budget agreement left all spending priorities in place for the rest of this fiscal year (i..e., until September). That meant no money for a border wall, no defunding of Obamacare (as promised), or Planned Parenthood, or cuts in the EPA budget that protects our environment.

All the post-election euphoria for change hasn’t translated into actions, in other words. So, consumers may be keeping their powder dry, as their savings rate rose 0.2 percent to 5.6 percent.

Another worrisome indicator is almost no inflation, as core Personal Consumption Expenditure prices had the weakest showing in 16-1/2 years, according to Econoday. Core PCE prices fell 0.1 percent to take down the year-on-year rate by a sizable 2 tenths to 1.6 percent.

And if there’s no inflation, or falling inflation, it means there’s falling demand, which means falling profits. And that’s when a business cycle ends. So unless Congress and the Trump White House decide to stop playing with people’s minds on repealing Obamacare, or trying to pass a budget that cuts taxes for the wealthiest while cutting benefits to seniors and the sickest, we could see a looming recession.

The ineptitude of government is at the moment startling. The budget agreement leaves everything in place, which includes, thanks to the Washington Post’s Daily 202:

1. There are explicit restrictions to block the border wall, but final agreement goes further, putting strict limitations on how Trump can use new money for border security (e.g. to invest in new technology and repair existing fencing). Administration officials have insisted they already have the statutory authority to start building the wall under a 2006 law. This prevents such an end run.

2. Non-defense domestic spending will go up, despite the Trump team’s insistence he wouldn’t let that happen. The president called for $18 billion in cuts. Instead, he’s going to sign a budget with lots of sweeteners that grow the size of government. Mitch McConnell made sure $4.6 billion got put aside to permanently extend health benefits to 22,000 retired Appalachian coal miners and their families.

Nancy Pelosi made sure $295 million was included to shore up Medicaid in Puerto Rico. Chuck Schumer got $61 million to reimburse local law enforcement agencies for the cost of protecting Trump when he travels to his residences in Florida and New York. There is also another $2 billion in disaster relief money for states, which bought a couple votes. (Kelsey Snell, our lead budget reporter, has more examples.)

3. The administration asked to slash spending at the National Institutes of Health by $1.2 billion for the rest of this fiscal year. Instead, the NIH will get a $2 billion boost – on top of the huge increase it got last year. Republican appropriators who care about biomedical research, including Rep. Tom Cole (R-Okla.) and Sen. Roy Blunt (R-Mo.), delivered.Trump also failed in his efforts to cut money for other kinds of scientific inquiry. For example, he proposed defunding the Advanced Research Projects Agency–Energy. Instead, it is getting a $15 million increase.

4. Trump fought to cut the Environmental Protection Agency by a third. The final deal trims its budget by just 1 percent, with no staff cuts. As part of a compromise, the EPA gets $80 million less than last year, but the budget is $8 billion.

5. He didn’t defund Planned Parenthood. Despite the best efforts of social conservatives, the group will continue to receive funding at current levels.

6. The president got less than half as much for the military as he said was necessary. Trump repeatedly prodded Congress to increase military spending by $30 billion. He’s getting $12.5 billion, with an additional $2.5 billion if/when he delivers a detailed plan on how to defeat the Islamic State.

7. Democrats say they forced Republicans to withdraw more than 160 riders. These unrelated policy measures, which each could have been a poison pill, would have done things like get rid of the fiduciary rule and water down environmental regulations. On the other side of the ledger, this budget blocks the Justice Department from restricting the dispensing of medical marijuana in states where it has been legalized.

8. To keep negotiations moving, the White House already agreed last week to continue paying Obamacare subsidies. This money, which goes to insurance companies, reduces out-of-pocket expenses for low income people who get coverage under the Affordable Care Act. The Trump administration justifies giving up on this because of the potential to resolve the bigger issue by repealing Obamacare.

Need we say more?  If ideology trumps common sense; such as the promised $1 trillion infrastructure bill, we can see the confidence balloon also lose its air. Then watch out below, as I've said.

Harlan Green © 2017

Follow Harlan Green on Twitter: https://twitter.com/HarlanGreen

Wednesday, February 8, 2017

Surging Construction Sector Aids Home Sales


The Mortgage Corner

Construction payrolls were a positive surprise of the January employment report, rising 36,000 for the best gain since March. Construction was soft through most of last year though it did pick up at year end.

And this is why Pending and New-home sales are doing so well. Overall construction spending fell 0.2 percent in December but spending on new single-family homes rose 0.5 percent in the month with multi-family spending up 2.8 percent.


This is why sales of newly built, single-family homes rose 12.2 percent in 2016 to 563,000 units, the highest annual rate since 2007, according to newly released data by the U.S. Department of Housing and Urban Development and the U.S. Census Bureau.

Only public construction spending fell a sharp 1.7 percent in the month. Educational spending fell 2.2 percent with highways & streets down 0.6 percent. Private nonresidential categories (ie, commercial) are mixed with total spending for this component unchanged in the month.
“We are encouraged by the growth in the housing sector last year, and by the fact that builders increased inventory by 10 percent in anticipation of future business,” said Robert Dietz, chief economist of the National Association of Home Builders (NAHB). “NAHB’s forecast calls for continued upward momentum this year, with housing starts expected to rise 10 percent over the course of 2017.”
The inventory of new home sales for sale was 259,000 in December, which is a 5.8-month supply at the current sales pace, an improvement from the 5 percent range most of last year. The median sales price of new houses sold was $322,500, up from.


So we know why housing starts, or construction, is so important in building up inventories depleted by the Great Recession. Starts jumped 11.3 percent from the previous month to a seasonally adjusted annualized rate of 1226 thousand in December of 2016, beating market expectations of 1200 thousand. Multi-segment starts rebounded while single-family declined for the second month. Considering full 2016, housing starts rose 4.9 percent to 1166.4 thousand.
“This report represents firm growth for housing in 2016, as single-family starts rose 9 percent and multifamily production was down slightly,” said NAHB Chief Economist Robert Dietz. “We expect that 2017 will be another year of gradual, steady improvement in the housing market. Multifamily starts have been volatile in recent months, but should level off as supply meets demand. Meanwhile, single-family production continues to gain momentum but is limited by supply-side headwinds.”
So housing construction is returning to normal times. Starts in the United States averaged 1438.64 thousand from 1959 until 2016, reaching an all-time high of 2494 Thousand in January of 1972 and a record low of 478 Thousand in April of 2009.

Harlan Green © 2017


Follow Harlan Green on Twitter: https://twitter.com/HarlanGreen

Monday, January 9, 2017

Real Estate In 2017—Good Time To Buy?

 The Mortgage Corner

Surging mortgage rates, dwindling inventory, and soaring home prices are taking a toll on Americans’ attitudes toward ownership, according to a home purchase sentiment survey released Monday. But that may be misleading, as mortgage rates have barely budged from post-WWII lows. And the construction industry and homebuilders’ sentiments are soaring, which means many more new homes will be coming into the housing market.

December 2016 Index
Change since last month Change since last year
Good time to buy 32 +2 -3
Good time to sell 13 0 +5
Home prices will go up 35 0 -5
Mortgage rates will go down -55 -4 -3
Confidence about not losing job 68 +4 -4
Household income is significantly higher 10 -5 -5
Overall index 80.7 -0.5 -2.5

The home purchase sentiment index compiled by mortgage finance provider Fannie Mae fell in December, its fifth straight monthly decline. Fannie’s index has six components. In December, two were lower compared to November, two were unchanged, and two increased. The increases were because respondents were more confident about not losing their jobs, and thought it a better time to buy. The biggest negative was their belief interest rates would rise this year. But it may be a small rise due to market uncertainties. Stocks are already oversold and interest rates still at historic lows, as I’ve said.


Construction had been lagging through most of 2016 but, like the factory sector (i.e, auto sales ended 2016 at record high of 18.5 million sold vehicles), appears to have picked up steam going into year-end, says Econoday. Spending rose 0.9 percent in November and is now up 4.1 percent annually. And non-residential construction’s boost is particularly heartening with its emphasis on infrastructure projects, up 0.9 percent with most categories showing gains led by office construction and transportation construction. Public spending was also solid including a 3.1 percent monthly jump in Federal spending (which boosts public infrastructure spending).

Residential spending rose 1.0 percent in the month on top of October's 1.6 percent gain. The gain here is concentrated in single-family homes which offset a monthly dip for multi-family units which otherwise have been leading the residential sector. Home improvements added to the spending in November.

The 30-year fixed conforming mortgage rate quoted by Fannie Mae is back down to 3.75 percent for one origination point. And what with the future uncertainty of the stock market (with indexes already at historic highs), much of the excess savings will remain in bonds, the major determinate of mortgage rates.

That is, unless worldwide growth picks up. But that won’t happen if Trump carries out his promise of trade wars to promote American workers first. That promise may be difficult to carry out, however, since his Republican colleagues have historically been free-traders.

Harlan Green © 2016

Follow Harlan Green on Twitter: https://twitter.com/HarlanGreen

Saturday, May 28, 2016

Future Home Sales Also Soaring

The Mortgage Corner

It looks like housing sales this year could return to pre-recession levels (though not into bubble territory), as all 3 major housing stats—existing, new, and now Pending-home sales are off to a good start in 2016.


Pending home sales increased for the third consecutive month in April, in spite of all the market uncertainties, surging to the highest level in over a decade, according to the National Association of Realtors.

The Pending Home Sales Index, a forward-looking indicator based on contract signings, hiked up 5.1 percent in March and is now 4.6 percent above April 2015. Lawrence Yun, NAR chief economist, says huge gains in the South and West propelled pending sales in April to their highest level since February 2006 (117.4).
“The ability to sign a contract on a home is slightly exceeding expectations this spring even with the affordability stresses and inventory squeezes affecting buyers in a number of markets,” he said. “The building momentum from the over 14 million jobs created since 2010 and the prospect of facing higher rents and mortgage rates down the road appear to be bringing more interested buyers into the market.”
Pending home sales in the South jumped 6.8 percent in April and is 5.1 percent higher than last April, while the index in the West climbed 11.4 percent in April, now 2.8 percent above a year ago. In the Midwest, which posted the only drop, the index declined slightly, but is still 2.0 percent above April 2015.

Although the future of mortgage rates is in question, Yun said, “Even if rates rise soon, sales have legs for further expansion this summer if housing supply increases enough to give buyers an adequate number of affordable choices during their search.”

What is driving the burst in home sales in general? It’s the increase in household formation, as millennials finally leave home or school to move into their own housing. A recent SF Fed paper predicts higher household formation in the next several years, much higher even than predictions by the Harvard Joint Center for Housing Studies of 1 to 1.2m households per year over the next decade.
“To the extent that headship rates among various age groups stabilize, household formation can be expected to more closely follow the growth in adult population…In that baseline projection, older age groups tend to have the highest growth rates. Since the older group also has traditionally higher shares of heads of households, this should mean a higher headship rate overall.”
Given current 12-month annual headship rates by age group, the Census Bureau projections imply household formations averaging on the order of 1.4 to 1.5 million per year through 2020, said the SF Fed. It compares favorably to an average of a little less than 900,000 annually over the past five years.


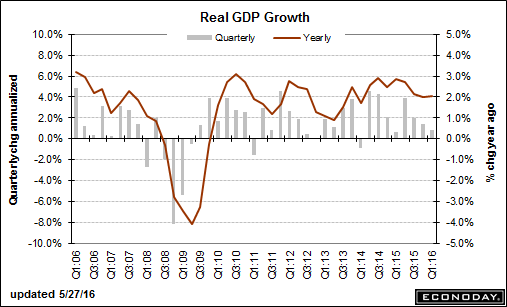
This is huge, folks. If household formation is increasing this much then the real estate industry will help boost overall economic growth. Q1 2016 GDP growth was revised up slightly to 0.8 percent, and spending on residential construction increased at a 17.1 percent rate in the first quarter, the fastest pace since the fourth quarter of 2012. Residential construction added 0.56 percentage point to first-quarter GDP growth, up from the 0.49 percentage point reported last month.

Income at the disposal of households after accounting for taxes and inflation was revised up to show it jumping at a 4.0 percent rate in the first quarter instead of the previously reported 2.9 percent. Savings were revised up to $782.6 billion from $712.3 billion.

This means there should be much higher second quarter GDP growth, needless to say, as retail sales are again booming, and retail sales are again booming. Consumers came back to life in April, driving retail sales 1.3 percent higher. Autos are the key component, up a sharp 3.2 percent to reverse the prior month's decline. Excluding autos, retail sales rose 0.8 percent, still a strong number.

Harlan Green © 2016

Follow Harlan Green on Twitter: https://twitter.com/HarlanGreen


Friday, March 11, 2016

Consumers' Financial Health Much Better


Consumers’ financial health has substantially improved in 2015, and their net worth has now surpassed that of pre-recession 2006, according to the Fed’s 2015 Q4 Flow of Funds report.  That is the main reason economic growth prospects have picked up in 2016.
The net worth of households and nonprofits as a percentage of Gross Domestic Product rose to $86.8 trillion during the fourth quarter of 2015, said the Fed. The value of directly and indirectly held corporate equities increased $758 billion and the value of real estate rose $458 billion.  Consumers’ net worth is now the highest in history in this graph that dates back to 1952.  This includes real estate and financial assets (stocks, bonds, pension reserves, deposits, etc) net of liabilities (mostly mortgages).


            We are in a goldlilocks economic moment, in other words.  Gas and energy prices in general are extremely low, there is almost no inflation, and we are nearing full employment.  Interest rates are also still at record lows, with fixed 30-year conforming mortgage rates still at 3.375 percent for a 1 point origination fee, which means housing will continue to contribute to growth.
 

      We know consumers are buying more because consumer debt is increasing.  January's increase in total outstanding consumer credit is an initial $10.5 billion (subject to later revisions, as more data comes in). But revolving credit, the component that tracks credit cards, fell $1.1 billion in January following December's nearly unrevised $5.5 billion increase (due to holiday spending). Even with January's dip, revolving credit has been showing strength and has been positive for consumer spending, hinting at greater willingness of the consumer to take on credit-card debt.
            And sure enough, ex-gas retail sales month-to-month expanded for seven months in a row which matches the longest streak in five years, as I’ve said. Year-on-year, ex-gas sales are at a very respectable plus 4.5 percent and reflect special strength in vehicle sales, up 6.9 percent on the year.


            This is while overall construction spending rose a strong 1.5 percent in January in strength. A one-month surge in highway & street spending skewed the headline higher as did gains for manufacturing and on Federal construction projects.  Year-on-year rates include an impressive 33.9 percent gain for highways & streets which is a big category. Federal, a far smaller category, is up 9.9 percent.
Turning to the private nonresidential components, offices lead at a 24.8 percent year-on-year gain.  Demand on the multi-family side, reflecting strength in rental prices, also has been very strong with year-on-year spending up 30.4 percent vs 6.6 percent for single-family homes. Together, residential spending is up a year-on-year 7.7 percent.
We mention construct spending because construction will continue to add higher paying jobs, so important to income growth, in particular.

Harlan Green © 2016

Follow Harlan Green on Twitter: https://twitter.com/HarlanGreen

Wednesday, March 2, 2016

Construction Boosted By Public Works, Offices

We are already seeing the results of the $1.1T budget agreement, and $305 STIRR Surface Transportation and Highway Trust Fund bill.  Construction spending rose a strong 1.5 percent in January due to a surge in highway & street spending as well as gains for manufacturing and on Federal construction projects.


This is incredible news, as it is the first time that Repubs and Democrats agreed on federal spending since the great sequester cut spending across the board in 2011.  The result will be much needed repairs of our almost century-old infrastructure.  Remember those Flint, Michigan lead drinking water pipes?
We may be finally turning the corner on neglect of our public infrastructure, so held back by the austerity policies of one political party. There was an impressive 33.9 percent gain for highways & streets (mostly done by states), and a smaller 9.9 percent increase in the Federal category.
And also in the private sector, private nonresidential components, namely offices, had a 24.8 percent year-on-year gain.  This is another sign of increased business investment.
But the housing sector also benefited on the multi-family side, reflecting strength in rental prices.  Year-on-year spending on rental housing is up 30.4 percent vs 6.6 percent for single-family homes. Together, residential spending is up a huge year-on-year 7.7 percent.
The availability of acquisition, development and construction (AD&C) loans has been a factor holding back a stronger rebound in home construction until now, but easing credit conditions and a growing loan base should help expand the residential building market.
According to the National Association of Home Builders and FDIC analysis, the outstanding stock of 1-4 unit residential construction loans made by FDIC-insured institutions rose by $2.6 billion during the fourth quarter of 2015, raising the total stock of outstanding loans to $60.9 billion.


            “On a year-over-year basis, the stock of residential construction loans is up 18.9%, as indicated by the red bars in the graph above. The current reading is higher than the 16% to 17.5% annual growth rate range that the series had been in for the prior year and a half, says the NAHB. “This change suggests accelerating single-family building growth in 2016, which is consistent with NAHB’s forecast. Since the first quarter of 2013, the stock of outstanding home building construction loans has grown by 49%, an increase of $20.1 billion.”
This is further evidence the housing market is just beginning to recover.  Banks are finally lending again, and interest rates are at record lows, with the 10-year TBond yield at 1.76 percent and 30-year conforming fixed rates as low as 3.25 percent in California.

Harlan Green © 2016

Follow Harlan Green on Twitter: https://twitter.com/HarlanGreen