Showing posts with label personal income. Show all posts

Tuesday, February 16, 2021

Another Roaring Twenties--Part II

 Financial FAQs


For another ‘Roaring Twenties’ recovery to happen, Nobel Prize-winner Joe Stiglitz warns in Project-Syndicate that we must pass President Biden’s $1.9 trillion American Rescue Plan.

“Biden’s proposed spending plan is urgently needed. Recently released data show a slowdown in America’s recovery both in terms of GDP and employment. There is overwhelming evidence that the recovery package will provide enormous stimulus to the economy, and that economic growth will generate substantial tax revenues, not just for the federal government but also for the states and municipalities that are now starved of the funds they need to provide essential services.”

The University of Michigan’s early February consumer sentiment survey says much the same. Consumer sentiment edged downward in early February, with the entire loss concentrated in the Expectation Index and among households with incomes below $75,000 (the income brackets targeted by the government cash payouts).

“Households with incomes in the bottom third reported significant setbacks in their current finances, with fewer of these households mentioning recent income gains than anytime since 2014 (see the chart),” said the U. Michigan survey.

When asked to assess their current financial position, the deep divisions become apparent: among those with incomes in the bottom third, just 23 percent reported improved finances, the lowest since 2014; in contrast, among those with incomes in the top third, 54 percent reported their finances had improved. Mentions of income gains fell to just 17 percent among those in the bottom third, compared with 44 percent in the top income third.

The end result is more layoffs - one million-plus applications for unemployment benefits are still being filed each week. Jobless claims total almost 800,000 at state level and 334,524 file though federal emergency program in early February.


Why won’t the $1.9 trillion in additional government spending cause too high inflation, or some other excess from the fear of too hot economic growth? Because interest rates are in effect at zero, and so is retail (CPI) inflation.

Interest rates measure the cost of money, which in effect is cost-free, at the moment. There is so much money floating around the world’s economy that lenders are begging borrowers to use that surplus, and actually paying borrowers in the case of certain EU countries with negative interest rates.

Now is not the time to hoard what can be used to improve lives—especially the lives of those -such as those police, healthcare essential workers that keep this economy working.

A first priority say leading economists, is to make sure enough funds are available to fight the pandemic, then get children back into schools, as well as allowing state and local governments to provide the essential services we all depend on.

Harlan Green © 2020

Follow Harlan Green on Twitter: https://twitter.com/HarlanGreen

Saturday, May 30, 2020

A Fall Revival?

Financial FAQs


The second estimate of first quarter real GDP growth was revised to a negative -5.0 percent from its initial estimate of -4.8 percent, with the decline in consumer services the main culprit. It only hints at how much second quarter GDP may decline.

And today’s April personal income data from the Commerce Department confirms consumers that make up 67 percent of economic activity aren’t buying, so producers aren’t producing the services that consumers use (blue section of bar in graph). Information, retail and wholesale trade, scientific, technical and professional services are the major parts of this sector.

Americans personal income rose 10.5 percent but consumer spending fell 13.6 percent after falling 6.9 percent in March. Most of the income rise was from government support payments, as wages also fell. The rise in incomes and the drop in spending pushed the savings rate up to 33 percent in April from 12.7 in the prior month.

The high rate of savings is telling us consumers won’t begin to spend again until they feel safe.
Second quarter GDP growth will inevitably shrink much more due to 2.1 million more workers applying for unemployment benefits in the latest week, bringing the total to more than 46 million.

But combined with federal layoffs the total is closer to 3 million in the latest survey.  Initial claims have fallen steadily since hitting a record 6.9 million in the week ended March 28.


But Reuters reports the big surprise in the jobless claims data was a 3.7 million decline in the reported level of continuing claims in the regular state programs, which is a sign that more are returning to work.  In not seasonally adjusted terms, the number of state beneficiaries fell from 22.8 million to 19.1 million in the week of May 16.

The sharp rise in unemployment has made consumers more cautious, as I’ve been saying. Retail sales fell a record 16.4 percent in April. The government checks over the past two months helped consumers pay their bills but for the economy to recover, consumer spending has to rebound.

While it is possible that the decline in continuing claims reflects individuals who left the benefit program as the economy reopened,” said Reuters, “the erratic pattern in the data for some states makes us wary of reading too much into the week to week fluctuations.  (Florida’s jobless rolls fell 76% in the week of May 16, from 2.2 million to 0.5 million; California’s fell 40%, from 3.6 million to 2.1 million.)  We would not extrapolate from the May 16 level.”

One economist stated that though social distancing measures are gradually being relaxed across the country, the lingering virus fear and restrained incomes “will continue to constrain consumers’ willingness and ability to spend.”

This is while experts and Federal Reserve banks such as the Atlanta Fed are predicting GDP shrinkage of as much as 40 percent in the second quarter, while consumers continue to stay close to home.

The hope will be that activity picks up again in the fall, if the federal government will show some nationwide leadership in what is after all, a nationwide pandemic.

Harlan Green © 2020

Follow Harlan Green on Twitter: https://twitter.com/HarlanGreen

Sunday, November 24, 2019

Start of a New Housing Boom?

The Mortgage Corner


We should be careful in announcing a new housing boom. It can be a two-edged prophesy, since a housing bust followed the last housing boom and precipitated the Great Recession.

But it certainly looks like residential construction is one sector on a tear at present; at the same time as there is a significant housing shortage and housing construction isn’t yet back to historical levels, per the above single-family starts graph.

Housing construction is booming per the latest U.S. Census Bureau report on housing starts and permits, but is far below the peak of some 1.7 million units just prior to the Great Recession.
October starts are at a 1.314 million annual rate, the strongest showing since May last year. Permits are the big positive in today's report, well above expectations at a 1.461 million rate which is the strongest since the subprime housing bubble bust in 2007.

The National Association of Home Builders (NAHB) Chairman Greg Ugalde said, “Home builders are seeing more building opportunities as market conditions remain solid. Builder sentiment remains strong, and we are seeing an uptick in buyer traffic.”

The October 1.31 million starts is the number of housing units builders would begin if they kept this pace for the next 12 months, explained the NAHB in their press release. Within this overall number, single-family starts increased 2.0 percent to 936,000 units. The multifamily sector, which includes apartment buildings and condos, increased 8.6 percent to a 378,000 pace.
“Led by lower mortgage rates, the pace of single-family permits has been increasing since April, and the rate of single-family starts has grown since May,” said NAHB Chief Economist Robert Dietz. “Solid wage growth, healthy employment gains and an increase in household formations are also contributing to the steady rise in home production.”
Three-month averages for the key single-family category confirm the construction and future permits strength. Starts are running at a 923,000 rate on the average which is another 12-year high and up sharply over the last two months. Single-family permits are at an 888,000 rate which is likewise pivoting higher and also the strongest in 12 years.

But longer term, single-family construction has consistently been at or above one million annualized units since the 1970s with a much smaller U.S. population. So there is a lot of catching up from the housing bust and Great Recession.

FRED’s Personal Income graph shows that most Americans are in fact still recovering from the Great Recession. And to even begin to approach the historical starts’ average it needs record-low interest rates to continue, given the depressed earnings picture for most Americans since the Great Recession.


Personal incomes have been consistently lower because most new jobs created today are in the lower-paying service sector, such as warehousing, health care, transportation, and the like, even in our fully-employed economy.

But the prognosis for interest rates is they could even go lower, which should continue the housing ‘boom’, or whatever we end up calling it. EU countries such as Denmark are already offering negative fixed interest rate mortgages, believe it or not. Can that happen here?

It will be the subject for a future column.

Harlan Green © 2019

Follow Harlan Green on Twitter: https://twitter.com/HarlanGreen

Friday, September 27, 2019

Q2 GDP Growth Unchanged

Popular Economics Weekly


In the face of declining consumer confidence, but strong consumer and government spending, the third estimate of second quarter GDP growth was unchanged at 2 percent.
The BEA reported the increase in real GDP in the second quarter reflected positive contributions from personal consumption expenditures (PCE), federal government spending, and state and local government spending that were partly offset by negative contributions from private inventory investment, exports, nonresidential fixed investment and residential fixed investment. Imports, which are a subtraction in the calculation of GDP, increased.
Consumer spending is increasing at 4.6 percent, while government spending that combines federal, state and local outlays is 4.8 percent higher, while inflation is basically flat for a variety of reasons. The PCE price index increased 2.3 percent, compared with an increase of 0.4 percent in the first quarter. Excluding food and energy prices, the PCE price index increased 1.8 percent, compared with an increase of 1.1 percent.

The ‘other’ shoe to drop was the Conference Board’s consumer confidence index that fell to a three-month low of 125.1 this month from 134.2 in August.

“Consumer confidence declined in September, following a moderate decrease in August,” said Lynn Franco, Senior Director of Economic Indicators at The Conference Board. “Consumers were less positive in their assessment of current conditions and their expectations regarding the short-term outlook also weakened. The escalation in trade and tariff tensions in late August appears to have rattled consumers. However, this pattern of uncertainty and volatility has persisted for much of the year and it appears confidence is plateauing. While confidence could continue hovering around current levels for months to come, at some point this continued uncertainty will begin to diminish consumers’ confidence in the expansion.” 
That and other indicators show slowing growth—for instance, consumers are saving more of their incomes. This is one factor holding down inflation that was discussed in earlier columns. Seniors are saving more due to extraordinarily low interest rates on which their fixed incomes are dependent, and perhaps more caution about future growth prospects.

Personal saving was $1.32 trillion in the second quarter, compared with $1.37 trillion in the first quarter. The personal saving rate -- personal saving as a percentage of disposable personal income -- was 8.1 percent in the second quarter, compared with 8.5 percent in the first quarter.

Wholesale inflation has fallen from its high in 2018 as the Trump tax cut stimulus has worn off, though the increase in the core rate of wholesale inflation over the past 12 months rose slightly to 1.9 percent in August from 1.7 percent. Economists prefer core inflation readings because food, gas and trade margins can swing sharply from month to month and mask underlying price trends.

I said last week that six in 10 Americans now say a recession is likely in the next year and as many are concerned about higher prices because of the trade war with China, helping to knock six points off President Donald Trump’s job approval rating in the latest ABC News/Washington Post poll.

This is putting downward pressure on prices, as such fears reduce the demand for goods and services in general. Ratings of the U.S. economy overall, 56 percent positive, are down from 65 percent last fall in this poll, produced for ABC by Langer Research Associates.

Most ominously, 60 percent see a recession as very or somewhat likely in the next year. That’s within sight of the 69 percent who said so in November 2007, one month before the onset of the Great Recession.

Harlan Green © 2019

Follow Harlan Green on Twitter: https://twitter.com/HarlanGreen

Friday, August 30, 2019

Q2 GDP Growth Slowing—What Else?

Popular Economics Weekly


The 2nd estimate of second quarter Real Gross Domestic Growth slowed to 2 percent, from 3.1 percent in January. It looks like growth is slowing to the average rate that has prevailed since the end of the Great Recession.

Consumers are reacting to the slowdown in the U. of Michigan sentiment survey of 600 telephone respondents, which was well below expectations and the lowest reading since October 2016. The expectations component also fell more than 10 points in the month with the current conditions component down more than 5 points.
“The report cites consumer apprehension over rising tariffs which, for this phone sample, were spontaneously mentioned by 1/3 of the respondents” said Econoday.
There have been other signs of slower growth as well. The Economist reports US Steel announced earlier in August it would lay off 200 workers in Michigan. Sales of camper vans dropped by 23 percent in the 12 months ending in July, threatening the livelihoods of thousands of workers in Indiana, where many are made. Factory workers are not the only ones on edge. Lowes, a retailer, recently said it would slash thousands of jobs. Halliburton, an oil-services firm, is cutting too.

Why the slowdown now? Consumers are still spending (brown line), as the BEA’s Disposal Personal Income graph shows—but it’s a lot more than they are earning (blue line).


This means they could stop spending if any more shocks occur, such as the possibility that China might wait until after the 2020 election to make a deal.  Exports and residential investments also declined from Q1.


Manufacturing is the mainstay of exports. Employment in durable-goods manufacturing peaked in June 2006, about a year and a half before the onset of recession. This year has been another brutal one for industry. An index of purchasing managers’ activity registered a decline in August.

Since last December manufacturing output has fallen by 1.5 percent. Hours worked—considered to be a leading economic indicator—are declining. Some of this is also linked to President Donald Trump’s trade wars, which have hurt manufacturers worldwide.

Last Friday China said it would  increase existing tariffs from 5 percent to 10 percent on more than 5,000 U.S. products, including soybeans, oil and aircraft. A 25 percent duty on American-made cars would also be reinstituted. The value of these products is estimated by the Chinese Commerce Ministry to total around $75 billion.

Trump responded after financial markets closed by saying he would raise current U.S. tariffs. A 10 percent duty on $300 billion in Chinese goods will be raised to 15 percent in September while a 25 percent tariff on $250 billion in imports would be increased to 30 percent in October.

And on Wednesday, MarketWatch’s Robert Schroeder reported a coalition of 161 manufacturers, farmers, retailers, natural gas and oil companies as well as other business groups, as well as other business groups, sent a letter asking Trump to postpone tariff rate increases on Chinese goods slated to take effect this year.

Does that look like they are near to making a deal?

Harlan Green © 2019

Follow Harlan Green on Twitter: https://twitter.com/HarlanGreen

Monday, January 28, 2019

What is a Living Wage?

Answering the Kennedys Call

The Washington Post published a recent interview with new Democratic House Member Alexandria Octavia-Cortez in which she said, “I think it’s wrong that a vast majority of the country doesn’t make a living wage, I think it’s wrong that you can work 100 hours and not feed your kids. I think it’s wrong that corporations like Walmart and Amazon can get paid by the government, essentially experience a wealth transfer from the public, for paying people less than a minimum wage.”

Is it true that most Americans don’t make a living wage? Actually, that is not the right question we should be asking, which has been the subject of endless debate, anyway. What constitutes a living wage has to be different for each individual. Wouldn’t someone born and raised amid extreme wealth, say, have what they consider a far different living wage than a religious ascetic?

That’s an extreme example, but why not concentrate on what I believe Congresswoman Cortez is really talking about—fair play for the majority of Americans? There are maybe 25 percent who live at or below the poverty line that must work more than 40 hours per week to even make ends meet, depriving them of family, or enough leisure time to enjoy themselves. Europeans seem to have conquered the problem in countries like Denmark and the Netherlands, where the average workweek is 34-36 hours, with four weeks' paid vacation and universal health care for their citizens.

Meanwhile, American conservatives have worked to lower taxes on the wealthiest, while enhancing the monopoly powers of corporations since at least 1980. It has resulted in the greatest income inequality in the U.S. since 1928, the wealthiest country in the world, as illustrated by this well-known Piketty-Saez graph.


The result has not been good for a participatory democracy. The American electorate has become polarized, which has brought out the worst in human nature—including anti-immigrant racism, white nationalism, and the tearing down of government regulations that safeguard health and the environment. The consequence is a much reduced middle class that once maintained civility in political discourse.

Even conservative Barron’s Magazine editor Randall Forsythe mentions a 2017 Federal Reserve Consumer Finance study that showed the huge wealth disparities during the recent federal government shutdown—four in 10 Americans would have difficulty in meeting a $400 emergency expense—while the top 1 percent of income earners now own 50 percent of stock holdings.

PEW Research in a 2018 report, reports that year-over-year average hourly earnings have been rising at 2 to 3 percent. “After adjusting for inflation, however, today’s average hourly wage has just about the same purchasing power it did in 1978, following a long slide in the 1980s and early 1990s and bumpy, inconsistent growth since then. In fact, in real terms average hourly earnings peaked more than 45 years ago: The $4.03-an-hour rate recorded in January 1973 had the same purchasing power that $23.68 would today.”
We are seeing the results of the singular focus on private profits rather than public welfare spending that should include adequate healthcare, improved infrastructure, and educational facilities that would elevate America back into the pantheon of western countries, instead of becoming an outlier that is withdrawing from the developed world.

Maybe we are also seeing how the word socialism is beginning to scare the wealthy to return some of their newly-begotten wealth to bring back a democracy that benefits the majority of Americans.

Harlan Green © 2019

Follow Harlan Green on Twitter: https://twitter.com/HarlanGreen

Friday, January 25, 2019

What Happened to Consumers' Confidence?

Financial FAQs


Consumer sentiment declined in early January to its lowest level since Trump was elected, reported the December U. of Michigan sentiment survey. It’s down for a number of reasons—too many reasons, and economists are consequently beginning to predict GDP growth will be reduced to the 2 percent annual growth average that has prevailed since the end of the Great Recession.
“The decline was primarily focused on prospects for the domestic economy, with the year-ahead outlook for the national economy judged the worst since mid-2014. The loss was due to a host of issues including the partial government shutdown, the impact of tariffs, instabilities in financial markets, the global slowdown, and the lack of clarity about monetary policies. Aside from the direct economic impact from these various issues on the economy, the indirect effect meant that half of all consumers believed that these events would have a negative impact on Trump's ability to focus on economic growth.”
How serious are the present crises? It depends on their duration. The shutdown is easiest to solve, if the parties can unite in agreement on what exactly constitutes a border ‘wall’—would a digital wall suffice, along with better-funded courts and more Border agents?
“While the January falloff in optimism is certainly consistent with a slowdown in the pace of growth,” said U of Michigan chief economist Richard Curtin, “it does not yet indicate the start of a sustained downturn in economic activity. It is the strength in personal finances that will continue to support consumption expenditures at favorable levels in 2019. Nonetheless, consumers now sense a need to buttress their precautionary savings, which is typically done by reducing their discretionary spending. Evolving job and wage prospects, which were slightly weaker in early January, are critical to extending the current expansion.”
Consumer confidence is based on other factors, as well, such as the job market. The other confidence index, the Conference Board’s Consumer Confidence Index showed lower future job expectations.
“Consumer Confidence decreased in December, following a moderate decline in November,” said Lynn Franco, Senior Director of Economic Indicators at The Conference Board. “Expectations regarding job prospects and business conditions weakened, but still suggest that the economy will continue expanding at a solid pace in the short-term. While consumers are ending 2018 on a strong note, back-to-back declines in Expectations are reflective of an increasing concern that the pace of economic growth will begin moderating in the first half of 2019.”
As has been mentioned by many commentators and economists, the Trump administration isn’t equipped or staffed to handle multiple crises, much less a serious single one. Michael Lewis’ The Fifth Risk was the latest warning of what might happen with an administration that didn’t want the federal government to function well, and appointed administration officials—mainly lobbyists of industries that it regulated—whose mandate was to make sure it increased the profits of their industries rather than the welfare of the American public. That meant it would have a difficult time handling any major crisis, such as the ongoing government shutdown.

So it’s easy to see why consumers are feeling queasy and want to save more of their rising incomes, rather than spend them. Other factors that might be scaring consumers are the ongoing tariff wars, and the IMF prediction of slower worldwide growth.

Maybe doing nothing, other than re-opening the federal government for business, is the better choice for maintaining healthy growth. A revised NAFTA agreement has yet to be ratified by the Senate to take effect. And a “lack of clarity about monetary policies” probably means the Federal Reserve will stop raising short term rates for a while, which will hearten the financial markets, as well.

Harlan Green © 2019

Follow Harlan Green on Twitter: https://twitter.com/HarlanGreen

Thursday, September 27, 2018

How Severe Will Be the Next Recession?

Financial FAQs


Why are we discussing the possibility of a severe recession when GDP growth is expected to average 3 percent this year, the highest annual average growth rate in several years? Because there is too much federal debt, to put it bluntly.

The very unpopular, all-Republican tax cuts of December, 2017 will add $1.5 trillion to the national debt over 10 years, while cutting approximately $1 trillion in Medicaid, food stamp (SNAP) and other aid to lower-income citizens.
“By 2028, America’s government debt burden could explode from this year’s $15.5 trillion to a staggering $33 trillion—more than 20 percent bigger than it would have been had Trump’s agenda not passed,” said a recent Forbes article. “At that point, interest payments would absorb more than $1 in $5 of federal revenue, crippling the government’s capacity to bolster the economy, and constraining the private sector too.”
Contrary to the claims of the President and his supporters, the U.S. can’t grow fast enough to shed this burden. Trump’s agenda on immigration and trade is more likely to stunt that growth, said Forbes. “This is almost like climate change,” remarked Mark Zandi, chief economist at Moody’s Analytics. “It doesn’t do you in this year, or next year, but you’ll see the ill effects in a day of reckoning.”

In addition, Republicans in control of congress left no funds for spending on badly needed infrastructure repairs and upgrades, the spending that would actually increase overall productivity and future economic growth. Economists calculate such spending would add $1.25 to $1.50 to the GDP for every dollar spent on improving our roads, bridges, electrical grid, airports; not to speak of better water and sewer treatment facilities.

And the Federal Reserve announced today at the end of their FOMC meeting that they are raising interest rates one quarter percent for the third time this year and signaled it will raise the cost of borrowing again in December, ending the long period of accommodative credit policies enacted since the end of the Great Recession. This will constrict credit and reduce consumer demand by raising the cost of everyday borrowing on credit cards and installment loans that are based on short-term rates.

The Fed is doing this at the wrong time with inflation still low, personal incomes barely increasing, and no discernable benefits for most consumers from the tax cuts. Fed Governors on Wednesday increased its target for its benchmark lending rate to a range of 2 percent to 2.25 percent. Rates are now at their highest level since shortly after the bankruptcy of Lehman Brothers in the fall of 2008.

It will probably be those latest tax cuts and rising debt load that sinks the current 9-year recovery, just as the GW Bush tax cuts erased four years of budget surpluses at the end of the longest growth cycle ever—from 1991-2001—contributing to the Great Recession and record federal debt of today.

This is while a larger federal budget is about to be signed by President Trump with no new taxes enacted to pay for it. It is not how to run a successful business, or country.

Harlan Green © 2018

Follow Harlan Green on Twitter: https://twitter.com/HarlanGreen

Monday, August 7, 2017

Another Great Jobs Report?

Financial FAQs

No economist predicted another 209,000 private payroll jobs would be created in July, or that the last 2 months’ total would be 431,000, or the y-t-d total would be 1,290,000 payroll jobs created this year.

But they should have. The May JOLTS report was an indicator of higher employment numbers, as the unfilled jobs total dropped to 194,000 from 1 million the month before, for a total of 5.472 million hirings in May.


Job gains occurred in food services and drinking places, professional and business services, and health care. Employment growth has averaged 184,000 per month thus far this year, in line with the average monthly gain in 2016 (+187,000), said the Labor Bureau.

The only glitch, if that can be considered a problem, is that wages are still rising at 2.5 percent annually, which means two things. It means consumers won’t buy more than they are already buying, which would in turn increase demand and so increase economic growth, and there’s very little inflation, which means interest rates won’t be rising soon.

Wages aren’t rising faster because there are still many unemployed, or working part time when they would rather be working full time. “Both the unemployment rate, at 4.3 percent, and the number of unemployed persons, at 7.0 million, changed little in July. After declining earlier in the year, the unemployment rate has shown little movement in recent months,” said the BLS.

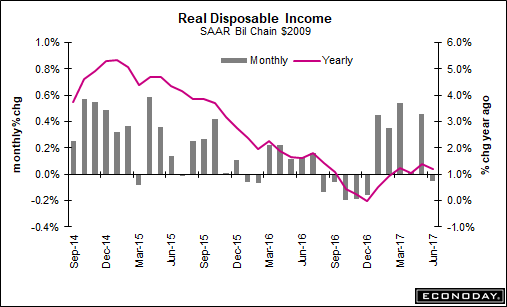
June’s Real Disposable Income was unchanged and May revised 1 tenth lower to a 0.3 percent gain, as I said in an earlier column. The real problem is weak wage growth, as most jobs being created are in low wage industries, like hospitality and even healthcare. Year-on-year, overall prices are up only 1.4 percent with the core little better at 1.5 percent.

Graph: Econoday

The 3 major employment sectors were Professional and Business Services, Healthcare, and Leisure and Hospitality as usual, all generally lower-paying job sectors.

Employment in food services and drinking places rose by 53,000 in July, said BLS. The industry has added 313,000 jobs over the year. Professional and business services added 49,000 jobs in July, in line with its average monthly job gain over the prior 12 months.

In July, health care employment increased by 39,000, with job gains occurring in ambulatory health care services (+30,000) and hospitals (+7,000). Health care has added 327,000 jobs over the past year.

What are those wages? In July, the BLS says, average hourly earnings for all employees on private nonfarm payrolls rose by 9 cents to $26.36. Over the year, average hourly earnings have risen by 65 cents, or 2.5 percent. In July, average hourly earnings of private-sector production and nonsupervisory employees increased by 6 cents to $22.10.

So the U.S. economy is in a bit of a bind, if it wants to grow faster. And that is a lack of population growth, one of two main drivers of GDP growth, when conservatives want to limit immigration?

The U.S. native population is barely growing, so where else are those workers coming from? And businesses are investing a bare minimum in capital expenditures, robots and other technologies that would increase productivity, the other driver of growth.

And then we have jumped off the Paris Accord bandwagon, when China is tripling its investments in alternative energy sources, such as wind and solar farms. That will also boost productivity and hence growth—for China and the rest of the world that isn’t ignoring climate change.

But conservative still have their heads stuck in coal mines, for some reason. Go figure. What century do they think we are living in?

Harlan Green © 2017

Follow Harlan Green on Twitter: https://twitter.com/HarlanGreen

Wednesday, July 12, 2017

Minimum Wage Raises Should Boost Spending, Employment

Financial FAQs

Minimum wages are about to rise in several cities, and eventually states. San Francisco and Los Angeles minimums are rose last weekend to $14 and $12 per hour, respectively, and ultimately to $15 per hour by 2021. But Seattle, Washington, Washington D.C., Chicago, Maryland, and New York will be raising their minimum wages, as well.

This should finally boost incomes, and maybe consumption for the rest of 2017. Central Banks are beginning to raise their rates, as well, which means they see stronger growth ahead.

But this all depends on the consumer, as businesses won’t spend and boost hiring until they see consumers spending more. Friday’s unemployment report told us we see growing demand ahead. The various QE programs and extremely low inflation have kept long term rates below 3 percent for several years because consumer incomes have been trending down lately, as I’ve said.
 
Graph: Econoday

For instance, personal income has been struggling, posting only a 3.5 percent year-on-year rate the last two months with the trend line pointing to just under 3 percent, reports Econoday. And that has kept spending in a narrow 4-5 percent range, as well.

Last week’s ISM service sector activity report could mean more hiring ahead, since the service sector employs roughly two-thirds of American workers. Its non-manufacturing survey continues to report extending strength with the index up 5 tenths in June to 57.4. New orders, at 60.5, remain unusually strong with backlog orders, at 52.0, also rising in the month. New orders for export, at 55.0, are also up solidly though to a lesser degree than domestic orders.
“The non-manufacturing sector continued to reflect strength for the month of June. The majority of respondent’s comments are positive about business conditions and the overall economy," said Anthony Nieves, Chair of the Institute for Supply Management Non-Manufacturing Business Survey Committee.
But this is anecdotal evidence only, and actual government statistics don’t reveal increased activity yet. Factory orders show manufacturing activity still rising at 5 percent, but autos and aircraft orders are down now, after surging earlier this year.


Manufacturing was once known to have high paying jobs. That's old history with pay, now at about $26.50, only 25 cents above the average. And payroll growth has also been slow with this trend also fighting to stay above zero.
“Backlogs are the bottom line and, despite all the confidence in all the private surveys, they are still under water, says Econoday. “Until unfilled orders pile up, gains for factory payrolls and wage will be limited. Despite a big jump in ISM's employment index, actual factory payrolls rose only 1,000 in Jun
So while jobs continue to be filled, wages aren’t rising in tandem, and that is another sign that there are still 6 million workers looking for jobs. Until that happens we cannot say we have reached full employment.

Harlan Green © 2017


Follow Harlan Green on Twitter: https://twitter.com/HarlanGreen

Friday, April 14, 2017

Is Happiness That Important to Americans?

Popular Economics Weekly

What a strange question to ask Americans! We are the wealthiest country in the world, right? But a recent survey claims to show that wealth accumulation is not the first priority for most of the world. In fact, the 2017 United Nation’s World Happiness Report compiled by Gallup says that Americans’ pre-occupation with wealth gets in the way of being happy.

This conclusion results from a survey of 155 countries, and shows USA is now ranked 19th in being happy, due to our national preoccupation with what money buys now, rather than in the future.

Norway is ranked number one; no surprise with its oil wealth. But, “by choosing to produce its oil slowly,” says the survey, “and investing the proceeds for the future rather than spending them in the present, Norway has insulated itself from the boom and bust cycle of many other resource-rich economies. To do this successfully requires high levels of mutual trust, shared purpose, generosity and good governance, all factors that help to keep Norway and other top countries where they are in the happiness rankings.

The USA, however, hasn’t shielded itself from boom and bust cycles. The Great Recession is just the latest in a string of recessions since 1980—two under R Reagan, one during Bush I, and two under son GW Bush. And that has led to the greatest income equality since 1929 that was the beginning of the Great Depression, and also the cause of just-ended Great Recession.

We have not been good at investing in our future, and that has led to a very low savings rate and very little put aside for retirement. This is in part because our social safety net is profoundly inadequate. We have no universal healthcare, for starters, and Republicans are threatening to repeal Obamacare, and maybe even Medicare.

This is while we have a huge public debt because Congress has refused to raise enough taxes to pay for all the spending that has supported the ongoing wars as well as tax loopholes afforded corporations, and high net-worth individuals.

Why has such record income inequality led to recessions? As Marriner Eccles, FDR’s renown Federal Reserve Chairman once said about the Great Depression: “…a giant suction pump had by 1929-30 drawn into a few hands an increasing portion of currently produced wealth. ... The other fellows could stay in the game only by borrowing. When their credit ran out, the game stopped."

Credit had again run out for most Americans in 2007 due to a failed financial system and busted housing bubble. And it is just that uncertainty that is in the way of happiness. For how can anyone be happy, unless they can count on a predictable future?
“The USA is a story of reduced happiness,” said the Gallup study. “In 2007 the USA ranked 3rd among the OECD countries; in 2016 it became 19th. The reasons are declining social support and increased corruption and it is these same factors that explain why the Nordic countries do so much better.”
And the lack of such social support has resulted in poorer health outcomes for all Americans—such as declining longevities, significantly higher disease rates, and higher infant mortality. The study lists the main factors that support happiness: caring, freedom, generosity, honesty, health, income and good governance.”
In sum, the United States offers a vivid portrait of a country that is looking for happiness “in all the wrong places,” says the study. “The country is mired in a roiling social crisis that is getting worse. Yet the dominant political discourse is all about raising the rate of economic growth. And the prescriptions for faster growth—mainly deregulation and tax cuts—are likely to exacerbate, not reduce social tensions. Almost surely, further tax cuts will increase inequality, social tensions, and the social and economic divide between those with a college degree and those without.”
America has become a less caring and generous country because of its single-minded pursuit of wealth, in other words. How to re-develop those traits that Americans have historically been noted for?

Creating a quality educational system available to all, would be a start. The share of Americans receiving a college Bachelor’s Degree or better is stuck at 36 percent when a more technically savvy workforce is needed more than ever. And the educational divide between Haves and Have-nots has been increasing, which increases the political polarization.
“Clinton won 17 of the top 18 states, while Trump won 29 of the bottom 32 states,” said Gallup. And, “The deep social and economic divisions according to educational attainment seem to be similar to the dynamics of the Brexit vote and other anti-migrant parties in Europe, which find their base among voters with lower educational attainment.”
Why is greater equality, and the concept of a safety net for all Americans taking so long to achieve when it has already been achieved in all other advanced countries and economies?
One hint: Why haven’t we elected a female president when every other major western economy has? And women, because they are used to nurturing and caring for children, are much better at planning for the future

Harlan Green © 2017


Follow Harlan Green on Twitter: https://twitter.com/HarlanGreen

Tuesday, December 27, 2016

New-Home Sales, Confidence Also At New Highs


The Mortgage Corner

Just as existing-home sales are at their cyclical highs, the Commerce Department on Friday said new home sales increased 5.2 percent to a seasonally adjusted annual rate of 592,000 units last month. That was the second highest pace since 2007, said the NAHB. Economists had forecast single-family home sales, which account for about 9.5 percent of overall home sales, rising 2.1 percent to a 575,000-unit rate last month.


The real problem is still lack of inventory with just 5.1 months of available supply (red line in graph), but builders optimism is the highest since 2005 that they can increase that inventory with a better mix of more affordable housing. Sales rose 16.5 percent from a year ago, boosted by a 43.8 percent jump in the Midwest to a nine-year high. Sales surged 7.7 percent in the West, their highest level since January 2008, but fell 3.1 percent in the South. They were unchanged in the Northeast.

“NAHB expects an increase in single-family home construction next year, fueled by a growing economy and solid job growth,” said NAHB Chief Economist Robert Dietz. “Moreover, builder confidence has risen on anticipation of reductions in regulatory costs, which is good news for home buyers and renters. However, the pace of construction will continue to be restricted by shortages of lots and labor in some markets.”

And consumers are feeling much more confident since the November elections, with most of the jump in older respondents to both the University of Michigan and Conference Board surveys. They are putting a lot of faith that Prez-elect Trump will be able to carry out his election promises of draining the Wall Street/DC swamps, in other words.

Graph Econoday

That said, the U. of Michigan consumer sentiment index edged up to a reading of 98.2 from 98 earlier this month. That was the highest reading since January 2004. And the Conference Board’s confidence index is up 12.9 points since the November election in gains driven by older consumers, as we said. The level for December is 113.7 which is the highest reading since way back in August 2001.

The University of Michigan said a record 18 percent of respondents "spontaneously mentioned the expected favorable impact of Trump's policies on the economy." Consumers anticipated that a stronger economy would create more jobs, with the share expecting higher income rising to a one-year high.

And personal incomes are rising at a 4 percent clip, the unemployment rate has dropped to 4.6 percent, and GDP growth is now up to 3.5 percent in the third revision to Q3 growth, with fourth quarter GDP growth also looking good.

So why shouldn’t consumers feel more confident of the future? It has a lot to do with Republican policies in Congress, yet Repubs say they want to repeal much of Obama’s legacy, which created the recovery from the Great Recession—the worst recession since the Great Depression. And a repeal of Obamacare and Dodd-Frank, the law that is attempting to reign in some of the excesses that caused the Great Recession, could put US back into another recession.

In other words, those voters need to be careful of what they wish for beyond the Twitters of Prez-elect Trump.

Harlan Green © 2016

Follow Harlan Green on Twitter: https://twitter.com/HarlanGreen

Monday, December 5, 2016

Why Are Consumers Happier?

Financial FAQs

Why are consumers much happier during these holidays? The University of Michigan's consumer sentiment index for November jumped 6.6 points to a six-month high while the Conference Board's consumer confidence index jumped 6.3 points to 107.1 for its best reading of the cycle, since July 2007.


It has to be in part the record-low November unemployment rate of 4.6 percent for starters, and rising wages now that minimum wages are rising in major metropolitan areas, as well as whole states like California and Washington. Econoday says the second Q3 GDP growth estimate included a sizable upgrade for consumer spending, up 7 tenths to an annualized and inflation-adjusted 2.8 percent. This is down from the second-quarter's 4.3 percent rate but the average of these two is the best in nearly two years.


It’s in the service sector that employment is growing fastest. In another sign of strength for the economy, the ISM non-manufacturing index jumped 2.4 points in November to a 57.2 reading that tops most forecasts.

Employment for the ISM survey, where growth was soft in October, shot more than 5 points higher to an outsized 58.2. Averaging recent scores for this reading puts the trend at a softer but still very respectable mid-50s rate. New orders are very strong, at 57.0, with export orders also at 57.0 in a reminder of the importance of foreign demand for the nation's service sector. Business activity is a highlight of November's report at 6l.7.

This is one reason boosting minimum wages is so important. Most jobs are being created in the lower-paying service sector, which now employs some 80 percent of workers, and has been a major reason for the tepid 2 percent growth rate average of the economy since the end of the Great Recession.

Manufacturing has been hit hardest, and there is some doubt that Prez-elect Trump will be able to fulfill his promise to bring manufacturing jobs back that were lost. So we will have to rely on the non-manufacturing industries listed below for future growth in jobs and wages.
“The 14 non-manufacturing industries reporting growth in November in the survey said Anthony Nieves, CPSM, C.P.M., CFPM, chair of the Institute for Supply Management® (ISM®) Non-Manufacturing Business Survey Committee. — listed in order — are: Agriculture, Forestry, Fishing & Hunting; Retail Trade; Arts, Entertainment & Recreation; Transportation & Warehousing; Other Services; Management of Companies & Support Services; Construction; Finance & Insurance; Professional, Scientific & Technical Services; Accommodation & Food Services; Information; Health Care & Social Assistance; Wholesale Trade; and Mining. The two industries reporting contraction in November are: Real Estate, Rental & Leasing; and Public Administration.”
That’s why economists and the Fed believe it is more important to look at the personal income and consumption expenditure figures in such as the Econoday graph above to know where future growth in incomes (and higher demand) will come from.

Harlan Green © 2016

Follow Harlan Green on Twitter: https://twitter.com/HarlanGreen

Friday, October 28, 2016

Q3 GDP Growth Fastest In 2 Years

Financial FAQs

Third quarter GDP growth was the fastest in two years, aided by a spike in soybean and other U.S. exports and a rebound in the size of inventories companies keep on hand for sale, reports the U.S. Bureau of Economic Analysis. Critics are saying this can’t last, because soybeans are not a dependable export, and inventories tend to fluctuate wildly. When exports drop below imports, the difference subtracts from growth.


The BEA said gross domestic product, the official scorecard for the economy, expanded at a 2.9 percent annual clip from July through September. That’s a marked improvement from the first half of the year when the U.S. grew just barely over 1 percent.

And mainly because of full employment and rising wages, consumers are spending again and should through the holiday season. So we should see excellent GDP growth prolonged into Q4 as well.

Personal consumption expenditures rose at a solid 2.1 percent annualized rate led by an important durables component which surged at a 9.5 percent rate (i.e., things like autos that last more than 3 years). Personal consumption was the largest contributor in the quarter, adding 1.5 percentage points to the quarter's GDP rate.

Boosted by foods and specifically soybeans, exports rose at a double-digit 10.0 percent rate, more than offsetting a 2.3 percent rise in imports—which are subtracted from exports, as I said, so that net exports added 0.8 percentage points to the quarter.

Another important positive in the report is a second straight quarter of improvement in what has been low business investment. Contributing 0.2 percentage points to GDP, so-called nonresidential fixed investment rose at a 1.2 percent rate on top of the second-quarter's 1.0 percent rate. Inventory change was also a positive in the quarter (0.6 point contribution) as were government purchases (contributing 0.1 percentage points). A negative for a second straight quarter was residential investment, falling at a 6.2 percent rate and pulling GDP down by 2 tenths.


Another number that buttresses higher growth is the Employment Cost Index, a little-known indicator that tracks actual wages and benefit costs. It shows that wages and salaries are rising again, and which means more buying power for consumers.

For the third straight quarter, employer costs rose a quarter-to-quarter 0.6 percent in the third-quarter. Component contributions shifted slightly with wages & salaries down 1 tenth to plus 0.5 percent and benefits up 2 tenths to plus 0.7 percent. Year-on-year, total costs held steady at a moderate plus 2.3 percent with wages & salaries dipping 1 tenth to 2.4 percent and benefits up 3 tenths to 2.3 percent.

This doesn’t really show higher inflation, but since employment costs are two-thirds of product costs, the Fed watches it closely for that reason. But who knows? The stock and bond markets are predicting a near-term hike in short term rates, when Fed Chair Yellen hasn’t yet indicated such hikes are imminent.

Harlan Green © 2016

Follow Harlan Green on Twitter: https://twitter.com/HarlanGreen

Tuesday, August 2, 2016

GDP Growth Still Below Average

Popular Economics Weekly

There is a reason second quarter Gross Domestic Product growth was so weak—up just 1.2 percent, after 0.9 and 0.8 percent upticks in the last 2 quarters. Pundits attributed it to the lack of capital expenditures, whereas consumer spending increased some 4.2 percent, which should mean a 3 percent annual growth rate, at least. But neither the private nor public sectors are investing much in future growth.
“The increase in real GDP in the second quarter reflected positive contributions from personal consumption expenditures (PCE) and exports that were partly offset by negative contributions from private inventory investment, nonresidential fixed investment, residential fixed investment, and state and local government spending. Imports, which are a subtraction in the calculation of GDP, decreased,” said the BEA announcement of last Friday.


Graph: Calculated Risk

Though Personal consumption expenditures (PCE) were up 4.2 percent vs. 1.6 percent in Q1, said the report, residential investment (RI) decreased at a 6.1 percent pace. Equipment investment also decreased at a 3.5 percent annualized rate, and investment in non-residential structures (i.e., commercial/industrial) decreased at a 7.9 percent pace due to the recent decline in oil prices.


It is also due to the lack of government spending. Public spending on such as infrastructure would employ millions and improve productivity, something both Presidential candidates say they want. Private sector growth should then follow, as even public works projects have to be built by private sector workers in private sector companies.

That is perhaps the major reason private sector corporations are investing less. There’s a lack of confidence in the future, what with Brexit maybe damaging future EU growth, and a certain Republican Presidential candidate threatening to blow up the US economy with massive tax cuts for the wealthiest, a trade war with the rest of the world, and no minimum wage increase.
Economist Dean Baker has said many times there is no secret to expanding employment and growth: “The point here is a simple one, we know how to get out a depression. It's called "spending money." We got out of the last Great Depression by spending lots of money on fighting World War II. But guess what, the economy doesn't care what we spend money on, it responds in the same way. So if we instead (of bailing out the banks with TARP) had spent 20 percent of GDP on building highways, housing, hospitals, and providing education and child care it also would have led to double-digit economic growth and below 3.0 percent unemployment.”
The consumer is healthy with the 4.2 percent spending increase, though consumers are saving much more these days, a result of growing incomes. Personal saving was $763.1 billion in the second quarter, compared with $847.8 billion in the first (revised). The personal saving rate -- personal saving as a percentage of disposable personal income -- was 5.5 percent in the second quarter, compared with 6.1 percent in the first, though it just dropped to 5.3 percent in this latest month.

Harlan Green © 2016

Follow Harlan Green on Twitter: https://twitter.com/HarlanGreen

Friday, April 29, 2016

Consumers Boost Q1 GDP Growth

Popular Economics Weekly

Consumer spending, largely on services, helped hold up first-quarter real GDP which came in at just 0.5 percent rate, but is still up 2 percent Year-over-Year. Consumer spending (personal consumption expenditures) rose at a 1.9 percent rate, down only 5 tenths from the fourth quarter. Most of spending was on in the service sector, which rose a respectable 2.7 percent to offset a 1.6 percent decline in durable goods (i.e., manufacturing) which were hit by weak vehicle sales.


Even durable goods ticked up slightly, as reported by the Bureau of Economic Analysis last Tuesday. The factory sector posted a respectable March with orders for durable goods up 0.8 percent which follows a revised downswing of 3.1 percent in February and a very solid 4.3 percent gain in January. This is a sign that the manufacturing sector may finally be recovering from last year’s too strong dollar (when the Fed said it was going to raise interest rates up to 4 times) which hurt exports.

Strength was mainly in defense goods which helped offset a downward swing for commercial aircraft. A negative in the report is a 3.0 percent decline for motor vehicle orders reflecting weakness at the retail level. But light vehicle sales in particular are predicted by auto industry pundits to exceed even last year’s rate of 17.5 million vehicles.

We mentioned last week that moderate wage growth, declining gasoline prices and continued low interest rates on auto loans could drive new car and light truck sales higher in 2016, according to Steven Szakaly, chief economist of the National Automobile Dealers Association, at the Los Angeles Auto Show. 
“New light-vehicle sales will rise to 17.71 million units in 2016, a 2.3 percent increase from our forecast of 17.3 million sales in 2015,” Szakaly said. “This would mark the seventh straight year of increasing U.S. new-vehicle sales.”
And, residential investment is up 14.8 percent, a highlight of the report that helped offset a sharp 5.9 percent decline in nonresidential investment where weak energy drilling is taking a big toll. Inventories rose in the quarter but at a slower rate which is a negative for GDP while exports, reflecting weak global demand.

Government purchases were a small plus in the quarter, which will rise as more infrastructure spending kicks in this spring due to the renewed $305B gas tax and surface transportation bill. Government spending is still the weak link in GDP numbers, as tax revenues are only now growing again.


And today’s Personal Income and Outlays report showed consumer spending was still weak in March, though net weakness in the quarter was tied largely to what is a positive for the consumer, lower fuel prices. Spending on non-durables (i.e., services) is a clear weakness in the report, up an unusually low 0.1 percent in the month.

But stronger consumer income is an important positive for the economic outlook, offsetting weakness in spending and stubbornly low inflation. Though the gain for wages does hint at emerging pressures, this report doesn't turn up the heat for a June rate hike, since PCE inflation is still below the Fed’s inflation target of 2 percent.

Bottom line is the Federal Reserve predicts that consumer spending will eventually pick up this year, and so retail sales, as consumers begin to spend some of the savings from lower gas and commodity prices. But if spending doesn’t pick up, the Fed may not raise interest rates further this year at all.

Harlan Green © 2016

Follow Harlan Green on Twitter: https://twitter.com/HarlanGreen
Thursday, July 16, 2015

Iran Agreement Means Low Inflation, Higher Growth

Financial FAQs

Although economists haven’t yet begun to crunch the numbers, Iran’s agreement not to produce atomic weapons or weapon-grade plutonium for at least 10 years will result in much lower oil prices, thus keeping inflation in check and interest rates at their current lows for some time to come, if not years.

This is if Congress approves the deal, of course. But lifting the economic sanctions will enable Iran to begin to sell its oil internationally sometime next year, into a world already flooded with oil products, though there is some uncertainty when this will happen.

Barron's, for instance, believes it will happen slowly, which might not affect oil prices in the short term, at least. When and if sanctions are lifted, Iran's oil production has to be ramped up, facilities upgraded, so that its products will only gradually reach international markets.

image

Graph: TradingEconomics

This is when retail inflation via the Consumer Price Index is already zero—i.e., retail prices aren’t rising at all. So it will give Janet Yellen’s Federal Reserve room to keep interest rates lower longer, thus boosting consumer spending and housing, which is beginning to show more robust growth with builder confidence at its highest level since 2005.

It will also boost consumer incomes, which are already profiting from the low interest rate environment that has reduced borrowing costs for consumers. Real (after inflation) consumer incomes are now rising at 4 percent.

image

Graph: Econoday

Wages & salaries rose 0.5 percent in the month. Both proprietors' income and rental income show especially strong gains. Spending was higher for durables, especially to autos, and also strong gains for non-durables, partly because of higher gas prices.

This in turn is boosting consumer spirits, with both the Conference Board and U. of Michigan surveys now at pre-recession levels.

image

Graph: Econoday

Optimism in the closely watched consumer sentiment report from the University of Michigan is as strong as it can get, according to Econoday. The overall index is up sharply this month and well beyond Econoday's high-end forecast. The report's expectations component, reflecting strong optimism for the jobs market, is an absolute standout at 97.8 for a 12-year high and a 13.6 point surge from May. The 13.6 point spread is the largest monthly gain since March 1991 (that's right, 1991).

There is a downside to the agreement, of course. Russia and China will benefit from doing more business with Iran, and Iran could backslide on the agreement. But there is general agreement that Iran's nuclear weapons ban will boost growth throughout developed countries with consumer-driven economies that require low inflation and cheap energy to maintain sustainable economic growth.

Harlan Green © 2015

Follow Harlan Green on Twitter: https://twitter.com/HarlanGreen

Wednesday, June 17, 2015

Housing Construction Soars

The Mortgage Corner

Housing construction is taking off, as I predicted two weeks ago. The numbers show actual construction starts accelerating as well as building permits for future construction. It is also boosting builder confidence to a level that signals continued growth in new construction.

As Econoday reported, “Don't let the headline fool you (i.e., slight drop in June), the housing starts & permits report points to solid strength for the housing sector.” Though the Calculated Risk graph shows how far the housing market is from a true recovery. It is only now returning to the lows of the 1990 recession.

image

Graph: Calculated Risk

Housing starts came in at a 1.036 million rate in May, down 11.1 percent from the April rate but the April rate, which was already one for the record books, is now revised higher to 1.165 million, a 22.1 percent gain from March. Sealing matters is another gigantic surge in permits, up 11.8 percent to 1.275 million following a 9.8 percent gain in April.

And builder confidence in the market for newly built, single-family homes in June rose five points to a level of 59, according to the National Association of Home Builders/Wells Fargo Housing Market Index (HMI). This is the highest reading since September 2014, and in fact returns the index to pre-bubble (2001-02) levels.

image

Graph: Calculated Risk

“The HMI indices measuring current and future sales expectations are at their highest levels since the last quarter of 2005, indicating a growing optimism among builders that housing will continue to strengthen in the months ahead,” said NAHB Chief Economist David Crowe. “At the same time, builders remain sensitive to consumers’ ability to buy a new home.”

All three HMI components posted healthy gains in June. The component gauging current sales conditions jumped seven points to 65, the index charting sales expectations in the next six months increased six points to 69, and the component measuring buyer traffic rose five points to 44, said the press release.

Why the huge construction increase in June? This is while mortgage rates are rising, up some 0.375 percent since their most recent lows to 3.875 percent for 0 points in origination fees for a 30-year fixed rate conforming loan. Firstly, it means consumers are confident enough in their future to begin to look for housing to support their growing families.

And this is, of course, the millennial generation aged 18 to 36 years that has already surpassed their parents’ baby boomer population size, and will exceed it by 2020, according to demographers.

image

Graph: CNBC

Also, household formation is finally returning to normal levels of 1 million plus new households being formed per year, as the so-called echo boomers move out of their parents’ homes and or leave college to make their own nests.

Household formation has been unusually low over the past seven years, averaging 577,000 new households. Whereas, there are approximately 15 million new households per decade being formed during normal times.

So, "there's a ton of people living in basements," Tommy Lee of Fundstrat Global Advisors said in an interview with CNBC's "Trading Nation." "Two quarters of pretty decent household formation isn't getting everybody out of the basement. I think this means we have multiple years where household formations are well over 1.3 million, 1.4 million."

Forecasters will be revising their second-quarter GDP estimates higher following today's report, says Econoday, not to mention their estimates for Thursday's index of leading economic indicators where permits are one of the components.

Harlan Green © 2015

Follow Harlan Green on Twitter: https://twitter.com/HarlanGreen