Showing posts with label IMF Managing Director Christine Lagarde. Show all posts

Wednesday, February 18, 2015

The Economic Ruination of Greece

Popular Economics Weekly

It is now beyond a reasonable doubt that Germany and its austerity cohorts want to drive Greece out of the Eurozone by insisting that it adhere to its agreement to pass most of its meager budget surplus to service its foreign debt, rather than invest it back into the Greek economy. It is insisting that Greece cut government spending enough so that it carries what is called a huge ‘primary’ budget surplus of 4.5 percent (a surplus before its bills are paid—ie, largely interest to its creditors).

The EU, led by Germany, had crafted several agreements that gave Greece large loans to service that debt, while forcing it to submit to severe austerity and wage cuts.

“The results have been catastrophic, said the Guardian in a 2013 article: “cumulative economic contraction approaching 25 percent, adult unemployment at nearly 30 percent, youth unemployment close to 65 percent, unprecedented poverty, destruction of the welfare state and humanitarian crisis in the urban centres. Greek debt, meanwhile, is currently higher than in 2010, standing at €321bn and, since the economy has collapsed, its ratio to GDP approaches an exorbitant 180 percent. This is the background to the current debate.”

But to do so would in effect drive Greece even further into its depression, since it means lower tax revenues, which means even more debt. The consequence is the layoff of more workers and further reduction of average household incomes. Paul Krugman put up a graph of the cutbacks in spending that in turn have made Greece’s debt burden worse, compared to other countries that agreed to the EU’s austerity terms.

image


Greece has already paid the piper, in other words, while Germany now has the largest budget surplus of all western countries. “Greece has done a lot more austerity than those countries cited as supposed success stories,” says Krugman, “(which is another issue — success being defined as “not total collapse, and slight recovery after years of horror” — but that’s a different story).”

image

Graph: Trading Economics

So Greece has little choice but to exit the euro currency, unless some last minute compromise with the EU is possible. Its unemployment rate is currently 25.8 percent, the worst in the Eurozone (slightly more than Spain’s 23.7 percent), as it has been in a deflationary spiral, further depressing its economic activity.

image

Graph: Trading Economics

Although Greece mostly lived up to the terms of the bailout, the promised growth never materialized. As Greek Prime Minister recently said: "We are not negotiating the bailout; it was cancelled by its own failure.” Calculated Risk tabulated the difference between the forecasted results of its austerity cutbacks and the actual result.

Greece: Annual GDP, Forecast and Actual

Year Promised      Actual

· 2009 -2.0            -4.4

· 2010 -4.0            -5.4

· 2011 -2.6             -8.9

· 2012 +1.1             -6.6

· 2013 +2.1             -3.9

The only choices are to allow Greece to run a smaller primary surplus (currently 1.5 percent), leaving more of its revenues to benefit its own citizens, or for Greece to leave the Eurozone and default on all their debt. What will it be?

Harlan Green © 2015

Follow Harlan Green on Twitter: https://twitter.com/HarlanGreen

Friday, September 19, 2014

Who Are the Real Takers?

Popular Economics Weekly

We have been there before. The Census Bureau reported that the poverty rate fell in 2013, the first drop since 2006. It fell to 14.5 percent, down from 15 percent in 2013, but 45.3 million people are still living at or below the poverty line, which for a family of four was $23,834.

Then who are the real "takers" that have held up economic growth and more jobs? It's can’t be the 47 percent that conservative polemicists and many of the 2012 presidential candidates maintained didn't pay federal income taxes. Three-quarters of entitlement benefits written into law in the United States go toward the elderly or disabled. That's according to the Center on Budget and Policy Priorities.

And it’s more than 90 percent of entitlement benefits when working households are included. Only about 9 percent of all entitlement benefits go toward non-elderly, non-disabled households without jobs (and much of that involves health care and unemployment insurance)

We should really be looking at those whose incomes have soared due to their success in slashing their own tax bills during difficult economic times, while blocking government job creation that would employ more of the 47 percent. The top 1 percent has taken 97 percent of income growth since the end of the Great Recession.

This is the first statistically significant decline in poverty since 2006 (and only the second since 2000). But the rate remained well above its 12.5 percent level in 2007 and even further above its 2000 level of 11.3 percent. At last year's rate of improvement, we would need to wait until 2018 for it to fall to or below the 2007 pre-recession level, and until 2020 to fall below the 2000 level, according to the Center For Budget and Policy Priorities.

Why do we have such a high poverty rate 5 years after the end of the Greatest Recession since the Great Recession? Who are the real takers that have not only created the greatest income and wealth inequality since the Great Depression that has created such dire poverty, but weakened our economy and power to maintain democratic values in the world?

FDR in his second inauguration speech said, “The test of our progress is not whether we add more to the abundance of those who have much, it is whether we provide enough for those who have too little.”

For starters, the red states controlled by Republicans have fought to downsize almost all government funded programs such as Medicare, food stamps, and Obamacare, yet they receive the largest share of government benefits, says Wallet Hub, a consumer finance blog.

For instance, South Carolina receives $7.87 for every $1 it pays in taxes. Mississippi and New Mexico, two of the most Red states, are ranked 40 out of 50 states in receiving the most in federal benefits, yet consistently vote for conservative policies that seek to limit government spending and benefits. And that includes badly needed spending on education, deteriorating infrastructure, and environmental regulation, all of which would provide more jobs in the underemployed U.S. economy.

This is an issue of our time, as we come severely weakened out of the Greatest Recession since the Great Depression. The takers are those who want it all, and the evidence is there for all to see—a weakened economy and a government lacking the powers to “stop evil and do good”.

“Nearly all of us recognize that as intricacies of human relationships increase,” said FDR in 1936 at the height of the Great Depression, “so power to govern them also must increase—power to stop evil; power to do good. The essential democracy of our nation and the safety of our people depend not upon the absence of power, but upon lodging it with those whom the people can change or continue at stated intervals through an honest and free system of elections.”

And so the real takers are also those who support ALEC, the American Legislative Exchange Council, or the Koch Brothers’ Americans for Prosperity that boilerplate legislation that has restricted voters’ rights by passing voter ID laws, restricting voting hours and anti-union collective bargaining, which are fundamental rights in any democracy.

It is mainly those conservative polemicists and presidential candidates who damn government in order to better their own financial position. And they have succeeded in lowering the maximum marginal tax rates from 92 percent during the Eisenhower presidency to its current low of 39 percent.

They have been so successful in taking from the wealth created by the many that the richest 10 percent now control some 50 percent of U.S. wealth, and most of the incomes growth since the end of the Great Recession, as we said.

Thomas Piketty, in his best-seller, Capital in the Twenty-First Century, perhaps said it best in attempting to explain why income and wealth inequality has worsened so much, brought about by lower taxation of the wealthiest.

“…the spectacular decrease in the progressivity of the income tax in the United and States and Britain since 1980, even though both countries had been among the leaders in progressive taxation after World War II, probably explains much of the increase in the very highest earned incomes,” he said.

Why lower taxation? Piketty explains it thusly. “Our finding that skyrocketing executive pay is fairly explained by the bargaining model (lower marginal tax rates encourage executives to bargain harder for higher pay) and does not have much to do with higher marginal productivity.”

There are several ways such record inequality slows growth. Firstly, growth is powered by what is called aggregate demand, the demand for goods and services that consumers, government, and investment generates. And since consumers power some 70 percent of economic activity and governments another 20 percent, when their spending declines, so does economic growth.
top-1

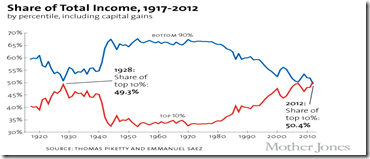
It is this record inequality that was the main cause of both the Great Depression and Recession, as declining incomes and cutbacks in government spending drastically reduced the demand for those goods and services. The years 1929 and 2010 were the years of greatest income inequality and greatest economic instability, according to Piketty and research partner Emmanuel Saez.

And economic growth has been steadily declining over the past 3 decades. It has averaged just 2 percent since the end of the Great Recession in 2009. There are numerous studies, including by the International Monetary Fund and Nobelist Joseph Stiglitz among others, that affirm the negative effect on growth of such inequality.

In fact, a recent IMF report said that “inequality can undermine progress in health and education, cause investment-reducing political and economic instability…which tends to reduce the pace and durability of growth."

So if we want to preserve our democracy, and help other countries towards greater democracy (instead of breeding more terrorism), we can no longer afford to allow the real takers to continue to take it all. The world has become too dangerous.

Harlan Green © 2014

Follow Harlan Green on Twitter: https://twitter.com/HarlanGreen

Thursday, July 3, 2014

What is Yellen’s Real Unemployment Rate?

Financial FAQs

Fed Chairwoman Janet Yellen spoke with IMF President Christine Lagard at an epoch-making conference yesterday. It was epoch-making (with luminaries such a ex-Fed Chair Paul Volcker in attendance), because Ms. Yellen told us which unemployment rate she and the Fed Governors looked at to determine when they should begin to raise interest rates.

Though payrolls have averaged 231,000 additional jobs this year, the so-called U6 unemployment rate that includes people who can only find part-time work, including those who recently gave up looking, barely improved to 12.1 percent in June from 12.2 percent.

Yellen has said several times that it was specifically the long term unemployed that she wanted back to work before the Fed would seriously begin to tighten credit. The number of long-term unemployed (those jobless for 27 weeks or more) declined by 293,000 in June to 3.1 million, said the report. These individuals accounted for 32.8 percent of the unemployed. Over the past 12 months, the number of long-term unemployed has decreased by 1.2 million.

jobs

Graph: Marketwatch

This is when today’s June unemployment report was terrific, with the rate falling to 6.1 percent from 6.3 percent, and 288,000 payrolls jobs were created. There was hiring across the board. Even governments hired 26,000 additional employees.

Professional jobs increased by 67,000, just 15 percent of which were temp positions, said the report. Retailers hired 40,200 workers and restaurants added 33,000. Health-care providers, another source of steady hiring, created 21,000 new positions. Manufacturers took on 16,000 additional workers. Even the finance industry, which has lagged in hiring since the financial panic in 2008, created 17,000 jobs in June. That’s the largest increase in 27 months.

There is one other factor that Yellen, et. al., are looking at.  Wage and salary levels aren’t increasing faster than inflation, and the average workweek was unchanged at 34.5 hours. Hours worked tend to rise when an economy strengthens, but there’s been little change for months.

Average hourly pay rose 6 cents, or 0.2 percent to $24.45 in June. Over the past 12 months, wages have risen 2 percent. But wages are rising at just two-thirds the normal rate and the recovery is unlikely to be more robust unless workers start to receive bigger paychecks.

So Yellen and the Fed Governors are saying don’t tighten credit prematurely, as FDR did in 1937, which dragged the 30’s economy back into the Great Depression. There are still too many signs of weakness, including excessive long term unemployment and insufficient demand to warrant raising interest rates, or otherwise worry about inflation.

nutting

Graph: Marketwatch

Banks and Wall Street always worry about excessive inflation, because they are the creditors, and inflation reduces the value of their debt. But that benefits consumers, as it also reduces the value of their debt, and excessive consumer debt has been the main drag in this recovery.

So we will not see a real recovery that puts even the long term unemployed back to work, until the mountain of private debt is reduced. And that can’t happen until we create employment policies that continue to create more jobs on Main Street, rather than worry about and abet the policies of Wall Street.

Harlan Green © 2014

Follow Harlan Green on Twitter: https://twitter.com/HarlanGreen

Tuesday, June 17, 2014

Why Have a Higher Minimum Wage?

Popular Economics Weekly

The International Monetary Fund just came out with a depressing prognosis for US economic growth—2 percent this year, and maybe 3 percent next year? Why? A too bad winter, slowdown in the housing market, and stagnant wages.

gdp

Graph: Trading Economics

But both housing and economic growth in general are dependent on growing incomes. So we need a higher minimum wage, for starters. Some of the richest cities are doing that. Seattle raised its minimum wage to $11 per hour. But overall household incomes aren’t rising faster than inflation, and congressional Republicans are resisting any raises, even though it would benefit the poorest states they control.

In fact, both household incomes and inflation are also rising just 2 percent per year, when they would need to rise 3 to 4 percent to boost growth and lower the unemployment rate further, currently 6.3 percent.

We only have to look to countries with a higher minimum wage to see what a difference it makes. Australia’s minimum wage is now $16.35 per hour for fully employed adults, whereas ours is still $7.25 per hour, nationally. And so Australia’s growth rate is averaging 3.5 percent per year. If we achieved that growth rate again, social security would be solvent as far as we can look into the future, say economists.

australia

Graph: Trading Economics

More evidence that higher wages stimulate growth comes from comes from many sources, including Thomas Piketty’s Capital in the Twenty-First Century, that documents 2 centuries of income and wealth transfers, and the return to historical levels of income inequality that is hurting economic growth.

And a new paper argues inequality is not only bad for those at the bottom. It is also bad for economic growth as a whole and a major reason why the recovery from the Great Recession has been so weak.

It is synopsized in a Washington Post article that attacks inequality vs. economic growth directly. Barry Z. Cynamon and Steven M. Fazzari, economists working with the Weidenbaum Center on the Economy, Government and Public Policy at Washington University in St. Louis, say that stagnant income for the “bottom 95 percent” of wage earners makes it impossible for them to consume as they did in the years before the downturn.

fredgraph

Graph: St. Louis Fed

Consumer spending which drives 70 percent of the U.S. economy, dropped sharply during the recession (gray column in graph). And while it has picked back up in the years since for the top 5 percent of wage earners — which the Census Bureau defines as households making more than $166,000 a year — “there is no evidence of a recovery whatsoever for the bottom 95 percent,” Fazzari said.

Raising the minimum wage isn’t the best answer, of course. Creating programs that promote more jobs is the best answer to boosting wages and salaries of the 95 percent. And that has to start with government that needs to replace and repair our ageing roads, bridges, and all public infrastructure, for starters.

That’s because our private sector banks and corporations are still hoarding their cash reserves, or sending them overseas. It’s more than $5 trillion at last count, and that means a real loss of wealth and jobs for those Americans that need it most.

Harlan Green © 2014

Follow Harlan Green on Twitter: https://twitter.com/HarlanGreen

Friday, September 2, 2011

Labor’s Day—Have We Forgotten What It Means?

Popular Economics Weekly

It’s officially the end of summer, start of school, fall colors, and Obama’s upcoming September 8 joint congressional State of the Jobs Market. With the labor market in dire straits, what can we say about this year’s Labor Day Holiday?

Former French Finance Minister and new IMF Managing Director Christine Lagarde gave a highly regarded speech at the Fed’s Jackson Hole conference that said in effect this was the wrong time to implement more austere, budget cutting policies with labor in such trouble. “In the United States, policymakers must strike the right balance between reducing public debt and sustaining the recovery—especially by making a serious dent in long-term unemployment,” she said.

But the latest data on record corporate profits tells us something alarming. Because of the globalization of technology, businesses know how to expand without hiring more employees—at least in this country. About 83 percent of S&P 500 companies have beat second quarter 2011 analyst estimates according to data compiled by Bloomberg News. This is while S&P recently reported that in 2010, 46.3 percent of all S&P 500 company sales originated outside of the US.

“If we look at the last 10 years, the divergence between the corporate profits of S&P 500 companies and domestic GDP growth is astonishing,” said GC Mays, an Independent / boutique research firm analyst in his Seeking Alpha blog. “Between the first Quarter of 2001 and 2006, a simple correlation showed that corporate profits explained 98.4 percent of domestic GDP growth. However, the most recent five years beginning with the first quarter of 2006 the correlation between corporate profits and domestic GDP growth breaks down as corporate profits only explain 10.1 percent of domestic GDP growth.”

clip_image002

Graph:  The Mays Report

Why is it necessary to increase jobs when we now know we can have economic growth without job growth? Well, beside the obvious voter anger if politicos don’t take the lead in creating more jobs, it means taking away the demand that can grow the domestic economy. Corporate profits have risen to the highest level as a percentage of Gross Domestic Product since the Great Depression—14 percent—but much of the profit comes from overseas’ sales of U.S. companies, as we said.

clip_image004

And that doesn’t augur well either for decreasing the record income inequality for most wage earners or growing domestic jobs. Since World War II the unemployment rate has twice reached 10 percent—during the 1981-82 and just ended 2007-09 recession. But because of the housing and financial crashes that accompanied the Great Recession—or Small Depression, as Krugman has christened it—consumers are not spending and employers not hiring domestically as they have in past recoveries.

That means corporate profits are no longer dependent on domestic demand, so are not going to help reduce the various deficits—both household and governmental—without explicit policies to create more domestic jobs. It’s a straightforward equation. Decreasing domestic unemployment means decreasing domestic deficits, and growing household incomes means growing domestic businesses. But since corporations are no longer dependent on growing domestic jobs to sell their products, what policies will? Director Lagarde says it best:

“First—the nexus of fiscal (budget) consolidation and growth. At first blush, these challenges seem contradictory. But they are actually mutually reinforcing. Credible decisions on future consolidation—involving both revenue and expenditure—create space for policies that support growth and jobs today. At the same time, growth is necessary for fiscal credibility—after all, who will believe that commitments to cut spending can survive a lengthy stagnation with prolonged high unemployment and social dissatisfaction?”

We can hope that Labor Day will be a cause for celebration; an international coming together of Big Business and dueling politicians on the need for concrete job creation policies. Make no mistake that as the public becomes better informed on the causes of the current employment malaise, they will seek out leaders who can implement the reforms necessary to correct the imbalance between growing corporate profits and declining payrolls.

“In sum,” concludes Lagarde, “risks to the global economy are rising, but there remains a path to recovery. The policy options are narrower than before but there is a way through. There are lingering uncertainties, but resolute action will help to dispel doubts.”

Harlan Green © 2011