Showing posts with label National Association of Home Builders. Show all posts

Tuesday, December 24, 2024

Will Housing Recover?

 The Mortgage Corner

Total existing-home sales[1] – completed transactions that include single-family homes, townhomes, condominiums and co-ops – improved 4.8% from October to a seasonally adjusted annual rate of 4.15 million in November. Year-over-year, sales bounced 6.1% (up from 3.91 million in November 2023).

The huge jump in existing-home sales on just a brief drop in mortgage rates illustrates the enormous pent-up demand for rental or owner-occupied housing. And Realtors believe it will continue.

“Home sales momentum is building,” said NAR Chief Economist Lawrence Yun. “More buyers have entered the market as the economy continues to add jobs, housing inventory grows compared to a year ago, and consumers get used to a new normal of mortgage rates between 6% and 7%.”

New home sales have surged as well. It may mean that builders also see an uptick in demand. Builder sentiment held steady to end the year as high home prices and mortgage rates battled renewed hope about a better regulatory business climate in 2025, reports the National Association of Home Builders (NAHB).

Builders expressed increased optimism for higher sales expectations in the next months. Sales of new single-family houses in November 2024 were at a seasonally adjusted annual rate of 664,000, up 5.9 percent above the revised October rate of 627,000 and is 8.7 percent (±19.3 percent)* above the November 2023 estimate of 611,000.

“While builders are expressing concerns that high interest rates, elevated construction costs and a lack of buildable lots continue to act as headwinds, they are also anticipating future regulatory relief in the aftermath of the election,” said NAHB Chairman Carl Harris, a custom home builder from Wichita, Kan. “This is reflected in the fact that future sales expectations have increased to a nearly three-year high.”

There is at least one elephant in the room, however. What will inflation do with Trump’s tariff and deportation threats? Consumers are already beginning to worry, per the Conference Board’s latest confidence survey.

“The recent rebound in consumer confidence was not sustained in December as the Index dropped back to the middle of the range that has prevailed over the past two years,” said Dana M. Peterson, Chief Economist at The Conference Board. “While weaker consumer assessments of the present situation and expectations contributed to the decline, the expectations component saw the sharpest drop. … Compared to last month, consumers in December were substantially less optimistic about future business conditions and incomes. Moreover, pessimism about future employment prospects returned after cautious optimism prevailed in October and November.”

So who or what will win this battle of expectations? The builders want less regulations in the hope that it can speed up the pace of construction, while tariffs have boosted construction material prices as much as 50 percent during Trump’s last term from such as his Canadian tariffs.

The Fed’s Jerome Powell has signaled that Trump’s threat to tax almost all imports will raise prices, while countries so taxed will retaliate with their own tariffs as happened during Trump’s last administration.

So builders should be careful of what they ask for. This won’t help interest rates, mortgage rates in particular, which are extremely sensitive to inflation.

Harlan Green © 2024

Follow Harlan Green on Twitter: https://twitter.com/HarlanGreen

Monday, March 25, 2024

New-Home Sales Boost Housing Market

The Mortgage Corner

The sale of new homes is boosting housing and the economy at a very opportune time—the beginning of a New Year when it’s still uncertain when the Fed will begin to cut their interest rates.

It’s a heartening sign that consumers are not waiting longer for mortgage rates to fall. So far, 30-year conventional fixed rates are staying close to their high of 7 percent, so that some one-third of sales are all cash transactions.

Sales of new single‐family houses in February 2024 were at a seasonally adjusted annual rate of 662,000, according to estimates released jointly today by the U.S. Census Bureau and the Department of Housing and Urban Development. This is 0.3 percent (±16.2 percent)* below the revised January rate of 664,000, but is 5.9 percent (±14.3 percent)* above the February 2023 estimate of 625,000.

USCensusBureau

The median sales price of a new home sold in February fell to $400,500 from $414,900 in the prior month. The seasonally‐adjusted estimate of new-home supply was 8.4 months at the current sales rate. The growing supply of new homes is bringing down prices.

Overall, home buying demand for newly built homes remains strong because resale home inventory is still low, though existing home sales are also rising.

Sales are likely to pick up further as mortgage rates are expected to decline through the rest of the year. Fannie Mae expects the 30-year mortgage to end the year at 6.4%, versus the 6.87% as of March 21, per Freddie Mac data.

This must be why builder confidence rose for the fourth month in row in March, in line with growing buyer demand.

The expectations of a jump in demand in the coming months pushed the National Association of Home Builders’ (NAHB) monthly confidence index up 3 points to 51 in March, the trade group said on Monday.

That’s also why housing starts jumped in February as well, I said last week. Construction of new U.S. homes rebounded 10.7% in February to an annual pace of 1.52 million units, reported the Commerce Department last Tuesday. Single Family Starts are up 35% Year-over-year in February; though Multi-Family Starts were down sharply, said the NAHB. That is the biggest gain in nine months.

“The solid level of single-family production in February tracks closely with rising builder sentiment, and with mortgage rates expected to moderate further this year, this will provide an added boost for single-family building,” said Carl Harris, chairman of the National Association of Home Builders (NAHB). “But policymakers need to help the industry's supply-chains in order to protect housing affordability and add much needed supply to boost inventory.”

Might a proposed settlement by the National Association of Realtors (NAR) to bring down the standard commission paid by Sellers speed up home sales this year by reducing sale costs?

The settlement proposed by the National Association of Realtors, which will go into effect in mid-July if it’s approved, would require that listings on the NAR-run Multiple Listing Service — a database of homes for sale — no longer have a field showing how much buyer’s agents will earn in commissions on the sale.

Although fees for real-estate agents are technically negotiable, they typically run from 4% to 6% of a home’s sale price, depending on local market customs. Home sellers traditionally pay these commissions, which are then typically split between the buyer’s and seller’s agents.

This might make a difference in prices for entry-level homes, where the profit margins are lower, and buyers more price-conscious. Anything that reduces costs is welcome in a reviving housing market.

New-home construction and sales are an important segment of our economy because they employ many in sectors other than construction, such as finance, insurance, and advertising. So when positive and growing it boosts overall economic growth.

Harlan Green © 2024

Follow Harlan Green on Twitter: https://twitter.com/HarlanGreen 

Thursday, April 20, 2017

Record Low Interest Rates Boost Housing

The Mortgage Corner

The conforming 30-year fixed rate mortgage is now 3.50 percent and the so-called Hi-Balance conforming 30-year fixed rate is 3.75 percent for a 1 percent origination fee in California. And this is what has kept the demand for housing on a tear, in spite of tepid economic growth, with GDP growth still stuck at 2 percent per the Philly Fed Index seen below.

Why? It’s mainly because there is still very little inflation, and the bond market that determines mortgage rates likes low inflation. The low inflation rate may be because there’s still doubt on what growth-inducing legislation may ever get through a weak President and Congress stuck in ideological warfare. So we could see builders’ record profits continue for the rest of this year, and maybe more affordable housing.

Both new-home construction and builder optimism are at post-recession highs, but with normal seasonal fluctuations (such as mid-March Northeast blizzard), says the National Association of Home Builders (NAHB).

Following an elevated February reading, nationwide housing starts fell 6.8 percent in March to a seasonally adjusted annual rate of 1.22 million units, according to the U.S. HUD and the Commerce Department. Still, new housing production in the first quarter of this year is running 8.1 percent above the pace in 2016, reports the NAHB.


This is why builder confidence in the market for newly-built single-family homes remained solid in April, falling three points to a level of 68 on the National Association of Home Builders/Wells Fargo Housing Market Index (HMI) after an unusually high March reading, said the NAHB.
”The fact that current sales conditions has been over 70 for five consecutive months shows that there is continued demand for new construction,” said NAHB Chief Economist Robert Dietz. “However, builders are facing several challenges, such as hefty regulatory costs and ongoing increases in building material prices." 
The building industry is doing its share to boost growth as it continues to add jobs, with monthly employment data for February showing that home builder and remodeler employment increased by 18,900. Over the last 12 months, home builders and remodelers have added 136,000 jobs on a net basis and residential construction employment now stands at 2.707 million.


And where is US manufacturing activity these days? It’s still increasing in most states. The Philadelphia Federal Reserve has released the coincident indexes for the 50 states for February 2017. Over the past three months, the indexes increased in 47 states (green states), decreased in two, and remained stable in one (Michigan), for a three-month diffusion index of 90. In the past month, the indexes increased in 44 states, decreased in four, and remained stable in two, for a one-month diffusion index of 80.
“Here is a map of the three month change in the Philly Fed state coincident indicators. This map was all red during the worst of the recession, and almost all green now,” says Calculated Risk’s Bill McBride.
So, economic growth continues into the eighth year of this business cycle. And housing is usually a leading indicator of future growth, but that will depend on what looks like lower interest rates, future (lower) inflation trends, actions of the Federal Reserve, and Congress, of course.

Harlan Green © 2017

Follow Harlan Green on Twitter: https://twitter.com/HarlanGreen

Friday, June 17, 2016

Builder Optimism Returning to Historical Levels

The Mortgage Corner

After holding steady for the past four months, builder confidence in the market for newly constructed single-family homes rose two points in June to a level of 60 on the National Association of Home Builders/Wells Fargo Housing Market Index (HMI). This is the highest reading since January 2016.

And it’s for an obvious reason, as the just released privately-owned housing starts in May were at a seasonally adjusted annual rate of 1,164,000. This is 0.3 percent below the revised April estimate of 1,167,000, but is 9.5 percent above the May 2015 rate of 1,063,000. But mostly large, expensive homes are being built to date, which is hurting affordability.

“Rising home sales, an improving economy and the fact that the HMI gauge measuring future sales expectations is running at an eight-month high are all positive factors indicating that the housing market should continue to move forward in the second half of 2016,” said NAHB Chief Economist Robert Dietz.
In fact, the HMI builder optimism index is returning to a range that prevailed from 1970s to early 2000, in the run up to the housing bubble. It means that 60 percent of the builders surveyed are seeing increased business activity.


But what kind of activity? Mostly larger, even very large homes are being built, rather than the more traditional 16-1800 sf single family homes of yore. Of the estimated 648,000 single-family homes completed last year, just 136,000, or 21 percent, were homes with square footage of less than 1,800.

The number of “moderately-sized” single-family homes completed in 2015 was little changed from 2011, when overall single-family home completions hit at a “record” low. In contrast, the number of homes with 3,000 or more square feet of floor area last year was up 76 percent from 2011’s level.

This is obviously a problem for younger, first-time buyers entering the housing market. Sales of new single-family houses in April 2016 were at a seasonally adjusted annual rate of 619,000, according to estimates released jointly today by the U.S. Census Bureau and the Department of Housing and Urban Development. This is 16.6 percent (±15.4%) above the revised March rate of 531,000 and is 23.8 percent (±22.8%) above the April 2015 estimate of 500,000, said the Census Bureau.

The result has been that there is a severe shortage of affordable new housing, driving prices higher. The median sales price of new houses sold in April 2016 was $321,100; the average sales price was $379,800. The seasonally adjusted estimate of new houses for sale at the end of April was 243,000. This represents a supply of 4.7 months at the current sales rate, below the normal 5-6 month supply.

So if builders’ optimism holds we can be sure that new-home construction and sales will provide more homes for buyers—maybe even affordable homes if current construction levels hold.

The Fed has to cooperate by holding interest rates low, of course, but St. Louis Fed President James Bullard said on Friday the current economic trend of tepid 2 percent growth, coupled with a low unemployment rate and quiet inflation are likely to persist and, as a result, the U.S. central bank can sit on its hands.

Harlan Green © 2016

Follow Harlan Green on Twitter: https://twitter.com/HarlanGreen

Thursday, March 24, 2016

Where Are the New Homes?

Sales of newly built, single-family homes rose 2 percent in February from an upwardly revised January reading to a seasonally adjusted annual rate of 512,000 units, according to newly released data by the U.S. Department of Housing and Urban Development and the U.S. Census Bureau.

It shows progress in badly needed housing inventory, but new-home sales are still far below the 50-year average, which means there is still a tremendous amount of pent up demand for housing in the 7th year of this economic recovery that is reflected in escalating rents and housing prices. And developers are only now beginning to get it.
“This reflects a slow but steady increase in demand from homebuyers as well as increasing confidence of homebuilders,” said Trulia Chief Economist Ralph McLaughlin. “It is also a positive sign for the U.S. economy headed into 2016, as new home sales leads to new construction and consumer demand for housing-related goods and services. Despite the positive news, new home sales remain still remain about 24 percent below the 50-year average.”


Where is the shortage? It is mostly in the lower-priced brackets that most home buyers can afford.

From housing economist Tom Lawler, per Calculated Risk:  “While single-family housing production has continued to recover, the overall level of production – in terms of units – has been well short of consensus forecasts from a few years ago. In looking at the production “shortfall,” the one thing that is striking is that production of moderately sized homes has barely recovered from the cyclical lows, while production of big homes (3000+ square feet) has been running at a higher pace that in all but one year of the 1990’s, as the above graph illustrates.

This makes very little sense if builders are to meet the housing need, as 80 percent of the employed are wage and salary earners and the U.S. median household income is barely above $60,000 per year these days. That is, household incomes are finally returning to early 2000, pre-recession levels. Such a median income can buy a home worth approximately $400,000 with 10 percent down at today’s very low conforming fixed rates (still less than 4 percent).

Yet hardly any homes with 1600 square foot or less areas are being built that can be sold in moderate price ranges. Builders maintain it is because of labor and land shortages, but banks have been very slow to grant development or acquisition financing, which is the credit developers need to even acquire the land for development.


However builders remain ever optimistic in this new year. "While builders contend with industry headwinds such as labor shortages, relatively low mortgage interest rates and solid job growth should keep the housing market moving ahead as we enter the spring buying season," said NAHB Chief Economist Robert Dietz.

The inventory of new homes for sale was 240,000 in February, which is a 5.6-month supply at the current sales pace (still slow). The median sales price of new houses sold in February was $301,400. Regionally, new home sales rose 38.5 percent in the West. (But) Sales dropped 4.1 percent in the South, 17.9 percent in the Midwest and 24.2 percent in the Northeast.

Does this mean builders and banks will realize they have to build for the middle class as well as the wealthiest that can afford those 3,000 sf homes, if they want to grow the housing market?

Harlan Green © 2016

Follow Harlan Green on Twitter: https://twitter.com/HarlanGreen

Wednesday, March 16, 2016

Builder Confidence Holds, Housing Starts Booming


Builder confidence in the market for newly-built single-family homes was unchanged in March at a level of 58 on the National Association of Home Builders/Wells Fargo Housing Market Index (HMI).“Confidence levels are hovering above the 50-point mid-range, indicating that the single-family market continues to make slow but steady progress,” said NAHB Chairman Ed Brady.  
And Housing Starts rose 5.2 percent in February to 1,178,000 units and is 30.9 percent above the February 2015 rate of 900,000, confirming builder’s increased confidence.  Single family construction was 7.2 percent higher than January.
“While builder sentiment has been relatively flat for the last few months, the March HMI reading correlates with NAHB’s forecast of a steady firming of the single-family sector in 2016,” said NAHB Chief Economist David Crowe. “Solid job growth, low mortgage rates and improving mortgage availability will help keep the housing market on a gradual upward trajectory in the coming months.”
Solid job growth is being helped by those of working age returning to the jobs market. This month, more than 4.5 million people who weren’t in the labor force found a job, according to the St. Louis Federal Reserve, even though only about 7.7 million Americans were officially unemployed the previous month. Just since December, the U.S. economy has added more than 1 million jobs and brought more than 1.5 million Americans into the labor force (based on the household survey).


            The labor force — which includes all adults over 16 who have jobs and as well as those are who actively looking for work — has increased by 2 million in the past year, the biggest 12-month gain since before the recession began in 2007, writes Marketwatch’s Rex Nutting.
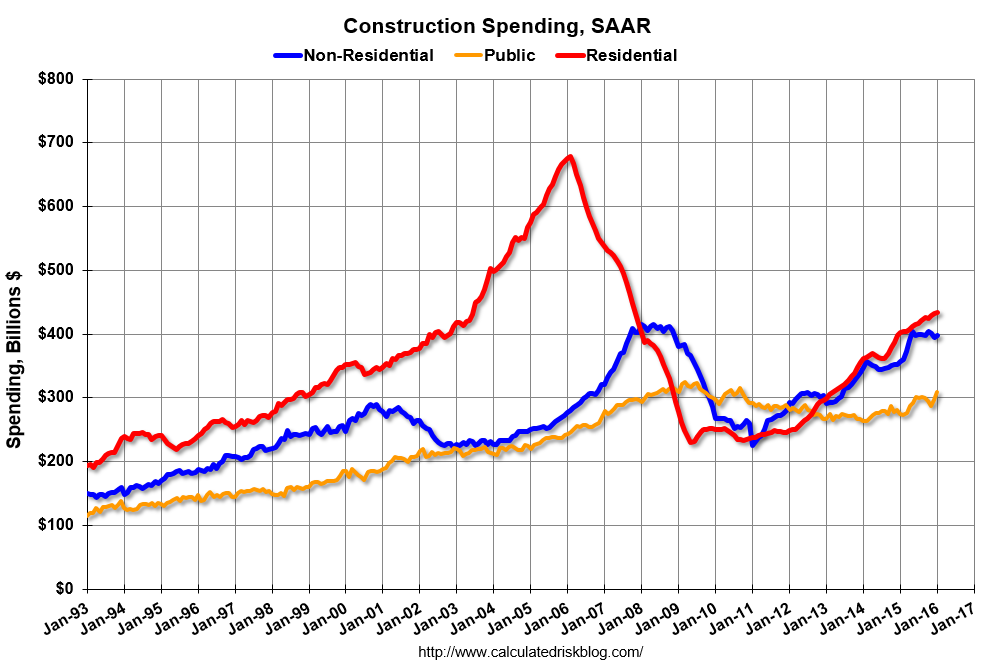
            This is giving a tremendous boost to new-home construction, in particular. It is why the U.S. Census Bureau reported that construction spending during January 2016 was estimated at a seasonally adjusted annual rate of $1,140.8 billion, 1.5 percent above the revised December estimate of $1,123.5 billion. And the January figure is 10.4 percent above the January 2015 estimate of $1,033.3 billion.


On a year-over-year basis, private residential construction spending is up 8 percent. Non-residential spending is up 11 percent year-over-year. Public spending is up 13 percent year-over-year.  Looking forward, all categories of construction spending should increase in 2016. Residential spending is still very low, non-residential is increasing (except oil and gas), and public spending is also increasing after several years of austerity.
In the meantime, the number of people who have jobs has increased by 2.8 million. The strength of those numbers is startling once you consider that the population of working-age people (ages 16 to 65) has grown by only a million in the past year, says Nutting. The number of employed people is growing about three times as fast as the number of working-age adults. This means that the slack in the economy is disappearing quickly (but it’s not gone yet).
            The point of this is that with so many workers returning to the jobs market, a strong housing recovery is assured.  For it is working age Americans that want most to own a home, according to a recent National Association of Realtors survey.

Harlan Green © 2016

Follow Harlan Green on Twitter: https://twitter.com/HarlanGreen

Wednesday, May 13, 2015

2015 Housing Construction Will Surge

The Mortgage Corner

We believe housing construction is about to bloom this spring, due to growing employment. For starters, an additional 45,000 construction jobs were added to nonfarm payrolls in April. This is even though construction spending to date has been flat, according to the Commerce Department. The U.S. Census Bureau of the Department of Commerce announced that construction spending during March 2015 was estimated at a seasonally adjusted annual rate of $966.6 billion, 0.6 percent below the revised February estimate of $972.9 billion. But the March figure is 2.0 percent above the March 2014 estimate of $947.3 billion.

And sales of new single-family houses in March 2015 were at a seasonally adjusted annual rate of 481,000, according to estimates by the U.S. Census Bureau and the Department of Housing and Urban Development, which is slow because of winter weather, but it is still 19.4 percent above last year’s March 2014 estimate of 403,000.

And, housing units authorized by building permits in March were at a seasonally adjusted annual rate of 1,039,000, 5.7 percent below the revised February rate of 1,102,000, but is 2.9 percent above the March 2014 estimate of 1,010,000, signaling more construction ahead. And the single-family component is up 4.4 percent from February, which is double the multi-family component. Single family construction employs many more workers per unit.

This is while overall employment could be returning to pre-recession levels, as we said last week. The U.S. churned out 223,000 new jobs in April, and the unemployment rate slid to 5.4 percent from 5.5 percent, which means the US economy’s deep freeze was temporary. It was a short hibernation, in a word, but we are still not out of the Great Recession woods, as we said last week.

image

Graph: Marketwatch

The Small Business Optimism Index also increased 1.7 points from March to 96.9, reports the NFIB, with the employment component especially strong. Small business does 50 percent of all hiring, so this is another sign of a healthy jobs market. Twenty-seven percent of all owners reported job openings they could not fill in the current period, up 3 points from March. And a net 11 percent plan to create new jobs, up 1 point and a solid reading.

image

Graph: Calculated Risk

Lastly, the Labor Department’s most recent JOLTS report showed 5 million job openings, and a higher Quits rate, meaning more workers were able to quit their current job to find a better position. Quits are up 14 percent year-over-year. These are voluntary separations, as we said (see light blue columns at bottom of graph for trend for "quits"), and the number of job openings are up 19 percent YoY, which is another sign of a robust jobs market.

The bottom line is housing construction should begin to expand in the spring and summer. This will ultimately relieve the problem of lack of inventory, and should help first time homebuyers by relieving price pressures that have been increasing as housing stocks have declined.

Harlan Green © 2015

Follow Harlan Green on Twitter: https://twitter.com/HarlanGreen

Tuesday, October 28, 2014

Pending and New-Home Sales Looking Up

The Mortgage Corner

Sales of new single-family houses are barely budging from their recession lows. But pending home sales for September nudged up to the highest this year, which is a sign that record low interest rates are bringing buyers back into the market.

Pending sales rose slightly in September and are now above year-over-year levels for the first time in 11 months, according to the National Association of Realtors.

The Pending Home Sales Index inched 0.3 percent to 105.0 in September from 104.7 in August, and is now 1.0 percent higher than September 2013 (104.0). The index is above 100 for the fifth consecutive month and is at the second-highest level since last September, reports the National Association of Realtors.

Lawrence Yun, NAR chief economist, says moderating price growth and sustained inventory levels are keeping conditions favorable for buyers. “Housing supply for existing homes was up in September 6 percent from a year ago, which is preventing prices from rising at the accelerated clip seen earlier this year,” he said. “Additionally, the current spectacularly low mortgage rates should help more buyers reach the market.”

Despite improved housing conditions and low interest rates (as low as 3.625 percent for the conforming 30-yr fixed rate today), tight credit conditions continue to be a barrier for some buyers. Of the reasons for not closing a sale, about 15 percent of Realtors in September reported having clients who could not obtain financing as the reason for not closing.

Yun says the final rule on Qualified Residential Mortgages should improve access to credit once it goes into effect next year. “The rule provides clarity for lenders and is a win for creditworthy consumers by ensuring they continue to have access to safe and affordable loan products without overly burdensome down payment requirements,” he said.

And Mel Watt, the newly appointed Director of FHFA that oversees Fannie Mae and Freddie Mac just announced he would be easing credit standards for the largest guarantors of residential mortgages.

But it is a two-edged sword, according to pundits. Watt said that Fannie and Freddie are working to develop “sensible and responsible” guidelines that will allow them to buy mortgages with down payments as low as 3 percent, instead of the 5 percent minimum that both institutions currently require. But lenders will not have to retain earnings to cover any losses, which means they could again begin to offer subprime mortgages (but that are not sold to Fannie or Freddie).

This change would apply to a “targeted segment of creditworthy borrowers” and take into account “compensating factors,” Watt said. (Housing experts speculate that maybe the lower down payments would only be offered to first-time buyers.) More details to come in the weeks ahead, Watt added.

But these provisions should boost sales to first time homebuyers, in particular who might not be able to afford larger down payments.

new sales

Graph:Calculated Risk

Sales of newly built, single-family homes inched up 0.2 percent in September to a seasonally adjusted annual rate of 467,000 units, the highest level in six years. Sales numbers for August were revised down from 504,000 to 466,000.

“Three consecutive months of sales upticks demonstrate steady growth in the housing market,” said Kevin Kelly, chairman of the National Association of Home Builders (NAHB). “Consistent job creation and low mortgage interest rates are spurring the release of pent-up consumer demand.”

So new-home sales have to improve, as well, to enlarge the housing inventory. Right now, most of housing construction is now multi-family dwellings to absorb the increasing demand for rental housing.

Harlan Green © 2014

Follow Harlan Green on Twitter: https://twitter.com/HarlanGreen

Thursday, April 17, 2014

New-Home Sales Answer to RE Recovery?

The Mortgage Corner

Privately-owned housing starts in March were at a seasonally adjusted annual rate of 946,000. This is 2.8 percent above the revised February estimate of 920,000, but is 5.9 percent below the March 2013 rate of 1,005,000. Single-family housing starts in March were at a rate of 635,000; this is 6.0 percent above the revised February figure of 599,000.

We can see from the initial 2008 chart date that multifamily construction (red line) is back to pre-recession levels, but single-family starts are at 75 percent of pre-recession levels (blue line).  This mirrors the surging demand for more rental housing, which still boosts overall growth.

“We see improving signs of new-home construction as we move into the spring buying season,” said Kevin Kelly, chairman of the National Association of Home Builders (NAHB).  “The strongest recovery is in the Northeast and Midwest, where builders were hampered by severe winter weather earlier in the year.”

“Today’s report is in line with our forecast of a gradual strengthening in the housing sector in 2014,” said NAHB Chief Economist David Crowe. “However, several uncertainties including tight credit conditions for home buyers and erratic job growth are making builders cautious about getting ahead of demand.”

Single-family construction is the better barometer for home sales, since it also boosts, building design, insurance and mortgage activity, and so economic growth. And it is picking up in the spring thaw. Multifamily starts fell 6.1 percent to 292,000 units.

clip_image002

Graph: Calculated Risk

Lower mortgage rates are helping, as refinance mortgage applications jumped 7 percent, and purchase applications are up 1 percent in the latest MBA applications survey. It’s because the 30-yr conforming fixed rate has again dipped to as low as 3.875 percent for 1 origination point in California.

clip_image004

Graph: Calculated Risk

But applications are still at post-recession lows. They have returned to 1997-98 levels, and have dropped from early 2013 levels when fixed mortgage interest rates were in the 3 percent range. It seems that QE3 did bring down interest rates sufficiently to help the housing recovery, but now applications are stuck at the low level as QE3 is being ‘tapered’. The Fed is predicted to end QE3 purchases by the end of 2014.

That leaves uncertainty about the direction interest rates into the fall and winter.  They have recently plunged because of uncertainty over the confrontation in the Ukraine, and how much sanctions might damage economic activity.  The US is saying it can’t hurt domestic growth, and the IMF has predicted a pickup in worldwide growth, but what if Putin decides to invade the Ukraine?

Then all bets are off.  But at the very least it would keep interest rates at the current low level, and so help the housing market, in particular.  It also means middle income consumers still lack the means to boost their housing purchases when rates are much higher.

Harlan Green © 2014

Follow Harlan Green on Twitter: https://twitter.com/HarlanGreen

Monday, November 18, 2013

Is Builder Optimism, New Home Construction Faltering?

The Mortgage Corner

Will new-home construction falter, now that interest rates are rising and consumers remain unsettled over Washington’s political gridlock that prevents any legislation being passed that would aid economic growth?

Builder confidence in the market for newly built, single-family homes was unchanged in November from a downwardly revised level of 54, reported the National Association of Home Builders/Wells Fargo Housing Market Index (HMI). This means that for the sixth consecutive month, more builders have viewed market conditions as good than poor, since any index value above 50 percent, means a majority of builders report growing activity. But that hasn’t spurred more new-home construction, which is stuck at early spring levels.

image

Graph: Calculated Risk

“Given the current interest rate and pricing environment, consumers continue to show interest in purchasing new homes, but are holding back because Congress keeps pushing critical decisions on budget, tax and government spending issues down the road,” said NAHB Chairman Rick Judson. “Meanwhile, builders continue to face challenges related to rising construction costs and low appraisals.”

“Policy and economic uncertainty is undermining consumer confidence,” said NAHB Chief Economist David Crowe. “The fact that builder confidence remains above 50 is an encouraging sign, considering the unresolved debt and federal budget issues cause builders and consumers to remain on the sideline.”

New-home construction has basically stalled since April and the beginning of interest rates increases due to the Fed’s hints that QE3 could end. This will hurt economic growth and employment, since new-home construction makes up a large part of economic growth these days, with other growth components are being constrained by lower government and consumer spending.

image

Graph: Calculated Risk

There has been a significant increase in new home sales this year.  Sales of new single-family houses in August 2013 were at a seasonally adjusted annual rate of 421,000, according to estimates by the U.S. Census Bureau and the Department of Housing and Urban Development. This is 7.9 percent above the revised July rate of 390,000 and is 12.6 percent above the August 2012 estimate of 374,000
Read more at

Though year-over-year increases have slowed - August only saw a year-over-year increase of 12.6 percent, but Calculated Risk’s Bill McBride still expects new home sales to be up 15 percent to 20 percent for the year.  That follows an annual increase of 21 percent in 2012.

The seasonally adjusted estimate of new houses for sale at the end of August was 175,000. This represents a supply of 5.0 months at the current sales rate. It means that new home construction has not taken up the slack in supply, and might slow new-home sales.

The initial third Quarter GDP growth was 2.8 percent, up from 2.5 percent in Q2. And residential real estate activity was a large part of that increase. So we will need more new-home construction to keep growth at that level.

Harlan Green © 2013

Follow Harlan Green on Twitter: www.twitter.com/HarlanGreen

Wednesday, March 20, 2013

Spring Housing Inventories Too Low

The Mortgage Corner

The spring home buying season is already here, reports Realtor.com. In February, the total number of single-family homes, condos, townhomes and co-ops for sale in the U.S. (1,494,218) increased by 1.15 percent month-over-month. On an annual basis, however, inventory was down by 15.97 percent.

"As we enter the busiest time of the year for home buyers and sellers, our latest housing trend data shows just how competitive the market is with a significant national housing recovery well underway," said Steve Berkowitz, chief executive officer of parent company Move, Inc. "Looking ahead, we can expect the amount of inventory to increase this spring along with higher list prices as sellers become more comfortable with the market conditions."

clip_image002

Graph: Calculated Risk

Nearly all of the markets with the largest year-over-year declines in February for sale inventories were in California, where declines averaged 48 percent. The list includes Sacramento, Stockton, Oakland, San Jose, Orange County, Los Angeles, Seattle, San Francisco, Riverside and Ventura. These markets also experienced a dramatic decline in the median age of inventory, falling to an average of just 31 days, or 53 percent lower than it was one year ago.

clip_image004

Graph: DataQuick

The result is sharply rising prices. Six-county Southern California saw the February median home price rise nearly 21 percent over the year, while remaining essentially flat compared with January, said real estate information provider DataQuick last week.

That is the main reason February housing construction soared. Privately-owned housing starts in February were at a seasonally adjusted annual rate of 917,000. This is 0.8 percent above the revised January estimate of 910,000 and is 27.7 percent above the February 2012 rate of 718,000, according to the National Association of Home Builders.

clip_image006

Graph: Calculated Risk

Single-family starts (blue) increased to 618,000 thousand in February and are at the highest level since June 2008. “Today’s report indicates that, despite some bumps in the road, overall housing production continues on the solid upward trend that we saw throughout 2012,” noted NAHB Chief Economist David Crowe. “Moreover, further gains in permit issuance are a positive sign that home construction will continue to drive economic and job growth in the coming months, albeit at a slower pace than would be possible without certain limiting factors.”

Gary Wood’s Santa Barbara MLS listings plunged 18.7 percent in February for South Coast, while the median price soared $100,000, from $842,490 to $935,000. The lower-priced inventories are disappearing, in other words. Year over year sales are up about 15 percent with the median sales price up at about the same rate to roughly $890,000.

The lack of lower-priced inventory is apparent with the average sales price way up, going from just over $1 million in 2012 to approximately $1.5 million in 2013. The numbers of escrows are also up about 15 percent with the median list price on those escrows up almost 20 percent. That is putting even more pressure on prices. Through the end of February sales and prices for both the Home Estate/PUD and Condo markets are up with about 35 percent of the homes going for over the asking price and about 15 percent of the condos also selling for over list prices.

Harlan Green © 2013

Follow Harlan Green on Twitter: www.twitter.com/HarlanGreen

Thursday, February 21, 2013

Housing Affordability Up, Inventories Still Shrinking

The Mortgage Corner

The National Association of Home Builders (NAHB) reported exceptionally low interest rates helped ensure a slight gain in nationwide housing affordability amid relatively stable house prices in the final quarter of 2012, according to the just released National Association of Home Builders/Wells Fargo Housing Opportunity Index (HOI).

In all, 74.9 percent of homes sold between the beginning of October and end of December were affordable to families earning the U.S. median income of $65,000. This was up nearly a percentage point from the 74.1 percent of homes sold that were affordable to median-income earners in last year’s third quarter.

Interest rates have risen about one-quarter percent from their recent lows, to average 3.50 percent for 30-year fixed rate conforming loan amounts in California with zero points origination fees. Even so-called High-Balance 30-year fixed conforming amounts are averaging 3.75 percent with zero points origination fees, still phenomenally low, thanks to the Federal Reserve’s QE buying programs.

“The most recent housing affordability data should be encouraging to many prospective home buyers, because it shows that homeownership remains within reach of median-income consumers even as most local markets appear to be on a recovery path,” said NAHB Chairman Rick Judson.  He noted that the most recent reading of the NAHB/First American Improving Markets Index found that 259 out of 361 metros currently qualify as improving, including representatives from all 50 states and the District of Columbia.

This is while Total existing-home sales, which are completed transactions that include single-family homes, townhomes, condominiums and co-ops, increased to a seasonally adjusted annual rate of 4.92 million in January from a downwardly revised 4.90 million in December, and are 9.1 percent above the 4.51 million-unit pace in January 2012. The graph shows sales’ levels are almost back to 2000 levels, the beginning of the fastest rise in housing prices.

image

Graph: Calculated Risk

NAR chief economist Lawrence Yun said tight inventory is a major factor in the market. "Buyer traffic is continuing to pick up, while seller traffic is holding steady," he said. "In fact, buyer traffic is 40 percent above a year ago, so there is plenty of demand but insufficient inventory to improve sales more strongly. We've transitioned into a seller's market in much of the country."

Total housing inventory at the end of January fell 4.9 percent to 1.74 million existing homes available for sale, which represents a 4.2-month supply at the current sales pace, down from 4.5 months in December, and is the lowest housing supply since April 2005 when it was also 4.2 months, but also close to 2000 levels.

image

Graph: Calculated Risk

Listed inventory is 25.3 percent below a year ago when there was a 6.2-month supply. Raw unsold inventory is at the lowest level since December 1999 when there were 1.71 million homes on the market.

"We expect a seasonal rise of inventory this spring, but it may be insufficient to avoid more frequent incidences of multiple bidding and faster-than-normal price growth," said Yun.

The question yet to be answered is whether the declining prices of foreclosure sales discussed in my last blog will increase the housing supply in months to come.

Harlan Green © 2013

Follow Harlan Green on Twitter: www.twitter.com/HarlanGreen

Tuesday, January 29, 2013

Dr. Robert Shiller Says No Housing Boom

The Mortgage Corner

Dr. Robert Shiller, Yale Econ Professor, and co-creator of the Case-Shiller Home Price Index, has become very cautious in his latest articles. Don’t expect much in the way of a housing boom in 2013. He isn’t even sure even prices will continue to rise as they have over the past 3 years given all the headwinds, such as tighter mortgage regulations, a declining percentage of homeowners versus renters, and low consumer expectations in general.

This is in spite of the fact that home sales are up some 5 percent, and his own price index is 5.5 percent higher in one year, for the strongest year-over-year growth since August 2006 with increases in 19 of 20 cities..

“On the one hand, there were sharp price increases in 2012, with the S.&P./Case-Shiller 20-City Index, said Dr. Shiller, “which I helped devise, up a total of 9 percent over the six months from March to September. That comes after what was generally a decline in prices for five consecutive years. And while prices dropped very slightly in October, the trend was quite encouraging for the market.”

“But some of these changes were seasonal,” he continues. “Home prices have tended to rise every midyear and to fall slightly every fall and winter. And for some unknown reason, seasonal effects have become more pronounced since the financial crisis.”

Yet he cites a consensus of some 100 economists that real prices will rise 1 to 2 percent over inflation in coming years. Folks, that is the historical norm for housing prices in the 20th century that Dr. Shiller himself cites in his second edition of Irrational Exuberance.

Why so much pessimism from the Oracle who actually coined the term ‘irrational exuberance’ that Fed Chairman Greenspan used in his famous speech so many years ago?

image

Graph: Calculated Risk

I believe he is neglecting what is behind the current surge in home buying—pent up demand, and record low interest rates that the Fed has vowed to keep low until the unemployment rate falls to the 6 percent range from the current 7.8 percent. Pent up demand is a powerful driver of home building, for one thing. And household formation is predicted to double to some 1.3 million per year in coming years from a low as 350,000 annually during the Great Recession.

That, and real interest rates make homes the most affordable in history, according to the National Association of Realtors. While this won’t bring us back to boom times, it will at least restore housing to its proper place in the economy.

Even though national existing-home sales declined 1.0 percent to a seasonally adjusted annual rate of 4.94 million in December from a downwardly revised 4.99 million in November, sales are 12.8 percent above the 4.38 million-unit level in December 2011, says the National Association of Realtors.

image

Graph: Calculated Risk

The result is total housing inventory at the end of December fell 8.5 percent to 1.82 million existing homes available for sale, which represents a 4.4-month supply at the current sales pace, down from 4.8 months in November, and is the lowest housing supply since May of 2005.

This means new-home construction will have to pick up to satisfy the increasing demand for housing, as we have said in past weeks. And the outlook is good, with privately-owned housing starts in December at a seasonally adjusted annual rate of 954,000. This is 12.1 percent above the revised November estimate of 851,000 and is 36.9 percent above the December 2011 rate of 697,000, according to the US Census Bureau.

image

Graph: Econoday

On a year-over-year basis, private residential construction spending is now up 19 percent. Non-residential spending is up 8 percent year-over-year mostly due to energy spending says Calculated Risk. Public spending is down 3 percent year-over-year, and that is the real problem. Governments should be spending much more on public infrastructure, when and if the economy returns to more normal growth.

Hence we do not share Dr. Shiller’s uncertainty about the direction of home prices. Extremely tight housing inventories mean demand has picked up substantially. It all might depend on one’s definition of a housing ‘boom’. No one expects a return to the bubble years when consumers borrowed more than they earned. Maybe it’s a relief just to return to a more normal housing market?

Harlan Green © 2013

Follow Harlan Green on Twitter: www.twitter.com/HarlanGreen

Tuesday, January 22, 2013

Existing-Homes Inventory at Record Lows

The Mortgage Corner

The housing market is recovering with the highest sales and price rises since 2007. Only problem is that inventory is also at the lowest level since 2007, with just 4.4 month’s supply of housing on the market. We haven’t seen this low a level since early 2000.

The result is that housing prices are predicted to rise some 5.6 percent this year, and housing construction to top 1 million units for the first time in 5 to 6 years.

image

Graph: Calculated Risk

Total national existing-home sales, which are completed transactions that include single-family homes, townhomes, condominiums and co-ops, declined 1.0 percent to a seasonally adjusted annual rate of 4.94 million in December from a downwardly revised 4.99 million in November, but are 12.8 percent above the 4.38 million-unit level in December 2011, says the National Association of Realtors.

image

Graph: Calculated Risk

The preliminary annual total for existing-home sales in 2012 was 4.65 million, up 9.2 percent from 4.26 million in 2011. It was the highest volume since 2007 when it reached 5.03 million and the strongest increase since 2004.

The result was total housing inventory at the end of December fell 8.5 percent to 1.82 million existing homes available for sale, which represents a 4.4-month supply at the current sales pace, down from 4.8 months in November, and is the lowest housing supply since May of 2005.

This means new-home construction will have to pick up to satisfy the increasing demand for housing—which includes both single family homes and rental units for those who aren’t purchasing. And the outlook is good, with privately-owned housing starts in December at a seasonally adjusted annual rate of 954,000. This is 12.1 percent above the revised November estimate of 851,000 and is 36.9 percent above the December 2011 rate of 697,000, according to the US Census Bureau.

image

This Calculated Risk graph that dates back to 1968 tells us how far construction has to grow to even return to historical levels of 1.5 million annual units. The shadowed areas are recessions.

On a year-over-year basis, private residential construction spending is now up 19 percent. Non-residential spending is up 8 percent year-over-year mostly due to energy spending says Calculated Risk. Public spending is down 3 percent year-over-year, and that is the real problem. Governments should be spending much more on public infrastructure, when and if the economy returns to more normal growth.

The real problem at present is the political gridlock. “Builders’ sentiment remains very close to the index’s tipping point of 50, where an equal number of builders view conditions as good and poor, and fundamentals indicate continued momentum in housing this year,” said National Association of Home Builders Chief Economist David Crowe. “However, persistently tight mortgage credit conditions, difficulties in obtaining accurate appraisals and the ongoing stalemate in Washington over critical economic concerns continue to impede the housing recovery.”

Need we say more about what is holding back not only housing growth, but overall economic growth in this country?

Harlan Green © 2013

Follow Harlan Green on Twitter: www.twitter.com/HarlanGreen

Thursday, November 29, 2012

High Pending Home Sales—A 2013 Housing Shortage?

The Mortgage Corner

The huge jump is pending home sales could presage a sharp drop in inventory of homes for sale in 2013. Why? There are fewer foreclosures because of the declining shadow inventory of homes in default that have been bloating the for-sale inventories resulting from the housing bubble. And this is already causing home prices to rise while housing construction is still lagging, 50 percent below its recent high.

The Pending Home Sales Index just released by the National Association of Realtors, a forward-looking indicator based on contract signings but not closings, increased 5.2 percent to 104.8 in October from an upwardly revised 99.6 in September and is 13.2 percent above October 2011.

Lawrence Yun , NAR chief economist, said buyers are responding to favorable market conditions. "We've had very good housing affordability conditions for quite some time, but we're seeing more impact now from steady job creation, and rising consumer confidence about home buying now that home prices have clearly turned positive."

Outside of a few spikes during the tax credit period, pending home sales are at the highest level since March 2007 when the index also reached 104.8. On a year-over-year basis, pending home sales have risen for 18 consecutive months.

clip_image002

Graph: Calculated Risk

"The Northeast saw some impact from Hurricane Sandy, but limited inventory in the West is keeping a lid on the market. All regions are up from a year ago, with double-digit gains in every region but the West," Yun said. Housing inventories are down 23 percent in one year.

And we see that foreclosure inventories have been declining, as have foreclosure rates. We now see short sales replacing foreclosure sales, down to just 20 percent of all sales from its high of 35 percent just after the Great Recession.

Calculated Risk reports Lenders Processing Service released their First Look report for October today. LPS reported that the percent of loans delinquent decreased in October compared to September, and declined about 7 percent year-over-year. Also the percent of loans in the foreclosure process declined sharply in October and are the lowest level since August 2009.

clip_image004

Graph: Calculated Risk

LPS reported the U.S. mortgage delinquency rate (loans 30 or more days past due, but not in foreclosure) decreased to 7.03 percent from 7.40 percent in September. Note: the normal rate for delinquencies is around 4.5 percent.

Lastly, home prices are rising because of the declining for-sale inventories. Case-Shiller, CoreLogic and others report nominal house prices, and it is also useful to look at house prices in real terms (adjusted for inflation) and as a price-to-rent ratio, since housing prices cannot rise faster than rents (i.e., household incomes) over the longer term. Therefore the ratio between rents and prices tells us if housing prices are rising abnormally, as happened during the housing bubble. As an example, if a house price was $200,000 in January 2000, the price would be close to $275,000 today adjusted for inflation.

clip_image006

Graph: Calculated Risk

This actually means that we should see a surge in housing construction, and therefore construction jobs in 2013. Stay tuned for the National Association of Home Builders sentiment survey that tracks builder’s confidence in new home construction to confirm that will happen.  Its index has already tripled since its post-recession lows.

Harlan Green © 2012