Showing posts with label mortgage applications. Show all posts

Friday, January 20, 2023

Housing Market Swoon--Part II

 The Mortgage Corner

 CalculatedRisk

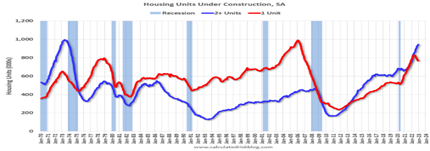
Despite improved builder sentiments, privately‐owned housing starts were down in December at a seasonally adjusted annual rate of 1,382,000. This is 1.4 percent below the revised November estimate of 1,401,000 and is 21.8 percent below the December 2021 rate of 1,768,000.

An estimated 1,553,300 housing units were started in 2022 (red line single unit, blue line 2+nnits in above graph). This is 3.0 percent below the 2021 figure of 1,601,000, so housing construction is also in a “swoon”.

And existing-home sales faded for the eleventh straight month to a seasonally adjusted annual rate of 4.02 million. Existing-home sales totaled 5.03 million in 2022, down 17.8 percent from 2021, as last year’s rapidly escalating interest rate environment weighed on the residential real estate market.

“December was another difficult month for buyers, who continue to face limited inventory and high mortgage rates,” said NAR Chief Economist Lawrence Yun. “However, expect sales to pick up again soon since mortgage rates have markedly declined after peaking late last year.”

The 30-year fixed-rate mortgage averaged 6.15 percent as of Jan. 19, according to data released by Freddie Mac on Thursday. That’s down 18 basis points from the previous week — one basis point is equal to one hundredth of a percentage point.

Last week, the 30-year was at 6.33 percent Last year the 30-year was averaging at 3.56%. Rates are now at the lowest level since September 2022.

It is causing a surge in mortgage applications, according to the Mortgage Bankers Association.

The MBA reported its Market Composite Index, a measure of mortgage loan application volume, increased 27.9 percent on a seasonally adjusted basis from one week earlier.  The Refinance Index increased 34 percent from the previous week and was 81 percent lower than the same week one year ago. The seasonally adjusted Purchase Index increased 25 percent from one week earlier.

The modest drop in interest rates also helped to end a string of 12 straight monthly declines in builder confidence levels, although sentiment remains in bearish territory as builders continue to grapple with elevated construction costs, building material supply chain disruptions and challenging affordability conditions, per Bill McBride, author of the Calculated Risk blog.

Joel Kan, MBA’s Vice President and Deputy Chief Economist, said “This week’s builder sentiment index from the NAHB reflected an improving outlook and increased buyer traffic, as mortgage rates have backed off from recent highs. The housing market is still in need of more starter and entry-level homes, especially when current demographic trends point to the potential for more younger households to enter homeownership in the near future. New construction of these units will help these buyers entering the housing market.”

Mortgage rates should continue to decline, aided by homebuilders who are now offering initial interest rates as slow a 4 percent to entice buyers. They can do this by buying down a fixed rate and adding its costs to the purchase price, or offering shorter term fixed rates or even an adjustable rate loan.

Will this end the housing “swoon”? There is lots of pent-up demand, and we still have a housing shortage.

Harlan Green © 2023

Follow Harlan Green on Twitter: https://twitter.com/HarlanGreen

Friday, September 23, 2022

Homebuyers on the Move Again

 The Mortgage Corner

FRED30yrfixed

Mortgage rates are on the march again, but so are homebuyers. How long must prospective homebuyers wait when average conforming 30-year fixed rates topped 6.29 percent this week per Freddie Mac and the Fed says they may push up rates even further?

Fixed conforming mortgage rates dropped below 5 percent for the first time in 2009, per the FRED graph that dates back to 1971, yet home buyers kept buying as the economy recovered from the Great Recession and busted housing bubble as well.

They are buying again after the big rise interest rates engineered by the Federal Reserve. Why is it such a surprise?? Rates are still low historically, though home prices have surged in the double digits because of the prolonged decline in interest rates during the pandemic.

One reason for the buying surge? “Most of the country saw modest improvements in homebuyer affordability for the third straight month because of slightly lower mortgage rates amidst steady income gain growth. The healthy labor market continues to be a positive for the housing market, despite ongoing economic uncertainty and high inflation,” said Edward Seiler, MBA's Associate Vice President, Housing Economics. “Higher mortgage rates have reduced borrowers’ purchasing power since the start of the year.”

MBA.org

Both purchase and refinance applications increased in the last week per the Mortgage Bankers Association indexes, up 1 percent and 10 percent, respectively. So-called Jumbo conforming rates were slightly better. For homes sold for over $647,200, the average rate for the 30-year was 5.79 percent. The 15-year rose to 5.56 percent.

The latest existing- home sales rate dropped slightly to 4.8 million annualized, which is actually on a par with average home sales since the Great Recession. It dipped below 4 million during the last two recessions. Whether home buying continues might depend on how much higher interest rates climb.

"The housing sector is the most sensitive to and experiences the most immediate impacts from the Federal Reserve's interest rate policy changes," said NAR Chief Economist Lawrence Yun. "The softness in home sales reflects this year's escalating mortgage rates. Nonetheless, homeowners are doing well with near nonexistent distressed property sales and home prices still higher than a year ago."

So, a housing recession may not be in the cards, just yet.

Harlan Green © 2022

Follow Harlan Green on Twitter: https://twitter.com/HarlanGreen

Friday, June 14, 2019

How Strong is 2019 Housing Market--Part II?

The Mortgage Corner


We asked just how strong is the housing market last month with interest rates beginning to fall again. Lawrence Yun, NAR’s chief economist, said he is not overly concerned about the trending drop in existing-home sales reported in May.
“First, we are seeing historically low mortgage rates combined with a pent-up demand to buy, so buyers will look to take advantage of these conditions,” he said. “Also, job creation is improving, causing wage growth to align with home price growth, which helps affordability and will help spur more home sales.”
So-called ‘house-flipping’ (homes sold that are owned less than 2 years) is becoming a significant trend, meaning housing prices have risen enough that home buyers are beginning to buy homes they intend to sell in less than 2 years; which also happened in early 2000s when the housing bubble took off. Speculators are hoping to make a quick buck, in other words, as there is a rather severe lack of available inventory in the affordable and mid-price ranges.

That has left a big market for rehab specialists who can get their hands on physically distressed or out-of-date properties for peanuts. The median sales price of flipped homes during the first quarter was $215,000, according to Attom Data Solutions, a real-estate information firm.
ATTOM Data Solutions just released its Q1 2019 Home Flipping report and found that 7.2 percent of all home sales during the first quarter reached a new high flipping rate, the highest since Q1 2010.

The 7.2 percent flipping rate is up from 5.9 percent in the previous quarter and up from 6.7 percent a year ago. However, while flippers are flipping, gross profits are stumbling.

“Homes flipped in Q1 2019 sold at an average gross profit of $60,000, down from an average gross flipping profit of $62,000 in the previous quarter and down from $68,000 in Q1 2018 to the lowest average gross flipping profit since Q1 2016’” said the report.
 

This is further evidence of the lack of affordable housing inventory, even though sales of previously-owned homes have fallen in three out of four months this year. However new-home sales are running about 7 percent higher than last year’s pace, says MarketWatch’s Andrea Riquier. This is while home prices accelerated in April for the first time in a year.

Mortgage applications increased 26.8 percent from one week earlier. Refinance applications are up 48 percent and purchase applications up 20 percent without seasonal adjustments, according to data from the Mortgage Bankers Association’s (MBA) Weekly Mortgage Applications Survey for the week ending June 7, 2019.
"Mortgage rates for all loan types fell by a sizeable margin for the second straight week, pulled down by trade tensions with China and Mexico, the financial markets reacting to more bearish communication from several Fed officials, and weaker than expected hiring in May," said Joel Kan, MBA's Associate Vice President of Economic and Industry Forecasting. "Despite the less positive outlook, both purchase and refinance applications surged, driven mainly by these lower rates. The refinance index jumped 47 percent to its highest level since 2016."
No wonder, as the 30-year conforming fixed rate is holding at 3.50 percent for less than a 1 pt. origination fee, as interest rates are back to historic lows last seen during the Fed’s QE programs, as I said. The super-conforming fixed rate with loan amounts to $625,500 also now available at 3.50 percent.
Harlan Green © 2019

Follow Harlan Green on Twitter: https://twitter.com/HarlanGreen

Monday, September 12, 2016

Why Isn't It Easier to Qualify For A Mortgage?

The Mortgage Corner

It’s not getting any easier to obtain a mortgage. This is in spite of record low mortgage rates, as low as 3.0 percent for 30-year conforming fixed rates; as well as the appearance of so-called Alt-A, non-QM mortgages with 3 to 7 year, interest only, fixed rates that require 12 months personal bank statements to verify income.

According to a report from the Urban Institute that tracks mortgage availability among other housing issues, the pool of mortgage loans made between 2011 and 2015 have even lower default rates than the more “normal” lending period of 1999 to 2003, when less than 2 percent of the loans defaulted after 10 years.

By comparison, 12 to 13 percent of the mortgage loans made at the height of the housing bubble between 2006 and 2007 defaulted within 10 years of their origination, the Urban Institute said in August, citing Fannie Mae’s data. And that was mostly due to the Great Recession and loss of some 8 million jobs.


The Urban Institute noted that of Fannie Mae- and Freddie Mac-backed loans made after 2011 and through the first quarter of 2015, 69 percent of the borrowers had FICO scores better than 750. Between 1999 and 2003, only a third of people with such mortgages had a credit score that high. Less than 1 percent of loans that have been made after 2011 have defaulted, according to Fannie Mae’s data, the Urban Institute said, even for those borrowers with FICO scores under 700

Requiring higher credit scores is just one way lenders have made it more difficult to qualify. Fannie and Freddie also pile on points for scores above 680, which was a normal mid-score before the housing bubble, and in effect boosts the interest rate. For instance, just a 1 pt. cost add on for a score below 700 is the equivalent of a one-quarter percent raise in the rate.

Other problems are due to the reforms mandated by Dodd-Frank designed to protect consumers from predatory lenders, while a good idea, have made it much more difficult for lenders and slowed down the qualification time. This includes additional delays in closings for the slightest change in rates or points enacted due to the new TRID requirements (short for TILA/RESPA Integrated Disclosure) enacted last fall.

This has made lenders much more selective in granting mortgages. We are probably back to 1980s qualification standards when many fewer loans were granted—mostly by S&Ls that disappeared after the late 1980s banking scandals.

We are in a much better position today, 7 years after the Great Recession, in other words. The inventory of loans in negative equity positions dropped by 31 percent (1.5 million) in 2015, according to Black Knight. At a total of 3.2 million, or 6.5 percent of all homeowners with a mortgage, this represents significant improvement from the peak in 2010, but is still well above “normal” levels.


 Both the S&P Case-Shiller Home Price Index and Corelogic stats show home prices rising as much as 10 and 11 percent in Portland and Seattle, respectively, in its latest 3-month averaged, same home survey, and 5-6 percent nationally on average.  This will continue to bring back housing values and lower negative equity in homes.
So there’s no reason to continue to be as cautious as mortgage lenders are today.  There is of course the political brouhaha over whether Fannie and Freddie should become private corporations again, and so separated from US Treasury control.  With their future unclear, these entities that guarantee more than 60 percent of all mortgages make lenders doubly cautious about qualifying younger, entry-level borrowers, in particular.

Harlan Green © 2016

Follow Harlan Green on Twitter: https://twitter.com/HarlanGreen

Tuesday, February 9, 2016

Why Are Mortgage Rates At Historical Lows?


Mortgage rates continued to tumble over the past week as investors fled to the safety of government bonds, pushing Treasury yields down, mortgage provider Freddie Mac said Thursday. This is no surprise given the geopolitical uncertainties buffeting economies worldwide.


The 30-year fixed-rate mortgage averaged 3.72 percent in the Feb. 4 week, down from 3.79 percent from a week earlier and is at the lowest level since April 30, Freddie Mac said. The 15-year fixed-rate mortgage averaged 3.01 percent, down from 3.07 percent. The 5-year Treasury-indexed hybrid adjustable-rate mortgage averaged 2.85 percent, down 5 basis points.

“These declines are not what the market anticipated when the Fed raised the Federal Funds rate in December,” Freddie’s chief economist, Sean Becketti, noted in a statement. “For now, though, sub-4 percent mortgage rates are providing a longer-than-expected opportunity for mortgage borrowers to buy or refinance.”

In fact, the 30-year conforming fixed rate can currently be bought down to 3.25 percent.  This is a historical low, and causing a rise in mortgage applications.  The Refinance Index increased 0.3 percent from the previous week to its highest level since October 2015, reports the MBA. The seasonally adjusted Purchase Index decreased 7 percent from one week earlier. The unadjusted Purchase Index increased 11 percent compared with the previous week and was 17 percent higher than the same week one year ago.

But for how long can these below-historically-low rates continue?  Too much oil, for one, should help to keep oil prices, and therefore inflation, almost non-existent for this year, at least.  That’s according to Barron’s resident economist Gene Epstein.  “…over the past five years,” says Epstein, “the world has found a trillion extra barrels of oil—the equivalent of 30 years of extra supply—with a third of it coming from shale, a third from deep water, and a third from oil sands. Over the past year, the costs of recovery from these sources has noticeably fallen. A return to triple-digit prices on crude oil is (therefore) unlikely for the foreseeable future.” 


            But there’s another reason for such low interest rates.  Growth is slowing worldwide, which is the major reason inflation is so low.  And Janet Yellen is now backtracking on raising the Fed’s rates any higher this year.
            But consumers don’t seem to be listening to the bad news. Consumer spending — the main engine of the U.S. economy — rose 3.1 percent in 2015 to set the fastest pace since 2005. Unless Americans suddenly turn pessimistic, they’ll keep spending at a decent clip this year and give businesses no reason to resort to mass layoffs.
One major bellwether is car sales, says Marketwatch’s Jeffry Bartash. After snapping up a record 17.5 million new vehicles in 2015, Americans were back at it in January. Sales rose last month rose at the same robust 17.5 million pace. “That’s not a sign of an increasingly anxious consumer.”

Harlan Green © 2016

Follow Harlan Green on Twitter: https://twitter.com/HarlanGreen
Wednesday, August 19, 2015

Higher Birth Rates Are Here

The Mortgage Corner

The mellennial generation, now aged 18 to 36 years, are beginning to drive higher birth rates. And that means more households being formed, which will ultimately create a higher demand for housing. Actually, a 4 million birth rate was breached in 2007, and births then declined due to the Great Recession. But the millennials are back above the 4 million birth rate again.

And housing construction is surging—no coincidence, given the rising demand for housing of any kind—rental as well as for prospective homeowners. Led by a strong jump in single-family production, nationwide housing starts inched up 0.2 percent to a seasonally adjusted annual rate of 1.206 million units in July, according to newly released data from the U.S. Department of Housing and Urban Development and the Commerce Department. This is the highest level since October 2007.

“This month’s drop in the more volatile multifamily side is a return to trend after an unusually high June,” said NAHB Chief Economist David Crowe. “While multifamily production has fully recovered from the downturn, single-family starts are improving at a slow and sometimes intermittent rate as consumer confidence gradually rebounds. Continued job and economic growth will keep single-family housing moving forward.” 

Births had declined for five consecutive years prior to increasing in 2013. They are about 7.7 percent below the peak in 2007 (births in 2007 were at the all-time high - even higher than during the "baby boom"). “I suspect certain segments of the population were under stress before the recession started,” says Calculated Risk’s Bill McBride, “- like construction workers - and even more families were in distress in 2008 through 2012. And this led to fewer babies.”

image

Graph: Calculated Risk

The above historical graph dates back to 1909, and the largest dip was before and during the Great Depression. It hit bottom in 1933, before beginning to rise again until it hit the baby boomer bulge of the 1950s and 60s.

This has to be the main reason home builder sentiment is at a 10-year high. The new home sector is increasingly a central source of strength for the economy and builders are increasingly optimistic, says the NAHB. The housing market index rose 1 point to a very strong 61 in August with the future sales component leading the way at 70. Current sales are at 66 with traffic continuing to lag but less so, at 45 for a 2 point gain in the month.

“Today’s report is consistent with our forecast for a gradual strengthening of the single-family housing sector in 2015,” said NAHB Chief Economist David Crowe. “Job and economic gains should keep the market moving forward at a modest pace throughout the rest of the year.”

Single-family starts rose 12.8 percent to a seasonally adjusted annual rate of 782,000 units after an upwardly revised June reading while multifamily production fell 17 percent to 424,000 units. And rising single family starts is another sure sign that more families and households are being formed.

What age group is having the most births? It is women in their 30s. The preliminary birth rate for women aged 30–34 in 2014 was 100.8 births per 1,000 women, up 3 percent from the rate in 2013 (98.0). The rate for this group has increased steadily since 2011. The number of births to women in their early 30s also increased in 2014, by 4 percent.

The rate for women aged 35–39 was 50.9 births per 1,000 women, up 3 percent from 2013 (49.3). The rate for this group has increased steadily since 2010. The number of births to women in their late 30s increased 5 percent in 2014.

Need we say more about the rising birth rate? All signs point to another upsurge in new household formation, needless to say, the main driver of real estate sales and the concomitant sectors that aid and drive RE—jobs in construction, insurance, professional fields, and banking, for starters.

Could it be that the real estate industry will drive 3 percent plus GDP growth for the rest of 2015, even if interest rates rise slightly? Rates are still at record lows with the conforming 30-year fixed rate at 3.625 percent for 1 origination point, and purchase mortgage applications still up 19 percent year over year, reports the Mortgage Bankers Association.

Harlan Green © 2015

Follow Harlan Green on Twitter: https://twitter.com/HarlanGreen

Tuesday, July 7, 2015

Pending Home Sales, Mortgage Applications Soar

The Mortgage Corner

Pending home sales continued to rise in May and are now at their highest level in over nine years, according to the National Association of Realtors. Gains in the Northeast and West were offset by small decreases in the Midwest and South. This is why we expect both existing and new-home sales to be the best since 2006 at the height of the housing bubble.

And mortgage activity is soaring, thanks to ultra-low interest rates, with total mortgage origination balances reaching $466 billion in the first quarter -- nearly a 75 percent increase from the same time a year ago, according to the Equifax National Consumer Credit Trends Report.

The Pending Home Sales Index, a forward-looking indicator based on contract signings, climbed 0.9 percent to 112.6 in May and is now 10.4 percent above May 2014. The index has now increased year-over-year for nine consecutive months and is at its highest level since April 2006.

image

Graph: Econoday

Pending sales were strongest in the West, up 2.2 percent in May for a 13.0 percent year-on-year gain. Pending sales in the South, up 10.6 percent year-on-year, have also been strong though the region though lower by 0.8 percent in the latest month. The Midwest was down 0.6 percent for a year-on-year plus 7.8 percent, but were up sharply in the Northeast where housing came back strongly from the severe winter, up 6.3 percent in this report for a year-on-year again of 10.6 percent.

NAR chief economist Lawrence Yun says contract activity rose again in May for the fifth straight month, increasing the likelihood that home sales are off to their best year since the downturn. "The steady pace of solid job creation seen now for over a year has given the housing market a boost this spring," said Yun. "It's very encouraging to now see a broad based recovery with all four major regions showing solid gains from a year ago and new home sales also coming alive."

Equifax said the bulk of mortgage growth has been to first mortgages, which zoomed nearly 80 percent compared to the first quarter of 2014 to $430 billion. The number of first mortgages originated in the first three months of the year was 1.78 million -- a 55 percent increase over the same time a year ago and 14 percent higher than in the fourth quarter of 2014. Originations of home equity lines of credit (HELOCs) rose 30 percent to $30.9 billion and new home equity installment loans climbed 13.6 percent to $5.0 billion.

  • Average first-lien mortgage loan amounts rose to $232,547 in March, an 11.5% increase over March 2014;
  • The number of first mortgages originated in the first three months of the year was 1.78 million, a 54.9% increase over the same time a year ago and 13.6% higher than in the fourth quarter of 2014;
  • The share of first mortgage accounts originated in the first quarter that went to consumers with an Equifax Risk Score below 620 (generally considered subprime) was 4.5%;
  • 3.1% of newly originated balances in the first quarter went to borrowers with subprime credit scores. For the same time a year ago, the share was 3.5%; and
  • The average loan amount for a first mortgage originated to a borrower with a subprime credit score in March 2015 was $152,260, up 9.9% from March 2014.

"The drop in mortgage rates that began in the fourth quarter of last year kicked off a refinance boomlet that accelerated in the first quarter, as rates fell further, averaging just 3.7 percent for the first three months of this year," said Amy Crews Cutts, Chief Economist at Equifax. "While rates have recently reversed that trend and are back up to about 4 percent, they remain extremely low historically. These rates, coupled with a housing market that is showing signs of vigor, should carry the mortgage business over the summer."

So we are seeing the housing sector back to normal growth. Existing-home sales also rose 5.1 percent in May to a 5.35 million annual rate. Home sales were plus 9.2 percent which, outside of the March 11.9 percent, is the strongest rate in nearly two years. And prices are rising, up 7.9 percent year-on-year at a median $228,700.

But, "Housing affordability remains a pressing issue with home-price growth increasing around four times the pace of wages," adds Yun. "Without meaningful gains in new and existing supply, there's no question the goalpost will move further away for many renters wanting to become homeowners."

Harlan Green © 2015

Follow Harlan Green on Twitter: https://twitter.com/HarlanGreen

Saturday, April 25, 2015

March New-Home Sales A Dud

"Sales of new single-family houses in March 2015 were at a seasonally adjusted annual rate of 481,000, according to estimates released jointly today by the U.S. Census Bureau and the Department of Housing and Urban Development. This is 11.4 percent below the revised February rate of 543,000, but is 19.4 percent above the March 2014 estimate of 403,000."

image

Graph: Calculated Risk

The March result was a disappointment, mainly in the south, where sales fell 15.8 percent. And because builders continue to build—housing starts are close to the million unit mark again—housing inventories are rising and prices are falling. The supply of new homes rose to 5.3 months, while the median price fell to 1.5 percent to $277,400. Year-on-year, the median price to down 1.7 percent while sales are up 19.4 percent, a discrepancy that points to price discounting by builders, says Calculated Risk.

What is behind the up and down gyration in sales? Winter is still with us, for one thing. And many of the southern and Midwest states are being pounded by tornadoes, as well as torrential rains. Lower oil prices could also be hurting an area heavily dependent on the oil and gas industries.

We will know next week if job creation will resume from February’s low numbers, and so consumer confidence remains high. Mortgage activity is high, highest level in years, what with interest rates still at record lows. (The 10-year Treasury yield is back down to 1.91 percent, and Eurozone bonds now have negative interest rates, meaning banks have to pay their clients to borrow money, because there is so little demand for loans.)

Mortgage applications increased 2.3 percent from one week earlier, according to data from the Mortgage Bankers Association's (MBA) Weekly Mortgage Applications Survey for the week ending April 17, 2015.  The Market Composite Index, a measure of mortgage loan application volume, increased 2.3 percent on a seasonally adjusted basis from one week earlier.  The seasonally adjusted Purchase Index increased 5 percent from one week earlier to its highest level since June 2013.  The unadjusted Purchase Index increased 6 percent compared with the previous week and was 16 percent higher than the same week one year ago.

"Purchase applications increased for the fourth time in five weeks as we proceed further into the spring home buying season. Despite mortgage rates below four percent, refinance activity increased less than one percent from the previous week," said Mike Fratantoni, MBA's Chief Economist.  

The fact that purchase mortgage applications now comprise 44 percent of all applications, the highest in years, as we said, means the Fed’s policy of keeping interest rates as low as possible until household incomes begin to rise again is the right policy to kick start the housing market, and bring in those first time homebuyers who have been renting until know.

It also means some overbuilding of new homes is necessary to build up housing inventories for sale, and thus keep home prices in the affordable range.

Harlan Green © 2015

Follow Harlan Green on Twitter: https://twitter.com/HarlanGreen

Tuesday, April 7, 2015

Mortgage Delinquencies Close to Pre-Recession Lows.

The Mortgage Corner

Calculated Risk reports Black Knight Financial Services (BKFS) released their Mortgage Monitor report for February on Monday. According to BKFS, 5.36 percent of mortgages were delinquent in February, down from 5.56 percent in January. BKFS reported that 1.58 percent of mortgages were in the foreclosure process, down from 2.22 percent in February 2014. This is approaching historical lows for delinquencies, and should mean a very good year for housing.

image

Graph: Calculated Risk

February’s delinquency rate, while still 17 percent above the pre-crisis norm of 4.6 percent, was down 49 percent from its January 2010 peak of 10.6 percent. And at 1.58 percent, the foreclosure rate remained 175 percent above precrisis norms, but was still down 63 percent from its October 2011 peak, reports Black Knight.

This breaks down as:

· 1,646,000 properties less than 90 days past due, but not in foreclosure.

· 1,067,000 properties that are 90 or more days delinquent, but not in foreclosure.

· 800,000 loans in foreclosure process.

It also means last week’s jump in Pending Home Sales was no fluke, as lower delinquency rates mean more homes with positive equity are increasing housing inventories. The National Association of Realtors Pending Sales Index is at its highest level since June 2013 (109.4), has increased year-over-year for six consecutive months and is above 100 – considered an average level of activity – for the 10th consecutive month.

So what will happen in 2015? Mortgage applications have also jumped, particularly purchase applications, as we said last week. "There was a broad based increase in mortgage applications last week (April 1) relative to the week prior. The increase in purchase volume was led by a nearly 6 percent increase in both conventional and government markets, perhaps signaling that households are finally ready to begin the home-buying season," said Lynn Fisher, MBA's Vice President of Research and Economics.

But that is largely because of still record low interest rates. The Fed wants to begin to raise interest rates sometime this year, but growth has slowed recently, due to the another severe winter, and a soaring dollar value that hurts exports. So the latest words from the Fed Governors are that low interest rates should be around for a while longer.

New York Fed Governor William Dudley said as much recently. “…as Chair Yellen remarked in her most recent press conference, removal of “patient” from the statement does not indicate that we will be “impatient” to begin to normalize monetary policy.  Rather, the timing of normalization will be data dependent and remains uncertain because the future evolution of the economy cannot be fully anticipated.”

The housing market will have a very good year, according to Core Logic’s 2015 housing forecast. “The U.S. economy is poised to grow by close to 3 percent in 2015, generating a 3- to 3.5-million-person gain in employment,” said Core Logic chief economist Frank Nothaft. “This job growth, coupled with very low mortgage interest rates and some easing in credit access, is expected to propel both owner-occupant and rental housing activity this year. This heightened level of housing demand should translate to the best home sales market in eight years.”

Let us hope the Fed remains patient for first-time homebuyers that require affordable loan rates, in particular, and are just now entering the housing market.

Harlan Green © 2015

Follow Harlan Green on Twitter: https://twitter.com/HarlanGreen

Thursday, April 2, 2015

Housing In Recovery-Pending Home Sales Soar

The Mortgage Corner

February Pending Home Sales Index, a forward-looking indicator based on contract signings, rose 3.1 percent to 106.9 in February from a slight downward revision of 103.7 in January and is now 12.0 percent above February 2014 (95.4). The index is at its highest level since June 2013 (109.4), has increased year-over-year for six consecutive months and is above 100 – considered an average level of activity – for the 10th consecutive month.

This is while new U.S. homes sold at an annual rate of 539,000 in February to mark the best month of sales in seven years, the government reported Tuesday. The pace of sales for January was also revised up sharply to 500,000. It's the first time annualized sales have hit 500,000 or more for two straight months since early 2008, as we said last week.

NAR chief economist Lawrence Yun, says demand appears to be strengthening as we head into the spring buying season. “Pending sales showed solid gains last month, driven by a steadily-improving labor market, mortgage rates hovering around 4 percent and the likelihood of more renters looking to hedge against increasing rents,” he said. “These factors bode well for the prospect of an uptick in sales in coming months. However, the underlying obstacle – especially for first-time buyers – continues to be the depressed level of homes available for sale.”

In fact, the 30-year conforming fixed rate is in the mid-3 percent range today in California, and hovering near its all-time low.  Even better news is, according to NAR’s monthly Realtors® Confidence Index, the percent share of first-time buyers increased slightly for the first time in February since November 2014, up to 29 percent from 28 percent in January. But such good news may not last, as the depressed level of inventories is continuing to boost home prices, making homes less affordable for those first-timers.

image

Graph: Calculated Risk

The Case-Shiller Home Price Index reports that home prices are firming as the Case-Shiller composite-20 index rose 0.9 percent in January following a 0.9 percent gain in December and a 0.8 percent rise in November. This is the strongest streak for this report since late 2013, and gives us more evidence of the need for more inventory. Year-on-year, however, prices are still on the soft side, up only 4.6 in January and only fractionally higher than the prior two months.

The increase in mortgage applications is another sign that home sales may be increasing this selling season, probably due to the low interest rates. The seasonally adjusted Purchase Index increased 6 percent from one week earlier. ... The unadjusted Purchase Index ... was 8 percent higher than the same week one year ago.

image

Graph: Calculated Risk

“There was a broad based increase in mortgage applications last week relative to the week prior. The increase in purchase volume was led by a nearly 6 percent increase in both conventional and government markets, perhaps signaling that households are finally ready to begin the home-buying season,” said Lynn Fisher, MBA’s Vice President of Research and Economics.

The rise in the share of first time home buyers is not a huge change but may predict more millennials of the Generation Y cohort aged 18-36 years, entering the housing market that have been renting until now. “Several markets remain highly-competitive due to supply pressures, and Realtors are reporting severe shortages of move-in ready and available properties in lower price ranges,” adds Yun. “The return of first-time buyers this year will depend on how quickly inventory shows up in the market.”

So still record low interest rates have to be a major reason both refinance and purchase loan activity has picked up. Conforming 30-year fixed rates are as low as 3.375 percent in California for 1 origination point. This is the rate that prevailed during the Fed’s QE purchase program more than one year ago. It has to be thanks to Fed Chairwoman Janet Yellen who has been unrelenting in her opposition to any interest rate increases until she sees sustainable growth and rising wages.

Harlan Green © 2015

Follow Harlan Green on Twitter: https://twitter.com/HarlanGreen

Wednesday, February 11, 2015

Mortgage Refinancings Surging in 2015

The Mortgage Corner

The still record-low interest rates are making a difference. Refinancings jumped 66 percent in January’s first two weeks, according to the MBA. And borrowers who refinanced during the fourth quarter of 2014 were able to reduce their interest rate, on average, by about 1.3 percentage points – a savings of about 23 percent, according to a recent Freddie Macs report. On a $200,000 loan that translates into saving of about $2,500 interest during the next 12 months.

image

Graph: Calculated Risk

Why? Conforming 30-yr fixed rates now are as low as 3.375 percent, and high-balance fixed rate conforming amounts can be found at 3.50 percent for 1 origination point.

"Our latest refinance report shows the refinance boom continued to wind down as the pool of potential borrowers declined over the course of 2014,” says Len Kiefer, Freddie Mac deputy chief economist. “However, because mortgage rates fell in the fourth quarter of last year, we actually saw the share of refinance originations tick up a bit despite volumes being down, a similar trend we expect to see for the first quarter of 2015 as mortgage rates have moved even lower.”

One popular program that in many cases doesn’t even require an appraisal for loan amounts up to 125 percent of value is the HARP II programs for conforming loans originated before June, 2009. Borrowers can reduce their interest rate to today’s market rates. But normal conforming qualification debt ratios and decent credit are required for HARP refinancings.

Home owners who refinanced through the government’s HARP program during the fourth quarter of 2014 saw an average reduction in their interest rate of 1.6 percentage points, according to Freddie Mac, amounting to an average savings of $3,300 in interest during the first 12 months – or about $275 in savings every month.

About 71 percent of those who refinanced their first-lien mortgage maintained about the same loan amount or lowered their principal balance by paying additional money at closing, according to the report.

But 34 percent of refinancers were able to shorten their loan terms, according to the report. This is when the conforming 15-yr fixed rate today is 2.50 percent. Overall, borrowers who refinanced in 2014 saved about $5 billion in interest over the next 12 months.

This has to spur home construction as well, since it enables the reduction of so much debt.

image

Graph: Calculated Risk

And sure enough, the U.S. Census Bureau of the Department of Commerce said that construction spending during October 2014 was estimated at a seasonally adjusted annual rate of $971.0 billion, 1.1 percent above the revised September estimate of $960.3 billion.

The latest NAR survey also showed more optimism for 2015 housing sales. An improving job market, low mortgage rates, and recent moves by the government to loosen up mortgage credit is fueling increased optimism among REALTORS®. In particular, real estate professionals are growing more confident about the housing market’s outlook for the next six months, according to the December 2014 REALTORS® Confidence Index, a survey of more than 4,000 Realtors.

So stay tuned, as winter wanes and interest rates stay low. Of course it will be up to the Federal Reserve as well, to maintain low interest rates for the rest of 2015.

Harlan Green © 2015

Follow Harlan Green on Twitter: https://twitter.com/HarlanGreen

Sunday, January 18, 2015

Mortgage Applications Increase Incredible 49 percent in January

The Mortgage Corner

Mortgage applications increased 49.1 percent from one week earlier, said the just released Mortgage Bankers Association’s Weekly Mortgage Applications Survey for the week ending January 9, 2015. It was the largest increase since 2008 at the start of the Great Recession, mostly due to record-low interest rates. Some of the increase may also be because rental rates are soaring, making renting more expensive than paying for a mortgage in many areas with such low rates.

The Refinance Index increased 66 percent from the previous week to the highest level since July 2013. The seasonally adjusted Purchase Index increased 24 percent from one week earlier to the highest level since September 2013.

“The US economy and job market continued to show signs of strength, but weakness abroad and tumbling oil prices have led to further declines in longer-term interest rates,” said Mike Fratantoni, MBA’s chief economist.

image

Graph: Calculated Risk

This is while the 30-yr conforming fixed rate dropped ¼ percent in one day to 3.25 percent for a 1.25 pt. origination cost. “Mortgage rates reached their lowest level since May of 2013, and refinance application volume soared, more than doubling on an unadjusted basis, and up 66 percent after adjusting for the fact that the previous week included the New Year’s holiday,” said Fratantoni.

Applications for larger refinance loans increased more than 4 times relative to the previous week. The average conventional refinance application increased to $298,700 from $233,500 the prior week. Although there was a somewhat smaller increase for government refinance volume, VA refinance applications increased by 50 percent. VA loans tend to be larger than FHA and USDA loans, and hence are more responsive to a given rate change.

image

Graph: Marketwatch

And the price to keep a roof over millennials’ heads rushed ahead of overall consumer inflation in 2014 as rents spiked up, according to just released data. The U.S. Labor Department’s gauge of prices for shelter—a broad category that includes items such as apartment rent and hotel stays—showed inflation of 2.9 percent in 2014, the fastest calendar-year result since 2007. Rent inflation reached 3.4 percent, the largest calendar-year growth since 2008.

It may be due to better job prospects, said the the MBA.

“In addition to the drop in rates, and news of improvement in the job market, there was additional positive news for prospective homebuyers with evidence that credit availability has increased somewhat, and with FHA’s announcement of a decrease in their mortgage insurance premiums,” Fratantoni said.

Purchase application volume increased by almost 24 percent, with stronger growth for conventional applications than for government loans. Purchase application volume was at its highest level since September 2013, increased on a year over year basis in the aggregate, and notably increased across most loan size categories, particularly for the conforming, middle of the market loan segments that had been weak for much of the past year. FHA purchase application volume was up by 17 percent for the week on a seasonally adjusted basis.

Harlan Green © 2015

Follow Harlan Green on Twitter: https://twitter.com/HarlanGreen

Wednesday, July 2, 2014

Why the Growth Slowdown—It’s Housing, Stupid

Popular Economics Weekly

Dean Baker, a noted economist with the Center for Economic Policy and Research (NEPR), has probably given the best and most understandable reason for the Great Recession and ultra-slow recovery—it’s the lousy housing market. The economy is growing at slightly over 2 percent, when we would expect 3 percent growth 5 years after the end of the Great Recession.

fred

“The basic story of the Great Recession is about as simple as they come,” says Baker. “The economy was being driven by a housing bubble and the bubble burst. The combination of the loss of housing construction, due to the enormous overbuilding of the bubble years, and the loss of the consumption that had been driven by bubble generated housing wealth, created a gap in annual demand of more than $1 trillion. That's all simple and easy.”

So the weak housing market, even with the Fed doing all it can do to keep interest rates at rock bottom, hasn’t boosted US growth sufficiently to approach full employment. Why? The housing market would be recovering sooner if government was allowed to do more, because of austerity policies prevalent both here and in Europe. And the results are easy to see in this Paul Krugman graph.

krugman

Graph: Paul Krugman

Those countries with the lowest growth rates have the most stringent austerity measures—i.e., most drastic budget cuts and highest interest rates when government should be keeping interest rates as low as possible. And they are the United Kingdom, Spain, Portugal and Greece, of course. But the US isn’t far behind, in line with France that is having its own budget problems.

What should be done? We know the government has to help, either with mortgage relief (buy up the bad mortgages and hold them until the market improves), or buying the underwater housing as was done during the Great Depression, and selling them back when conditions improved.

The Home Owners’ Loan Corporation was set up in 1933 under the New Deal. It made more than one million loans to homeowners, sometimes bought the underwater homes, and otherwise supported homeowners who were behind on their payments. Sound familiar?

mortgages

Graph: FHFA

The HARP and HAMP loan programs were current attempts to do the same and they have refinanced 3 million of the 16 million homes guaranteed by Fannie Mae and Freddie, according to The Housing Wire and FHFA, the Federal Housing Finance Authority that supervises Fannie and Freddie.

“…what did economists think would fill a trillion dollar gap in annual spending?” laments Baker. “Of course the government could do it with more spending and/or tax cuts, but since we have a religious cult in Washington that says it is better to keep millions out of work than to run deficits, this was a political impossibility.”

So 8 million more homes are eligible, according to the FHFA, and the White House has done little to promote HARP 3.0, a newer version that would loosen qualification standards to increase eligibility for those behind on their payments, which would allow more homes to be refinanced. It doesn’t look like another New Deal for housing is in the offing.

Harlan Green © 2014

Follow Harlan Green on Twitter: https://twitter.com/HarlanGreen

Friday, June 6, 2014

Home Sizes Ballooning Again

The Mortgage Corner

Housing sizes are ballooning, after a slight pause due to the Great Recession, reports the U.S. Census Bureau and Marketwatch. In 2013 the median floor area of new single-family homes sold in the U.S. rose 4 percent to hit almost 2,500 square feet, according to recently released data from the U.S. Census Bureau.

That compares to the median 1,800-square-foot size of a single detached home, as reported in the 2011 American Housing Survey, when 40 percent of homes were 1-2,000 square feet in size.

largehomes

Graph: WSJ Marketwatch

The biggest new single-family homes of all were sold in the South, hitting a median of 2,534 square feet in 2013, up 1 percent from the prior year. Homes in the Northeast reached 2,456 square feet, up 3 percent. Homes in the Midwest measured 2,405 square feet, up 9 percent from 2012, and homes in the West hit 2,394 square feet, up 5 percent.

And prices continue to rise. The Case-Shiller Home Price Index of same-home sales has risen 12.4 percent in a year, and buyers are paying more for these larger homes. The median sales price of new single-family homes rose to $268,900 last year, up 10 percent from 2012.

What does that say? Those with the money are moving the various markets. The fastest growing segment are homes from 3,000 to 3,999 square feet, says the Census Bureau. Last year 9 percent of new single-family homes sold in the U.S. were at least 4,000 square feet, up from 8 percent in 2012. Meanwhile, the share of homes under 1,800 square feet fell to 17 percent in 2013, down from 22 percent in 2012 and 33 percent a decade earlier.

Existing-home sales are following the same trend. April’s sales of existing homes that cost at least $1 million grew more than 5 percent from a year earlier, while sales of homes under $250,000 fell more than 5 percent, according to the National Association of Realtors.

What will bring more buyers into the housing market? Even lower mortgage rates, it seems. Purchase mortgage applications are still declining since January, even though mortgage rates have plunged on late, with the 30-year conforming fixed rate falling to 3.875 percent, and Hi-Balance conforming fixed rates at 4.00 percent for 1 origination point.

mortgages

Graph: WSJ Marketwatch

So the big question remains whether middle class families will be able to afford those middle class homes anymore? That has as much to do with households starting up, or new household formation. And with so many of the 25 to 55 year-olds out of work, it may take years for households formation to pick up to the 1.2m per year average that prevailed before the Great Recession, from the current 600,000 new annual households being formed.

workers

Graph: Zero Hedge

For instance, in the April unemployment report, one of the most important age group for jobs, those workers aged 25-54 which represent the bulk of the US labor force and are also the best and most productive group, the total number of jobs tumbled from 95,360K to 95,151K, a drop of 209K, reports Zero Hedge.

Seniors were the winners. According to the establishment survey, the only beneficiary of whatever this jobs "recovery" is, were workers aged 55-69, that have gained 174,000 jobs to date.

Harlan Green © 2014

Follow Harlan Green on Twitter: https://twitter.com/HarlanGreen

Saturday, April 19, 2014

Q1 Wage Growth Highest in 4 Years

Popular Economics Weekly

This may finally be the year when jobs and the economic recovery are for real for most Americans. Median weekly wages grew at the fastest pace in the first quarter in more than four years, according to data released by the Labor Department on Thursday.

Why? Because unemployment rates are falling, and that pushes up wages, needless to say. And almost no wage growth since 2008 has kept consumers from spending more. Unemployment rates in all states had dropped below 9 percent for the first time since 2008. Twenty-one states have unemployment rate decreases, 17 states and the District of Columbia had increases, and 12 states had no change, the U.S. Bureau of Labor Statistics reported today.

clip_image002

Graph: Calculated Risk

Rhode Island had the highest unemployment rate among the states in March, 8.7 percent. The next highest rates were in Nevada and Illinois, 8.5 percent and 8.4 percent, respectively. North Dakota again had the lowest jobless rate, 2.6 percent. California still has the 4th highest unemployment rate at 7.9 percent.

clip_image004

Graph: WSJ Marketwatch

The 2.7 percent median wage growth in the first quarter was the strongest since the fourth quarter of 2009, when wages grew 2.8 percent. Importantly, the wage growth was faster than the 1.4 percent increase in seasonally adjusted consumer prices over the same period. Without adjusting for seasonality, median weekly wages were $796 in the first quarter.

It is important that wages are rising faster than inflation for the first time in 4 years. It means consumer purchasing power is increasing again. Household incomes have actually been stagnant for more than 30 years, only keeping up with inflation, so that most consumers had just enough income for necessities.

clip_image006

Graph: Econoday

Year-on-year, overall CPI inflation was 1.5 percent in March, compared to 1.1 percent in February (seasonally adjusted). The core rate increased 1.6 percent year-on-year, matching the rate for February. For March, not seasonally adjusted year-ago percent changes for total and core CPI were 1.5 percent and 1.7 percent, respectively.

Consumer price inflation firmed in March, but it was for just one month—not yet setting a trend. Within the Fed, the hawks likely will point to the stronger numbers while the doves will say it is too early to say that inflation is up to the 2 percent goal. This means driving is cheaper and eating is more expensive.

But Janet Yellen has been saying that interest rates will stay down much longer, even if inflation rises above their 2 percent target. And that can only hearten consumers and homebuyers who don’t want the Federal Reserve raising rates until they see a real jobs recovery and sustained wage increases.

Harlan Green © 2014

Follow Harlan Green on Twitter: https://twitter.com/HarlanGreen